2981
Towards Metabolic Brain Imaging with Glucosamine CEST MRI: In Vivo Characterization and First Insights1School of Chemistry, Tel-Aviv University, Tel Aviv, Israel, 2Department of Biomedical Engineering, Tel Aviv University, Tel Aviv, Israel, 3Sagol School of Neuroscience, Tel-Aviv University, Tel Aviv, Israel
Synopsis
Keywords: CEST & MT, Brain, Glucosamine, MRI, CEST, Metabolism, Brain Disorders
The uptake of glucosamine (GlcN), a non-toxic food supplement, can be monitored by CEST MRI. While previously demonstrated in breast cancer, here we show that GlcN metabolism can be detected in the brain. Following GlcN administration in mice, the MTRasym signals were significantly elevated in the cortex, hippocampus, and striatum. A Lorentzian multi-pool fitting pointed to a significant increase in the hydroxyl, amide, and rNOE signals. An in vitro BSA study confirmed the interactions between brain compounds and GlcN shown in vivo. This study suggests that GlcN CEST has the potential to serve as a metabolic biomarker in brain disorders.INTRODUCTION
Abnormal metabolism is a critical factor in many brain disorders. Imaging techniques capable to detect pathological alterations of the brain metabolism are useful in different diagnostic processes. Chemical exchange saturation transfer (CEST) MRI is an increasingly investigated imaging technique that enables non-invasive measurement of metabolic activity in real-time in living organisms. Glucose uptake and metabolism are sensitive biomarkers for cellular function in many diseases. The brain relies on glucose for its energy supply; thus, monitoring the uptake and metabolism of glucose in the brain may be highly useful in the clinic, as extensively shown in previous glucose analog studies1,2. We recently demonstrated the ability of glucosamine (2-amino-2-deoxy-D-glucose, GlcN) CEST-MRI to detect breast cancer in mice3,4 and humans5. Here we propose that systemic alterations in GlcN brain uptake can be detected with CEST MRI. For providing an estimation of brain metabolic activity and the source of the GlcN CEST signal, the sensitivity and specificity of GlcN CEST signals were examined in phantom models that closely reflect the intracellular environment of the normal mouse brain6 along with 13C NMR spectroscopy studies of extracts from brains treated with enriched 13C GlcN. This study aims to validate and develop in vivo GlcN MRI-CEST method in healthy mice brains for the detection of brain disorders in the future.METHODS
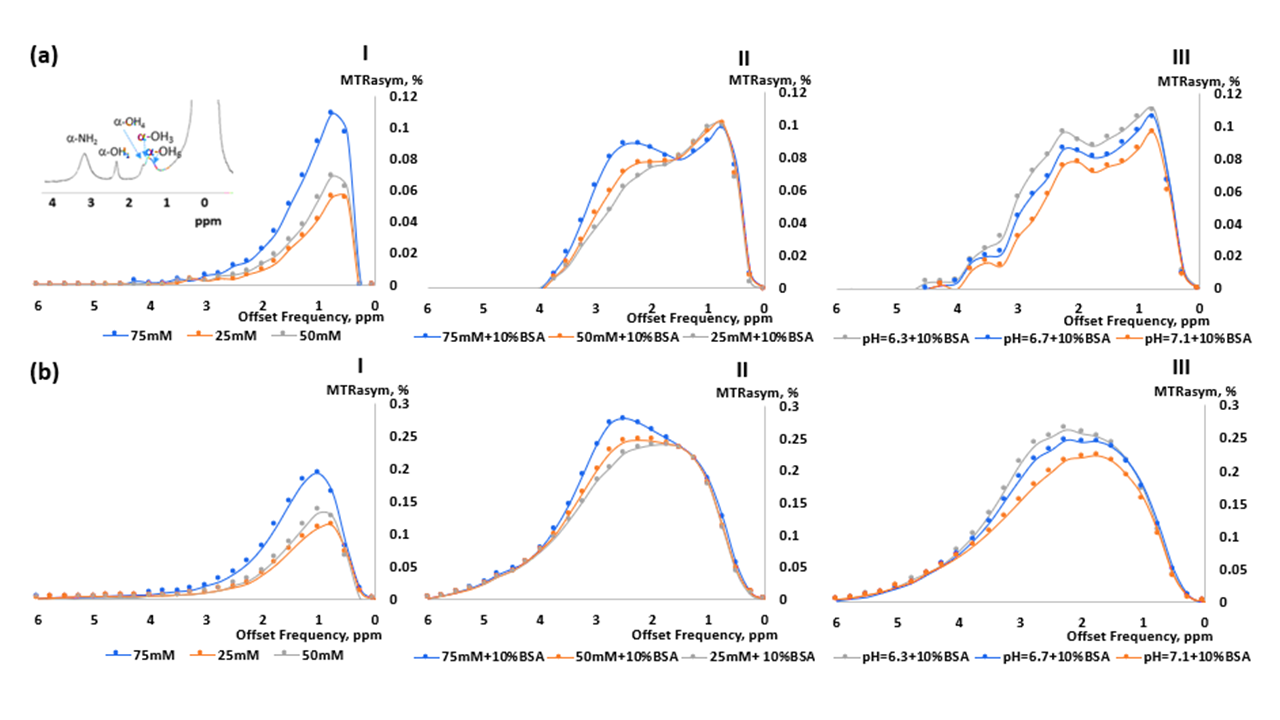
To mimic the different GlcN CEST pools following the interaction with brain tissue, phantoms based on a mixture of GlcN (25-75 mM) and bovine serum albumin (BSA, 10% w/v6) were prepared and titrated to physiological/pathological pH (6.3-7.1). In vivo MRI experiments were carried out using 3-month-old healthy mice (white ICR, N=3) at a Bruker 7T BioSpec scanner. Imaging was performed before and after GlcN treatment (GlcN Sulfate in saline, 2.5 g/kg, IV). Mice were fasted for at least 4 h (with water access) before the experiments, anesthetized with isoflurane (1–1.2%) mixed with oxygen, and the brains were scanned using a quadrature coil. For CEST imaging, Z-spectra was obtained using a CEST-EPI protocol, employing a saturation pulse power of 2 μT, Tsat = 2 s, TE/TR = 20/8000 ms, and saturation frequency offsets of 7 to −7 ppm with 0.25 ppm increments (acquisition time = 7:45 min:s). For the static magnetic field calculation, a B0 map was acquired, and the WASSR7 method was used (FOV, 19mmx19mm; MTX, 64×64; fat suppressed-on, NA=1). CEST signals were analyzed in the ROIs based on the magnetization transfer asymmetry ratio (MTRasym) metric and multi-pool Lorentzian fitting8. All data were processed in MATLAB. The preparation of brain extracts was performed as described in reference4.RESULTS
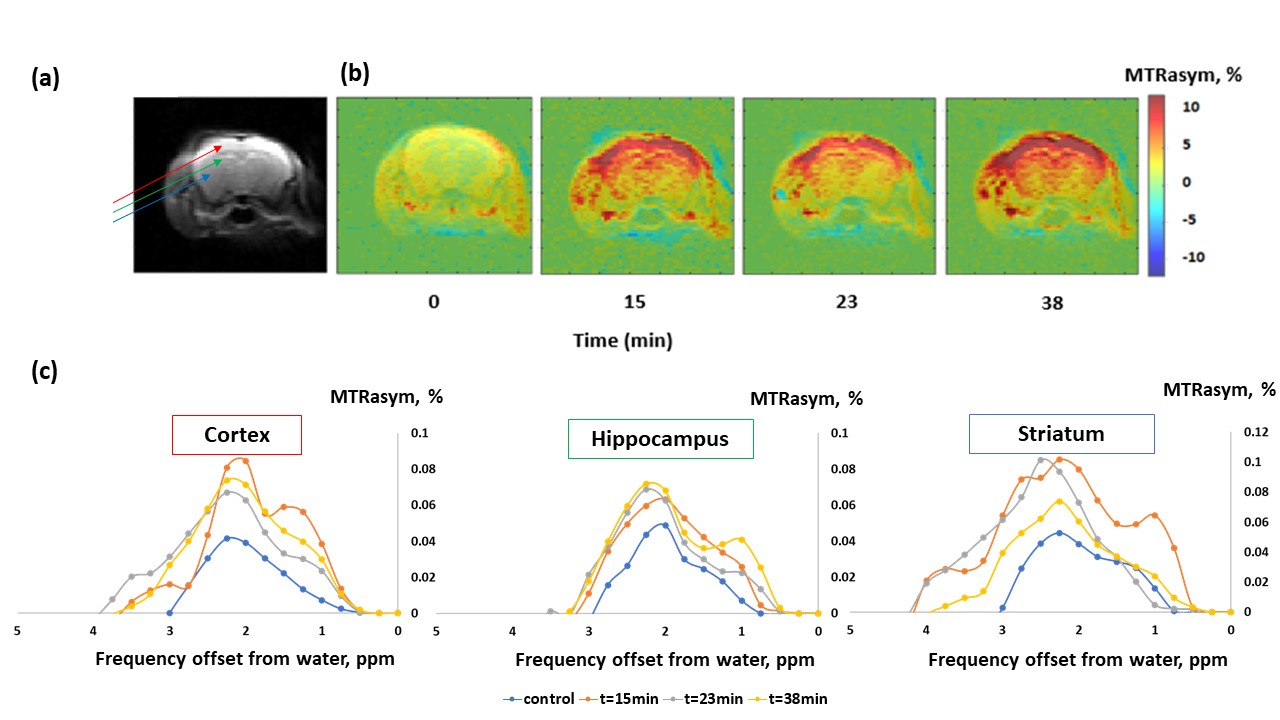
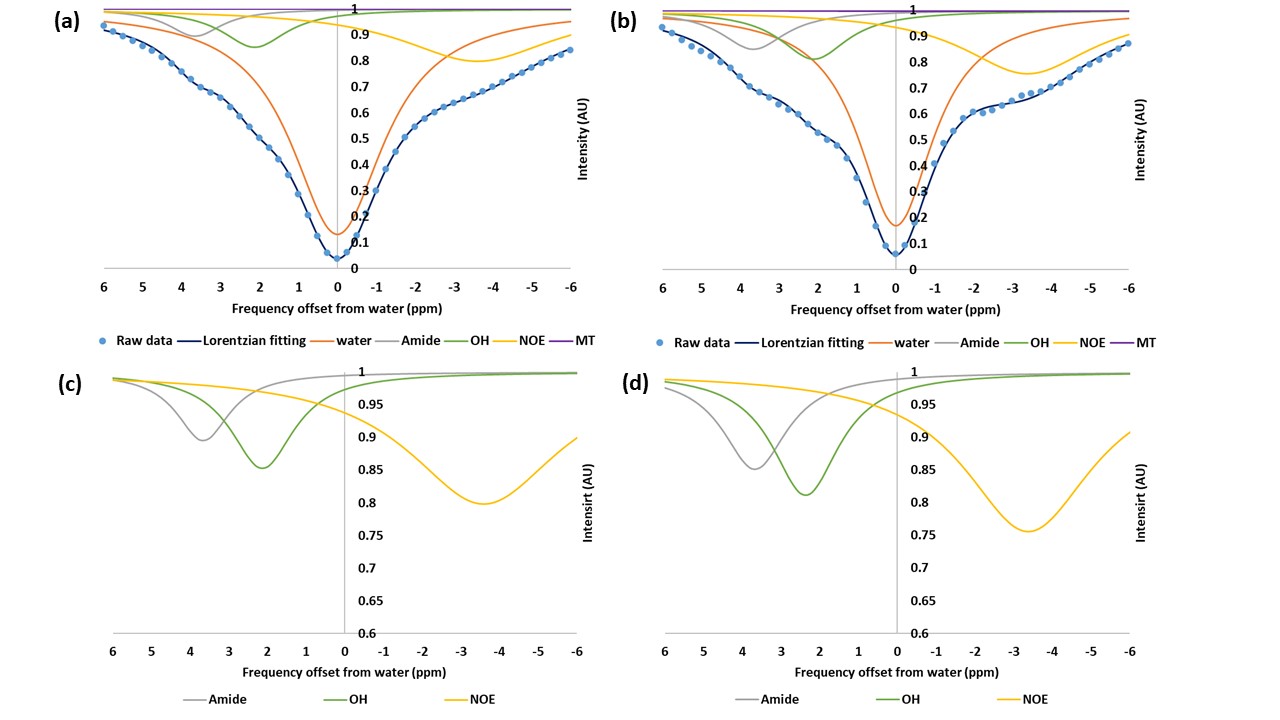
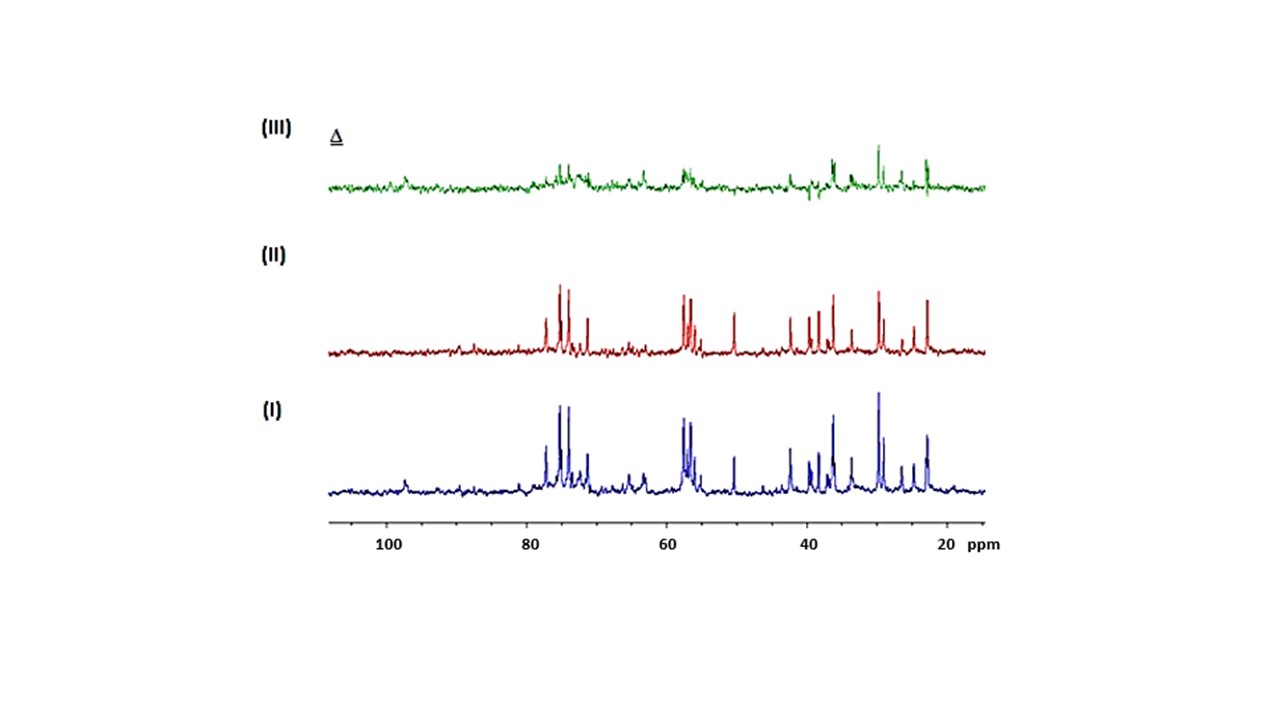
Figure 1 shows the MTRasym trend obtained in GlcN/BSA phantoms. Clear differences were obtained between the MTRasym originating from phantoms of GlcN only and those containing GlcN-BSA. Analysis of signal intensities from ROIs in the healthy mice brains revealed that GlcN treatment resulted in higher CEST values in the cortex, hippocampus, and striatum regions, with a maximum MTRasym effect ~2 ppm, and incremental increases of up to 2.4±1.9%, 1.8±1.6%, and 3.3±1.4% (N=3), respectively (Fig.2). The Z-spectra of healthy mice brains had distinct GlcN CEST peaks corresponding to the presence of hydrogen exchange between free water and hydroxyl, amide, and relayed nuclear Overhauser enhancement (NOE) from aliphatic groups, all yielded larger CEST integrals in the cortex after GlcN uptake by an averaged factor of 1.3, 1.7 and 1.2, respectively (Fig.3). The 1H-decoupled 13C NMR spectra of brain extracts revealed details about GlcN transport into the brain (Fig.4) as well as possible GlcN metabolic products2 that may contribute to the increase in the overall CEST signal in the ROIs.DISCUSSION
The phantoms containing GlcN-BSA mimic the intracellular environment of a normal mouse brain. The demonstrated correlation between the CEST signal amplitude and GlcN concentration indicates the ability of GlcN to serve as a brain metabolism biomarker. In addition, the BSA study revealed the influence of the intracellular metabolites on the GlcN CEST profile. Preliminary in vivo GlcN CEST-MRI showed that the GlcN signal can be detected in the brains of healthy mice. Both the asymmetry analysis and the multi-pool Lorentzian fitting may assist in detecting dynamic changes in the brain CEST signal upon administration of GlcN. The in vivo contrast remained stable for over 40 minutes, longer than demonstrated with other glucose analogs2,9, an essential factor for practical brain imaging. This can be attributed to GlcN or its metabolic product accumulation in the brain.CONCLUSION
Our preliminary findings suggest that the GlcN CEST technique, similar to the FDG-PET method, may be useful as a non-invasive indicator of GlcN metabolism in the brain, allowing for the characterization of the metabolic state of the brain. The technique may open new avenues for in vivo mapping of GlcN uptake to aid in the diagnosis and prognosis of brain disorders.Acknowledgements
No acknowledgement found.References
1. Nasrallah FA, et al. Imaging Brain Deoxyglucose Uptake and Metabolism by Glucocest MRI. J Cerebral Blood Flow & Metabolism. 2013;33(8):1270-1278. doi:10.1038/jcbfm.2013.79.
2. Sehgal AA, et al. CEST MRI of 3-O-methyl-D-glucose uptake and accumulation in brain tumors. Magn Reson Med. 2019;81(3):1993-2000. doi: 10.1002/mrm.27489.
3. Rivlin, M, Navon, G. Glucosamine and N-acetyl glucosamine as new CEST MRI agents for molecular imaging of tumors. Sci. Rep. 2016; 6 (32648) doi:10.1038/srep32648
4. Rivlin M, Navon, G. Molecular imaging of cancer by glucosamine chemical exchange saturation transfer MRI: A preclinical study. NMR Biomed. 2021;34(2):e4431.
5. Rivlin M, et al. Breast cancer imaging with glucosamine CEST (chemical exchange saturation transfer) MRI: first human experience. Eur Radiol. 2022. doi: 10.1007/s00330-022-08772-w.
6. Ray KJ, et al. Determination of an optimally sensitive and specific chemical exchange saturation transfer MRI quantification metric in relevant biological phantoms. NMR Biomed. 2016;29(11):1624-1633. doi: 10.1002/nbm.3614.
7. Kim M, et al. Water saturation shift referencing (WASSR) for chemical exchange saturation transfer (CEST) experiments magnetic resonance in medicine: an official. Proc Int Soc Magn Reson Med. 2009; 61: 1441- 1450.
8. Zaiss M, et al. Quantitative separation of CEST effect from magnetization transfer and spillover effects by Lorentzian-line-fit analysis of z-spectra. J Magn Reson. 2011;211(2):149-155.
9. Rivlin M, Navon G. Molecular imaging of tumors by chemical exchange saturation transfer MRI of glucose analogs. Quant Imaging Med Surg. 2019;9(10):1731-46.
Figures