2980
Dynamic Glucose Enhanced MRI of Brain Tumors using Direct Water Saturation1Radiology, F.M. Kirby Research Center, Johns Hopkins University, Kennedy Krieger Institute, Baltimore, MD, United States, 2Radiology/F.M. Kirby Research Center, Johns Hopkins University, Kennedy Krieger Institute, Baltimore, MD, United States, 3Department of Medical Radiation Physics, Lund University, Lund, Sweden, 4Department of Oncology, Johns Hopkins University, Baltimore, MD, United States, 5Neurology, Johns Hopkins University, Baltimore, MD, United States, 6Neurology, Johns Hopkins University, Kennedy Krieger Institute, Baltimore, MD, United States, 7F.M. Kirby Research Center, Radiology, Medical Radiation Physics, Kennedy Krieger Institute, Johns Hopkins University, Lund University, Baltimore, MD, United States
Synopsis
Keywords: CEST & MT, Cancer, Glucose
The transverse relaxation time (T2) of water is affected by the presence of exchangeable protons that are chemically shifted with respect to the water protons. We use direct saturation (DS) MRI to dynamically measure this effect during infusion of D-glucose to assess its uptake in brain tumors. The change in T2 becomes apparent as a line broadening of the DS spectrum, which is acquired using a whole-brain water saturation shift reference (WASSR) acquisition. First results using 0.5g/kg D-glucose show linewidth changes on the order of a few Hertz in glioma patients, allowing separation of tumor tissue from healthy brain tissue.
Introduction
In recent years, there has been increasing interest in the use of sugars as contrast agents for MRI,1-3 especially agents already approved for human use, such as D-Glucose (D-Glc). The uptake of D-Glc in tumor patients has been studied using chemical exchange saturation transfer (CEST) MRI4-6 and chemical exchange sensitive spin lock (CESL) MRI.7-9 While effects in animals10,11 and humans6,12 at higher field strengths show promising results, studies at 3T have been hampered by low effect size and, as a consequence, sensitivity to motion.5,13,14 Motion can result in pseudo-enhancement at tissue interfaces either due to tissue mixing or small B0 shifts that affect the signal magnitude. Here we propose using the water direct saturation (DS) spectrum for dynamic glucose enhanced (DGE) MRI, the width of which depends on B1, T1 and T2. Of these, T2 is sensitive to chemical exchange,15,16 which has been used to study D-Glc uptake in animals.16 The water DS spectrum,17,18 such as for instance acquired in a water-saturation-shift-reference (WASSR)19 experiment, provides information both on changes in T2 (from the linewidth, LW), and B0 (from the frequency shift of the Lorentzian line shape). First results show that this can be used to successfully assess DGE MRI changes at 3T.Materials and Methods
Saturation parameters were optimized with Bloch-McConnel simulations (Python script) using (1) the known exchange rates and frequency offsets for the OH groups in D-Glc;5,20 (2) a 10mM increase in blood D-Glc concentration after infusion (baseline concentration 5mM). Parameters are in Table 1. Six patients with recurrent glioma were scanned using either a 25-g infusion or a 0.5-g/kg infusion maximized at 35g. Studies were approved by the local Institutional Review Board (IRB); all patients provided written informed consent. The imaging protocol used the optimized saturation parameters: B1=0.5µT and tsat=0.5s, followed by a whole-brain simultaneous multi-slice readout (multi-band factor 3). A total of 27 slices were acquired with voxel-size 2.2x2.2x4.4 mm3; time per frequency point was 1200ms (TE=17ms). Total time per DS spectrum was 38.4s for 32 frequencies, of which 4 acquisitions at 10 ppm offset to determine S0 for Z-spectral normalization and the remaining 28 over a 10-ppm range with an increased sampling density of 0.1ppm increments in the ±1ppm range. Experiment duration, including a 4min baseline, infusion at a rate of 6.25g/min, and post-infusion monitoring, was 18.5min. Data were analyzed by fitting the Lorentzian line shape of the DS spectrum using a deep learning model. Results were used to determine the linewidth (LW), an approach that is independent of B0 changes. Dynamic contrast enhanced (DCE)- and dynamic susceptibility contrast (DSC) MRI were also performed after the D-Glc imaging, and perfusion- and perfusion related parameters calculated, e.g. to assess tumor leakage.Results
Fig. 1 shows Bloch-McConnel simulations of changes in LW of DS spectra as a function of B1 and tsat (2D plots in Fig. 1c-e), using the baseline water relaxation rates in Table 1 and the assumed tissue parameters listed below the Table. An example of the fitting is shown for arterial blood before and after infusion. The 2D plots show that the effect is increasing with B1 and tsat, with background signals from CEST and MTC becoming significant at higher values of both. To maximize the effect but minimize the background signals we chose B1=0.5µT and tsat=500ms. Table 1 shows the results for several tissues indicating that the Z-spectral water LW is sensitive to D-Glc uptake and that it should be possible to detect the tumor core of glioblastomas (GBMs).Fig. 2 shows DS-DGE MRI results for a GBM patient who had previously undergone surgery. The data show that this approach likely has sufficient sensitivity to detect active tumor (see LW difference area under the curve (AUC) image) and corresponding delta-linewidth curves for DGE in Gd-enhanced rim. Enhancement corresponds to enhancements found in K2 and Ktrans images. The data in Fig. 2 are with an infusion of 25g D-Glc. We recently received permission from the IRB to use a D-Glc dose based on body weight (0.5g/kg). This allows us to infuse up to 35 g instead of 25g, increasing the effect size. Some first higher-dose data using the T2-approach at 3T show promise (Fig. 3). Enhancements found in DS-DGE correspond to enhancements in Ktrans and corrected CBV, but not K2. The effect size in the tumor rim is about 2Hz. The DS-DGE image is calculated by taking the AUC of the uptake curve in each voxel.Discussion
In this study we implemented a new approach, DS-DGE MRI, to assess D-Glc uptake in brain tumors. Contrary to glucoCESL and single-frequency glucoCEST MRI, this approach has inherent capability of B0 assessment, avoiding effects of B0 changes on the DGE results. Increasing the D-Glc to 35g (0.5g/kg) showed excellent quality uptake curves based on the LW changes of the Lorentzian curve acquired in DS-DGE MRI. This approach employs low B1 and short tsat and can easily be implemented on clinical scanners.Conclusion
We presented a new method to image sugar uptake in the brain based on acquiring a dynamic series of DS spectra on a voxel-by-voxel basis and assessing the LW increase due to a decrease in T2.Acknowledgements
No acknowledgement found.References
1. L. Knutsson, X. Xu, P. C. M. van Zijl and K. W. Y. Chan, Imaging of sugar-based contrast agents using
their hydroxyl proton exchange properties. NMR in biomedicine, 2022, e4784
2. D. Paech and A. Radbruch, Dynamic Glucose-Enhanced MR Imaging. Magn Reson Imaging Clin N Am,
2021, 29, 77-81
3. M. Rivlin and G. Navon, Molecular imaging of tumors by chemical exchange saturation transfer MRI of
glucose analogs. Quant Imaging Med Surg, 2019, 9, 1731-1746
4. A. Seidemo, P. M. Lehmann, A. Rydhog, R. Wirestam, G. Helms, Y. Zhang, N. N. Yadav, P. C. Sundgren,
P. C. M. van Zijl and L. Knutsson, Towards robust glucose chemical exchange saturation transfer imaging
in humans at 3 T: Arterial input function measurements and the effects of infusion time. NMR in
Biomedicine, 2022, 35, e4624
5. X. Xu, A. A. Sehgal, N. N. Yadav, J. Laterra, L. Blair, J. Blakeley, A. Seidemo, J. M. Coughlin, M. G.
Pomper, L. Knutsson and P. C. M. van Zijl, d-glucose weighted chemical exchange saturation transfer
(glucoCEST)-based dynamic glucose enhanced (DGE) MRI at 3T: early experience in healthy volunteers
and brain tumor patients. Magn Reson Med, 2020, 84, 247-262
6. X. Xu, N. N. Yadav, L. Knutsson, J. Hua, R. Kalyani, E. Hall, J. Laterra, J. Blakeley, R. Strowd, M.
Pomper, P. Barker, K. Chan, G. Liu, M. T. McMahon, R. D. Stevens and P. C. van Zijl, Dynamic Glucose-
Enhanced (DGE) MRI: Translation to Human Scanning and First Results in Glioma Patients. Tomography,
2015, 1, 105-114
7. K. Herz, T. Lindig, A. Deshmane, J. Schittenhelm, M. Skardelly, B. Bender, U. Ernemann, K. Scheffler
and M. Zaiss, T1ρ-based dynamic glucose-enhanced (DGEρ) MRI at 3 T: method development and early
clinical experience in the human brain. Magn Reson Med, 2019, 82, 1832-1847
8. D. Paech, P. Schuenke, C. Koehler, J. Windschuh, S. Mundiyanapurath, S. Bickelhaupt, D. Bonekamp, P.
Baumer, P. Bachert, M. E. Ladd, M. Bendszus, W. Wick, A. Unterberg, H. P. Schlemmer, M. Zaiss and A.
Radbruch, T1rho-weighted Dynamic Glucose-enhanced MR Imaging in the Human Brain. Radiology,
2017, 285, 914-922
9. P. Schuenke, D. Paech, C. Koehler, J. Windschuh, P. Bachert, M. E. Ladd, H. P. Schlemmer, A. Radbruch
and M. Zaiss, Fast and Quantitative T1rho-weighted Dynamic Glucose Enhanced MRI. Sci Rep, 2017, 7,
42093
10. T. Jin, B. Iordanova, T. K. Hitchens, M. Modo, P. Wang, H. Mehrens and S. G. Kim, Chemical exchange-
sensitive spin-lock (CESL) MRI of glucose and analogs in brain tumors. Magn Reson Med, 2018, 80, 488-
495
11. X. Xu, K. W. Chan, L. Knutsson, D. Artemov, J. Xu, G. Liu, Y. Kato, B. Lal, J. Laterra, M. T. McMahon
and P. C. van Zijl, Dynamic glucose enhanced (DGE) MRI for combined imaging of blood-brain barrier
break down and increased blood volume in brain cancer. Magn Reson Med, 2015, 74, 1556-1563
12. P. Schuenke, C. Koehler, A. Korzowski, J. Windschuh, P. Bachert, M. E. Ladd, S. Mundiyanapurath, D.
Paech, S. Bickelhaupt, D. Bonekamp, H. P. Schlemmer, A. Radbruch and M. Zaiss, Adiabatically prepared
spin-lock approach for T1ρ-based dynamic glucose enhanced MRI at ultrahigh fields. Magn Reson Med,
2017, 78, 215-225
13. M. Kim, F. Torrealdea, S. Adeleke, M. Rega, V. Evans, T. Beeston, K. Soteriou, S. Thust, A. Kujawa, S.
Okuchi, E. Isaac, W. Piga, J. R. Lambert, A. Afaq, E. Demetriou, P. Choudhary, K. K. Cheung, S. Naik, D.
Atkinson, S. Punwani and X. Golay, Challenges in glucoCEST MR body imaging at 3 Tesla. Quant
Imaging Med Surg, 2019, 9, 1628-1640
14. M. Zaiss, K. Herz, A. Deshmane, M. Kim, X. Golay, T. Lindig, B. Bender, U. Ernemann and K. Scheffler,
Possible artifacts in dynamic CEST MRI due to motion and field alterations. Journal of magnetic
resonance, 2019, 298, 16-22
15. J. C. Gore, M. S. Brown, C. T. Mizumoto and I. M. Armitage, Influence of glycogen on water proton
relaxation times. Magn Reson Med, 1986, 3, 463-466
16. N. N. Yadav, J. Xu, A. Bar-Shir, Q. Qin, K. W. Chan, K. Grgac, W. Li, M. T. McMahon and P. C. van Zijl,
Natural D-glucose as a biodegradable MRI relaxation agent. Magn Reson Med, 2014, 72, 823-828
17. R. V. Mulkern and M. L. Williams, The general solution to the Bloch equation with constant rf and
relaxation terms: application to saturation and slice selection. Med Phys, 1993, 20, 5-13
18. S. A. Smith, J. W. Bulte and P. C. van Zijl, Direct saturation MRI: theory and application to imaging brain
iron. Magn Reson Med, 2009, 62, 384-393
19. M. Kim, J. Gillen, B. A. Landman, J. Zhou and P. C. van Zijl, Water saturation shift referencing (WASSR)
for chemical exchange saturation transfer (CEST) experiments. Magn Reson Med, 2009, 61, 1441-1450
20. M. Zaiss, A. Anemone, S. Goerke, D. L. Longo, K. Herz, R. Pohmann, S. Aime, M. Rivlin, G. Navon, X.
Golay and K. Scheffler, Quantification of hydroxyl exchange of D-Glucose at physiological conditions for
optimization of glucoCEST MRI at 3, 7 and 9.4 Tesla. NMR in biomedicine, 2019, 32, e4113
Figures
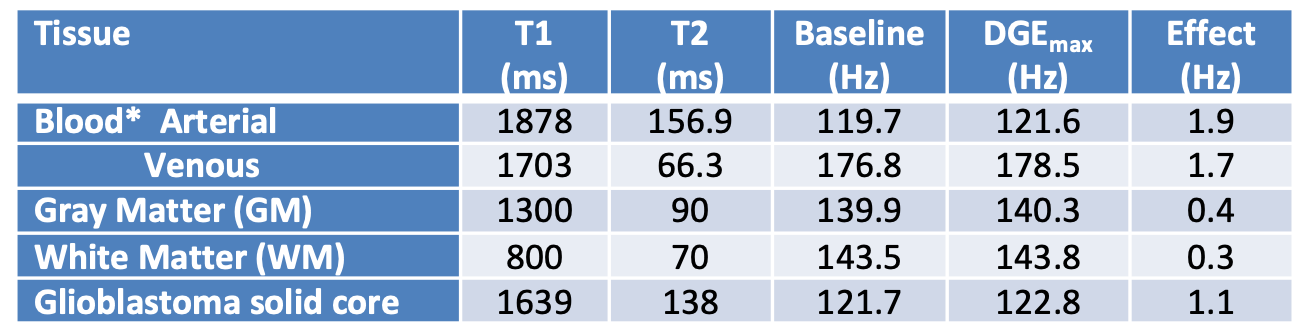
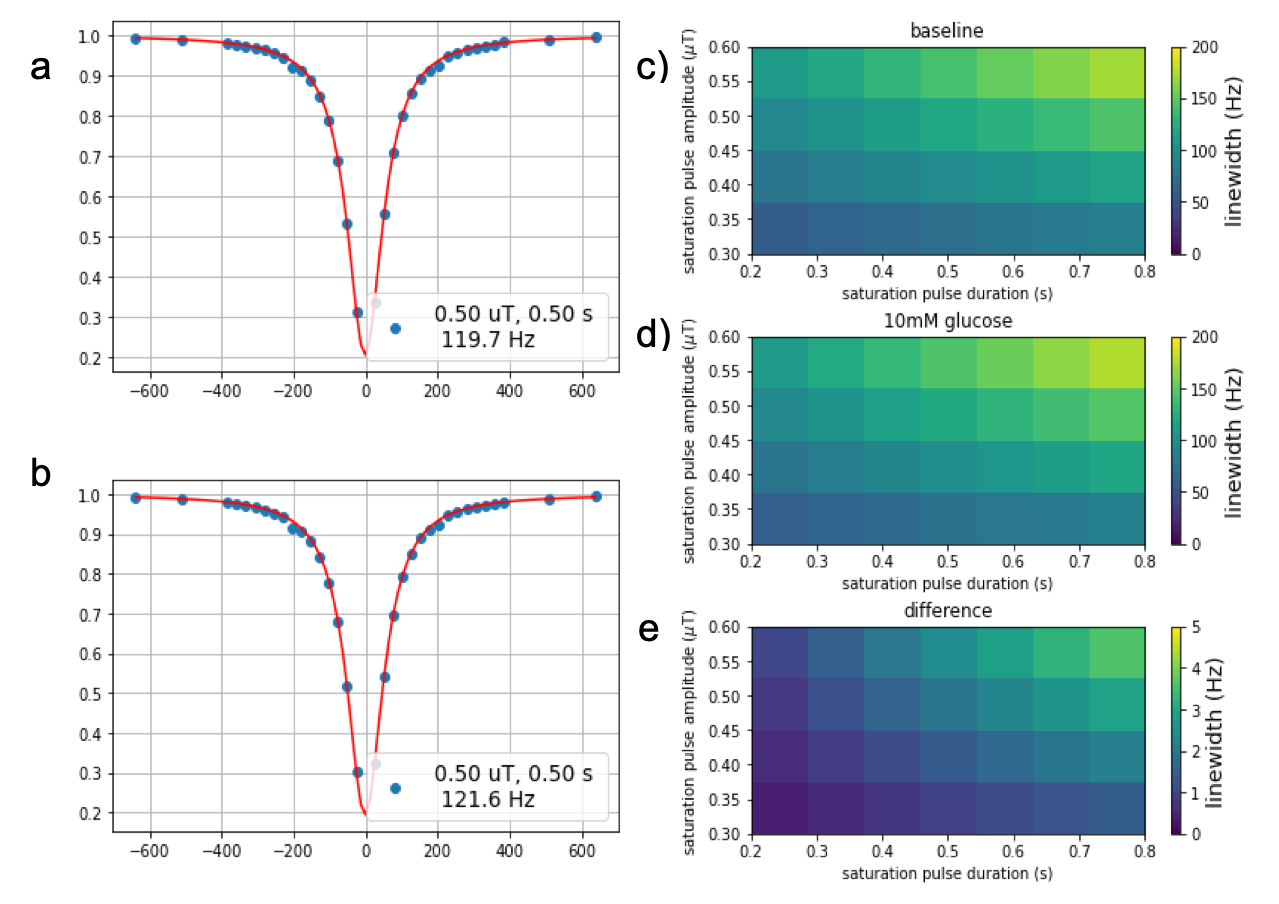
Figure 1. Simulated water Z-spectra (WASSR) before (a) and after (b) an increase of 10 mM in D-Glc concentration. Linewidth at baseline (c) and after infusion (d), and linewidth difference (e) show that the effect increases as a function of B1 (µT) and tsat (s).
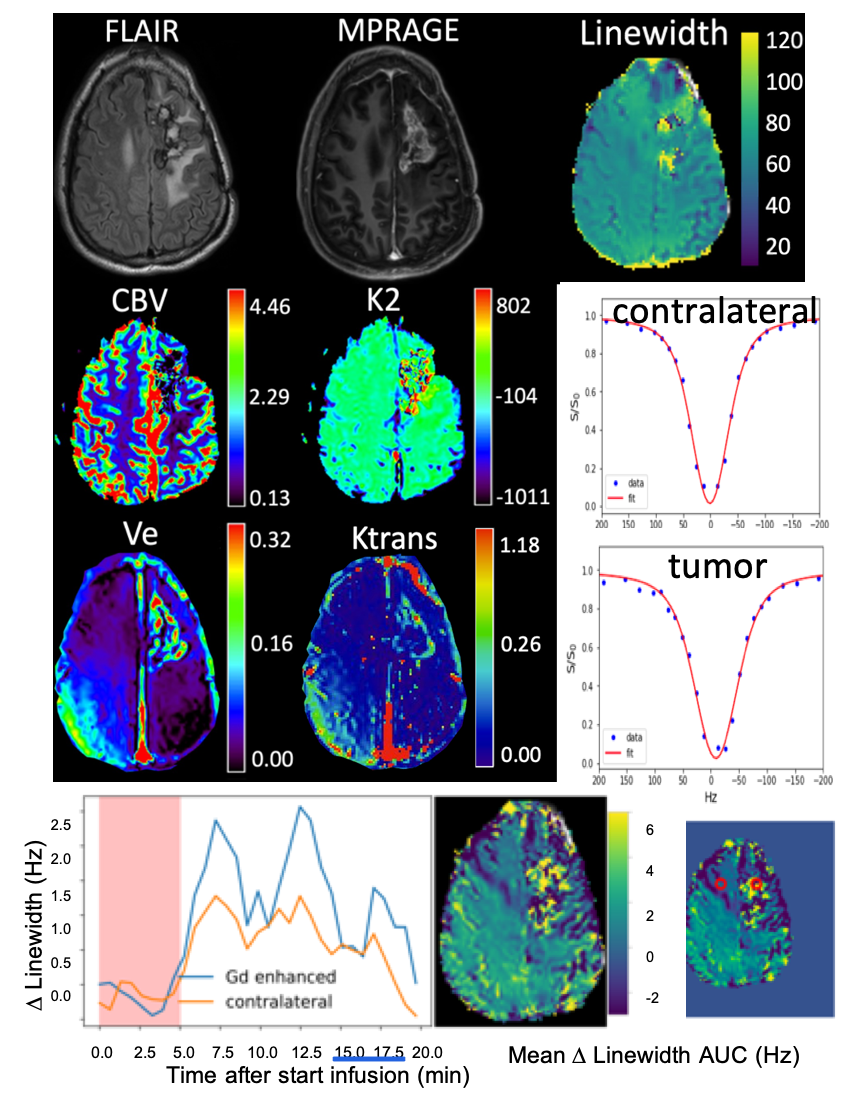
Figure 2: Clinical images (FLAIR, MPRAGE) and parameter images for DCE (Ve, Ktrans), DSC (corrected CBV and K2 (leakage)) and DS-DGE for a grade IV GBM patient who had previously undergone surgery. Maps of LW and of the AUC of the LW difference based DGE uptake curves are of good quality. Examples of LW fits for tumor and contralateral as well as uptake curves for the LW difference (Δ-LW) are given for the ROIs indicated in red in the small version of the AUC map.
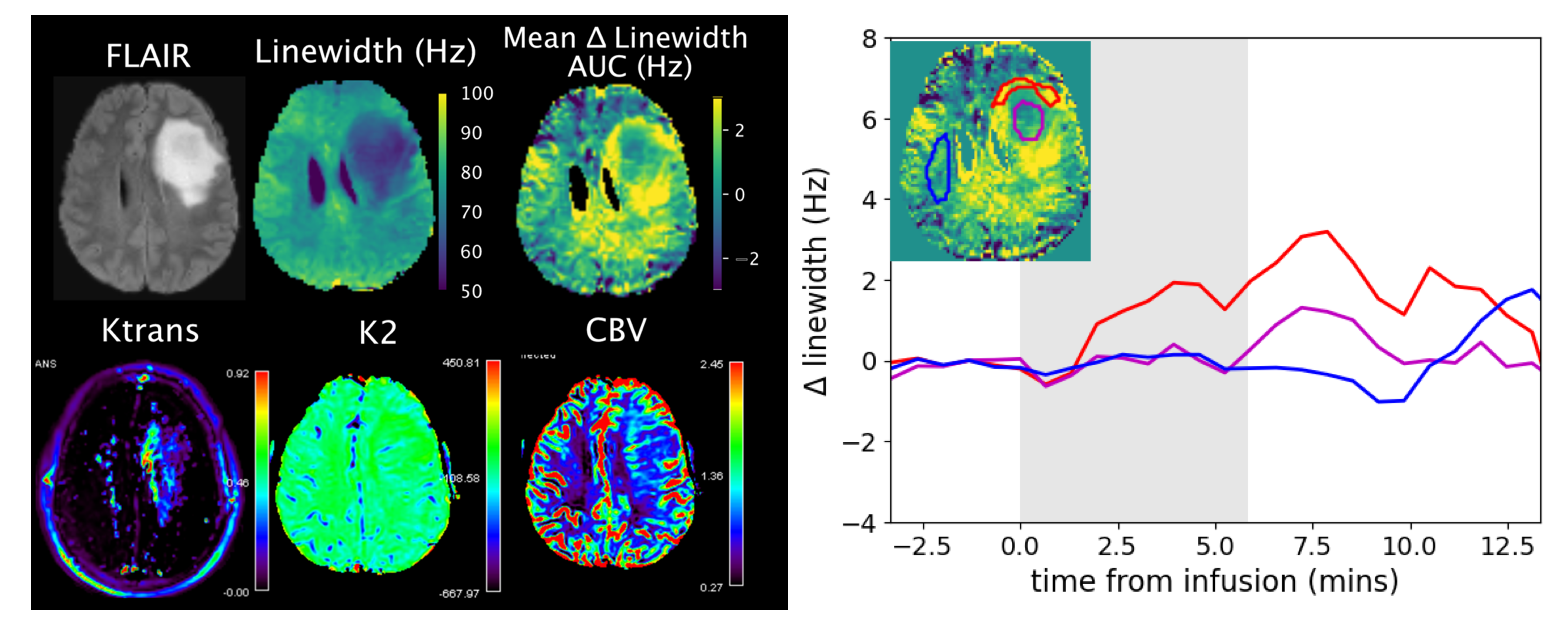
Figure 3: 3T DS-DGE data (35 g D-Glc) for a patient with IDH-mutant astrocytoma and suspected malignant transformation. DS-DGE based on the mean DLW-AUC identifies an enhancing rim with blood-brain barrier (BBB) breakdown, also visible on Ktrans and corrected CBV.