2979
Characterization of glycogen storage disease type III using glycoNOE MRI1The Russell H. Morgan Department of Radiology, The Johns Hopkins University School of Medicine, Baltimore, MD, United States, 2F.M. Kirby Research Center for Functional Brain Imaging, Kennedy Krieger Institute, Baltimore, MD, United States, 3Ultragenyx Pharmaceutical Inc., Novato, CA, United States
Synopsis
Keywords: CEST & MT, CEST & MT, liver
Glycogen storage disease type III (GSD III) is characterized by abnormally high glycogen accumulation in liver, muscle, and heart. Treatments such as diet modification and drugs are currently being developed, but there is a lack of suitable methods for assessing disease load and possible treatment efficacy. Recently, it was shown that glycoNOE MRI can image glycogen levels in vivo and here we apply this technique to distinguish GSD III from controls in a mouse model. The results show that glycoNOE can clearly distinguish GSD III and that glycoNOE contrast exhibits a linear correlation with ex vivo quantification of glycogen levels.Introduction
Glycogen storage disorders (GSDs) are often caused by loss of function mutations of the glycogen debranching enzyme thus resulting in pathogenic glycogen accumulation in tissue. Excessive tissue glycogen can lead to medium or severe cognitive and motor impairments, and even death.1 GSD III is one such GSD caused by a mutation in the Agl (Amylo-1,6-glucosidase) gene. Patients with GSD III disease often present with an enlarged liver and abnormally high levels of glycogen in the liver, muscle, and heart2 which eventually leads to organ failure. Currently, there is no cure for GSD III, but disease load can be managed by diet modification and several therapies to stop disease progression are under development.1Recent saturation transfer experiments have shown that glycogen levels can be assessed non-invasively using the magnetic coupling between glycogen aliphatic protons and water via the relayed nuclear Overhauser effect (rNOE).3 These glycogen rNOE (glycoNOE) experiments could quantify glycogen levels in mouse liver and generate maps with high spatial and temporal resolution. Here, we employ glycoNOE MRI to assess glycogen levels in an Agl-KO mouse model.4
Methods
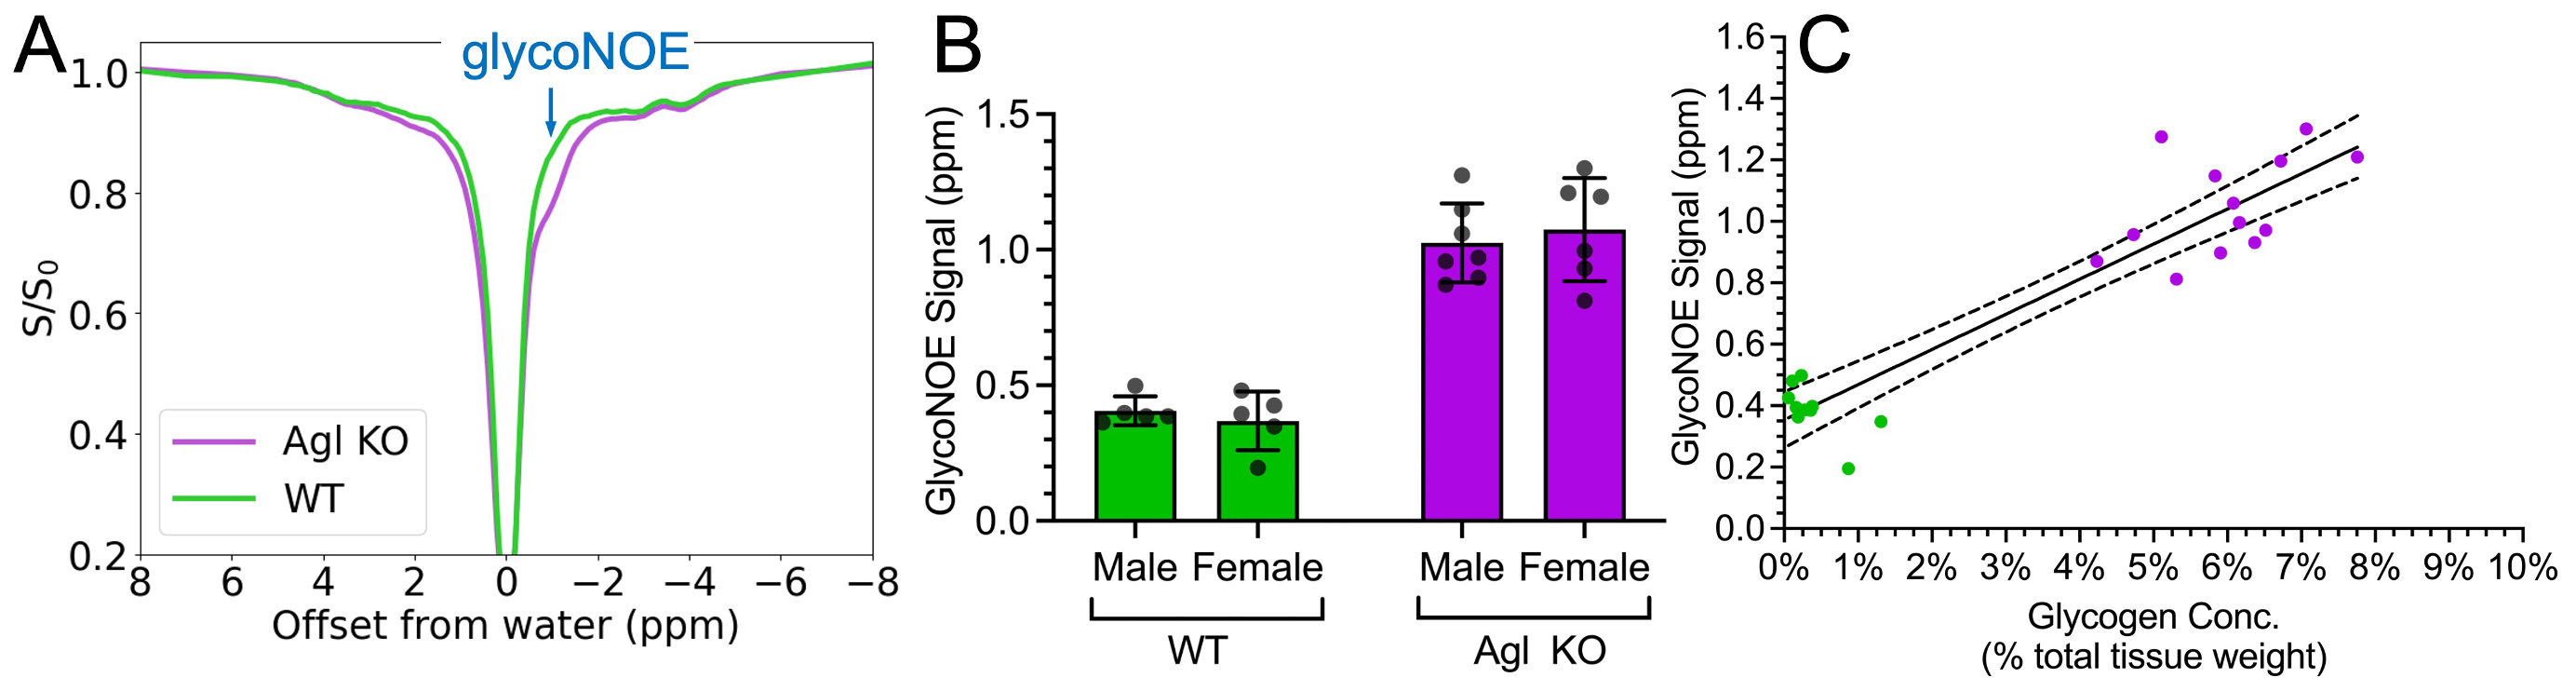
All experiments were performed with the approval of and in accordance with Johns Hopkins University Animal Care and Use Committee guidelines. Agl knockout mice (n=13) and age-matched (age 8-10 weeks) wild-type controls (n=10) with mixed sex were studied using an 11.7 T Bruker Biospec scanner (Bruker, Ettlingen, Germany). The mice were fasted for 12 to 16 hours before the MRI scans. An ultrashort echo time saturation transfer (UTE-ST) pulse sequence with a radial sampling scheme was used to acquire the data.5 Saturation pulse duration was 50 ms with an amplitude of 0.7 μT. A total of 115 saturation frequencies was acquired, including seven frequencies far from water used as S0 for Z-spectrum normalization. In-plane field of field (FOV) was 28 mm x 28 mm, with matrix size of 96 x 96. Slice thickness was 6 mm.Water shifts caused by B0 inhomogeneities were corrected for by fitting the direct water saturation signal. The glycoNOE signals were quantified using a multi-Lorentzian fitting method with four pools. The fitted water component was removed from the Z spectrum, then the glycoNOE level was estimated from the integral of residual spectrum between -0.6 to -1.4 ppm. The region of interest (ROI) was the whole liver. GlycoNOE signals were compared to concentrations determined using biochemical analysis of excised tissue.
Results
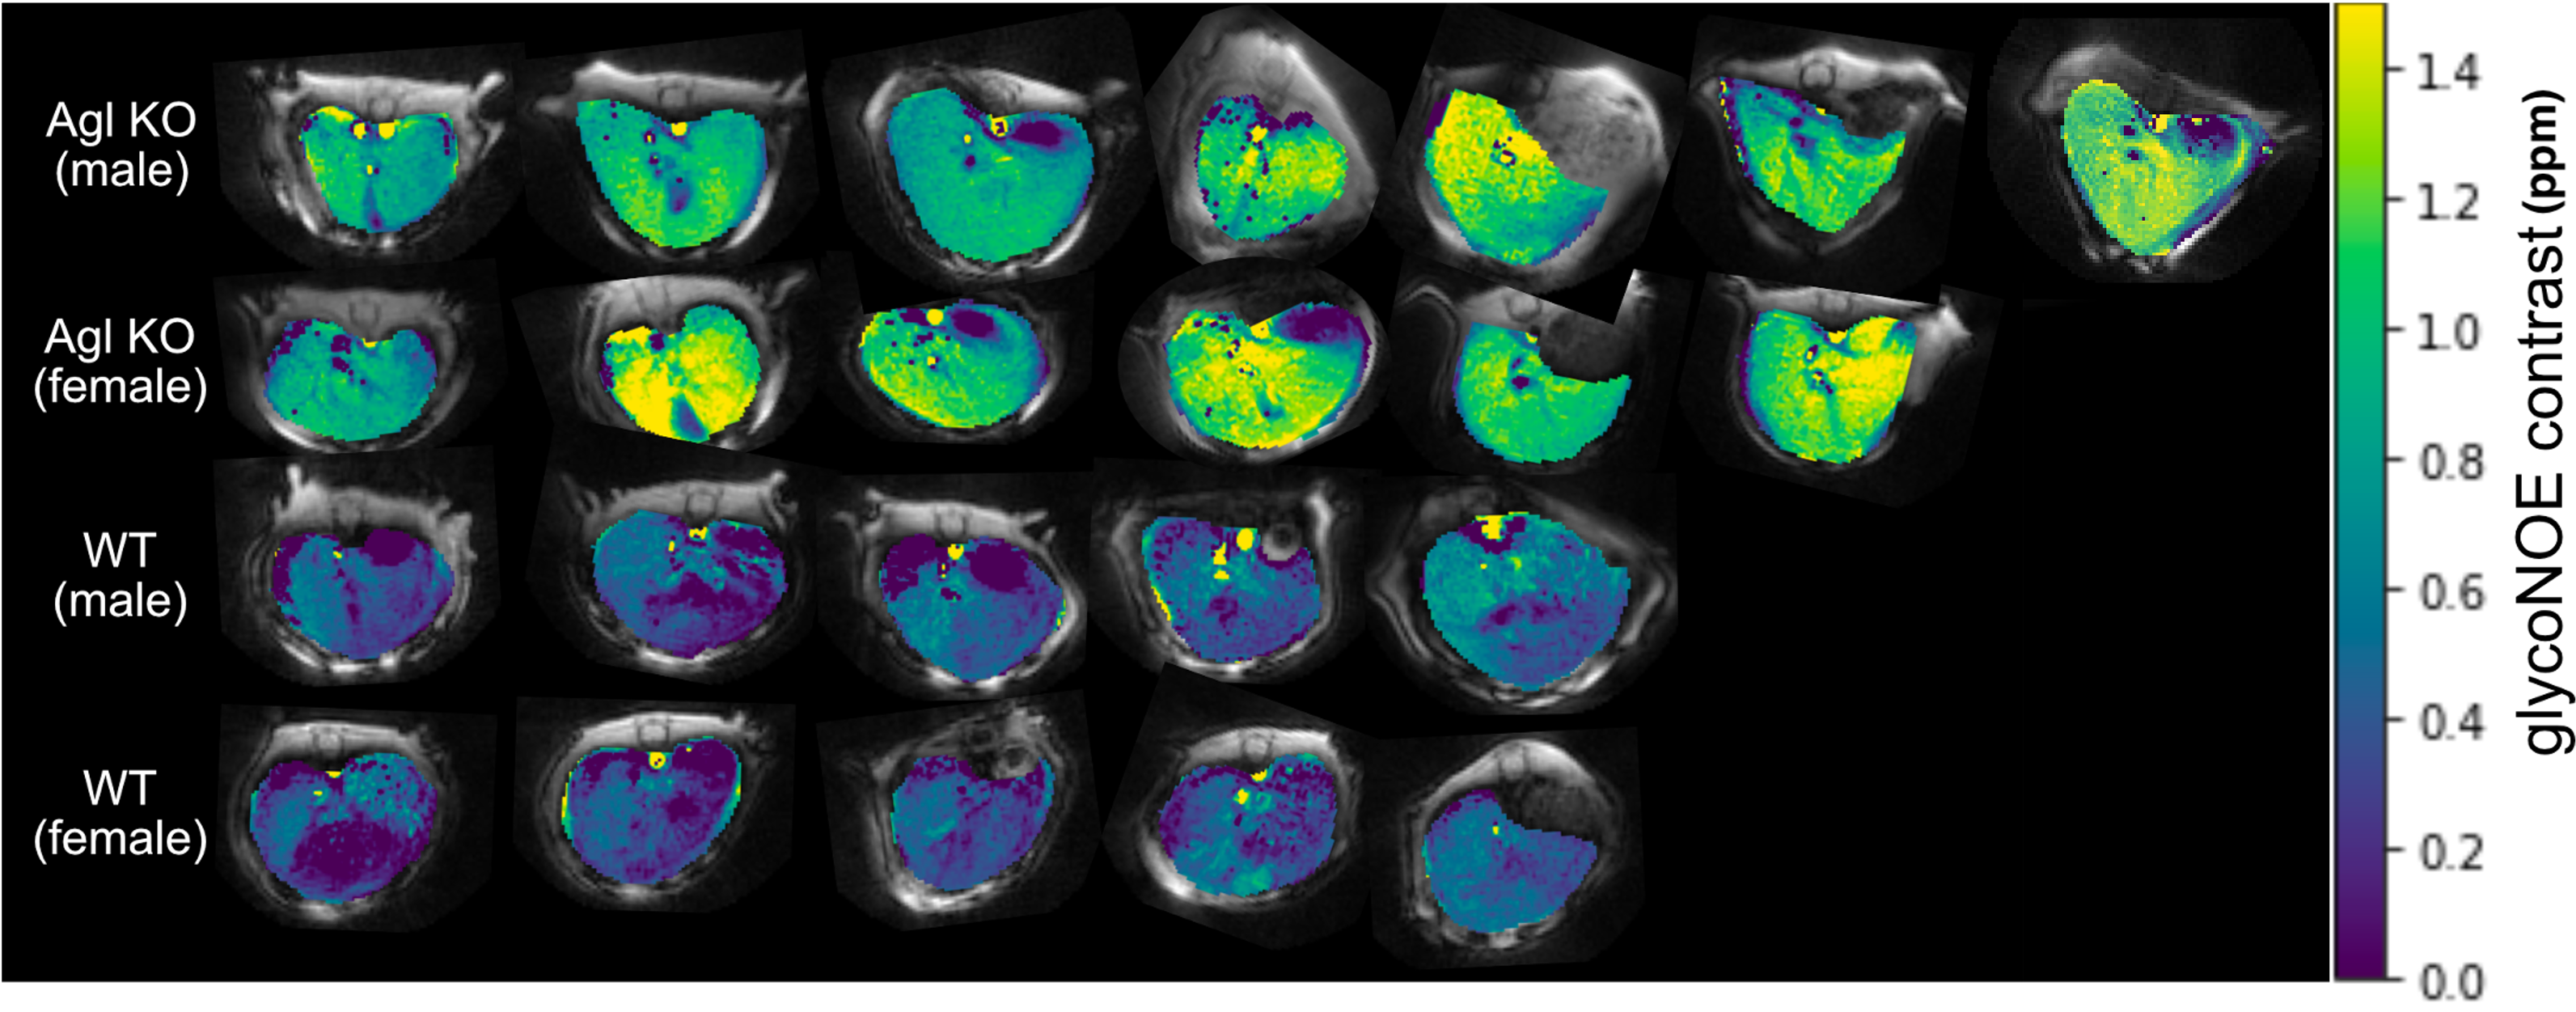
Fig. 1A shows the in vivo Z spectra for typical Agl KO and WT mouse livers. There is an obvious glycoNOE peak at around -1 ppm for Agl KO mouse. The glycoNOE signal difference is statistically significant across genotypes (p = 0.0415), but not between sexes (Fig. 1B). There is a linear correlation between glycoNOE signal and glycogen concentration (Fig. 1C), suggesting that the glycoNOE signal can be used to estimate tissue glycogen levels in vivo.By fitting on a voxel-by-voxel basis, glycoNOE maps can be obtained, as shown in Fig. 2. From the glycoNOE maps, we also see higher glycogen levels in Agl KO mouse livers compared to WT mouse livers. The maps also show heterogeneous distribution of glycogen levels in liver. In addition, there is no significant difference in glycogen levels between the sexes.
Discussion
This study shows the possibility of characterizing GSDs using the glycoNOE MRI method. GlycoNOE differentiated Agl-KO mice from WT controls using glycogen levels in the liver and there was a linear correlation between glycoNOE signal and glycogen concentration determined using a biochemical assay. Note, the glycoNOE signal does not go to zero due to the quantification approach which integrates the residual spectrum which contains other signal components (e.g., proteins, lipids). Still, this baseline shift and linear correlation of glycoNOE contrast with glycogen concentration (see in Fig. 1C) can be used to calibrate the glycoNOE signal.Conclusion
GlycoNOE MRI was demonstrated to detect glycogen levels in a mouse model of GSD III. We hypothesize that this technique can be useful for determining disease load and possible treatment efficacy in GSD III and other GSDs.Acknowledgements
No acknowledgement found.References
(1) Hijazi, G.; Paschall, A.; Young, S. P.; Smith, B.; Case, L. E.; Boggs, T.; Amarasekara, S.; Austin, S. L.; Pendyal, S.; El-Gharbawy, A.; et al. Molecular Genetics and Metabolism Reports 2021, 29, 100821.
(2) Sentner, C. P.; Hoogeveen, I. J.; Weinstein, D. A.; Santer, R.; Murphy, E.; McKiernan, P. J.; Steuerwald, U.; Beauchamp, N. J.; Taybert, J.; Laforêt, P.; et al. Journal of Inherited Metabolic Disease 2016, 39 (5), 697-704.
(3) Zhou, Y.; van Zijl, P. C. M.; Xu, X.; Xu, J.; Li, Y.; Chen, L.; Yadav, N. N. Proceedings of the National Academy of Sciences 2020, 117 (6), 3144-3149.
(4) Liu, K.-M.; Wu, J.-Y.; Chen, Y.-T. Molecular Genetics and Metabolism 2014, 111 (4), 467-476.
(5) Chen, L.; Wei, Z.; Chan, K. W. Y.; Cai, S.; Liu, G.; Lu, H.; Wong, P. C.; van Zijl, P. C. M.; Li, T.; Xu, J. NeuroImage 2019, 188, 380-390.
Figures