2975
MRI Based Differential Analysis of Levator Ani Hiatus Area in Healthy Women at Different Ages :A Retrospective Study1Department of Radiology, Qilu Hospital of Shandong University, Jinan, China, 2Department of Radiology, The Second Affiliated Hospital of Shandong University of Traditional Chinese Medicine, Jinan, China, 3MR Research, GE Healthcare, Beijing, China
Synopsis
Keywords: Pelvis, Normal development
This study aimed to investigate the correlation between hiatus area and age in healthy women. 552 female subjects, divided into four groups (young, young-middle, middle, middle-elderly) based on age, were selected to underwent pelvic T2-weighted MRI for measuring hiatus area. Age showed a positive correlation with hiatus area. Also, statistically significant difference in hiatus areas was found between any two groups, except for between young-middle and middle group, and between middle and middle-elderly group. We thus proved that hiatus area of healthy women increases with age, which might serve as a reference standard in clinic.Background or Purpose
In clinic, the measurement of levator ani hiatus area (hiatus area) is an important factor in evaluating the dysfunction of female pelvic floor1. Patients with diseases such as uterine, rectal prolapse and cystocele tend to increase the hiatus area2.Translabial ultrasound is one of the most used methods for hiatus area measurement in the diagnosis of pelvic floor dysfunction3,4. However, this method is largely dependent on the operation and less repetitive5, limiting its further application in clinic. As an alternative, MRI can provide image with high resolution and fine tissue contrast. T2-weighted MRI (T2WI) has been reported to clearly show the outline of pelvic organs, peritoneal fat and levator anus muscle6. With this advantage, we assumed that T2WI MRI might also hold potential in quantitative analysis of the hiatus area of women. Previous studies1, 2 have shown that female population and age increase are important risk factors for pelvic floor dysfunction. However, further work regarding the measurement of hiatus area in healthy women at different ages is still not explored.
Therefore, in this study, the main goal was to investigate whether hiatus area was changed for women with different ages with a large sample size employed.
Methods
SubjectsThe process of case inclusion and age grouping was shown in Figure 1. All female participants were grouped with age interval at every ten years7.
MRI Acquisition
All subjects were performed at GE HDX TWINSP 3T MR in a supine position using an 8-channel external phased array body coil placed in the center of the lower pelvis. No special preparation was required for subjects. All subjects received 2D high-resolution fast-spin-echo based pelvic T2WI examination in axial view. The scan parameters were of TR = 8390ms, TE = 112ms, matrix =512×512, FOV = 200mm×200mm, slice thickness = 3~5mm, spacing = 0.8mm. The total scan time was 15 mins. Image analysis The corresponding T2WI images of female subjects were imported into IMPAX Volume Viewing 3D Viewing for analysis. Two well-trained radiologists (AA, 8 years of seniority; BB, 1 years of seniority) were employed independently to delineate and calculate the hiatus area. In the axial T2WI image, a closed curve was manually drawn along the medial border of the pubis and the medial border of the levator ani muscle. The corresponding area measured was the minimum hiatus area (Figure 2).
Data Analysis
GraphPad Prism software was used for all statistical analyses. The intra-class correlation coefficient (ICC) was used to evaluate the inter-observer agreement of the data measured by two radiologists. ICC>0.75 means high consistency. All volunteers were tested for normality (Kolmogorov-Smirnov test) and homogeneity of variances for age and hiatus area. Pearson correlation analysis was used to analyze the correlation between age and hiatus area with normal distribution and homogeneous variance. Otherwise, Spearman correlation analysis was used. ANOVA followed by post-hoc analysis was used to assess the differences of hiatus area with normal distribution and homogenous variance in healthy subjects among four age groups. Otherwise, rank sum test was applied. P<0.05 was considered statistical significance.
Results
Excellent interobserver agreement over two radiologists was confirmed by obtained high ICC value of 0.979.The age of all subjects conformed to a normal distribution with homogeneous variance, and the hiatus area did not conform to a normal distribution. So, Spearman analysis was applied and showed that age was positively correlated with the hiatus area (Figure 3, r = 0.29; p < 0.001).
The hiatus areas of female subjects at different ages were: Group A (young, 13.74±3.48 cm2); Group B (young-middle, 15.52±2.21 cm2); Group C (middle, 16.03±2.16 cm2), and Group D (middle-elderly, 16.40±2.10 cm2). As shown in Table 1 and Figure 4, with the rank sum test, statistically significant difference in hiatus areas was found between any two groups (all p < 0.001), except for between young-middle aged and middle aged group (p = 0.3598), and between middle aged and middle aged-elderly group (p=0.0856).
Conclusions
This study investigated whether hiatus area has changed for women with different ages in a large sample size. Our findings showed that subject age was positively correlated with hiatus area. Moreover, statistically significant differences in hiatus areas were found among four groups with different ages. The reasons for these results may include: (1) Rapid growth of the pelvic floor muscles and organs in young women, which increases hiatus area; (2) It decreases the function of pelvic floor supporting structure and occurs muscle atrophy that hormone level of postmenopausal women decreases., and thus increases the hiatus area relatively.In conclusion, our study demonstrated that for healthy women, the hiatus area increases with age. In addition, statistical differences were found in the hiatus area among four age groups in women. Understanding normal reference and changes in age-related of hiatus area are helpful for the accurate diagnosis of pelvic floor dysfunction.
| Dunn's multiple comparison test | A vs. B | A vs. C | A vs. D | B vs. C | B vs. D | C vs. D |
| Mean rank difference | -83.33 | -118.7 | -162.5 | -35.38 | -79.15 | -43.77 |
| Adjusted p value | 0.0012 | <0.0001 | <0.0001 | 0.3598 | <0.0001 | 0.0856 |
Note: A/B/C/D, youth/young-middle/middle/middle-elderly.
Acknowledgements
XH was grateful to his mother Yu Lin and girlfriend Xiuxiu Su for their spiritual encouragement.References
1. Xuan, Y.; Friedman, T.; Dietz, H. P., Does levator ani hiatal area configuration affect pelvic organ prolapse? Ultrasound in obstetrics & gynecology : the official journal of the International Society of Ultrasound in Obstetrics and Gynecology 2019, 54 (1), 124-127.
2. Nandikanti, L.; Sammarco, A. G.; Kobernik, E. K.; DeLancey, J. O. L., Levator ani defect severity and its association with enlarged hiatus size, levator bowl depth, and prolapse size. American journal of obstetrics and gynecology 2018, 218 (5), 537-539.
3. Speksnijder, L.; Oom, D. M.; Koning, A. H.; Biesmeijer, C. S.; Steegers, E. A.; Steensma, A. B., Agreement and reliability of pelvic floor measurements during rest and on maximum Valsalva maneuver using three-dimensional translabial ultrasound and virtual reality imaging. Ultrasound in obstetrics & gynecology : the official journal of the International Society of Ultrasound in Obstetrics and Gynecology 2016, 48 (2), 243-9.
4. Dou, C.; Li, Q.; Ying, T.; Yan, Y.; Wang, X.; Hu, B., Determining "abnormal" levator hiatus distensibility using three-dimensional transperineal ultrasound in Chinese women. Frontiers of medicine 2018, 12 (5), 572-579.
5. Iacobellis, F.; Reginelli, A.; Berritto, D.; Gagliardi, G.; Laporta, A.; Brillantino, A.; Renzi, A.; Scaglione, M.; Masselli, G.; Barile, A.; Romano, L.; Cappabianca, S.; Grassi, R., Pelvic floor dysfunctions: how to image patients? Japanese journal of radiology 2020, 38 (1), 47-63.
6. Alt, C. D.; Hampel, F.; Hallscheidt, P.; Sohn, C.; Schlehe, B.; Brocker, K. A., 3 T MRI-based measurements for the integrity of the female pelvic floor in 25 healthy nulliparous women. Neurourology and urodynamics 2016, 35 (2), 218-23.
7. Kono, T.; Kusano, T.; Sato, N.; Yoshimoto, S.; Nakamura, S., Natural mastopexy repositioning based on age-related mean breast shape. Asian journal of surgery 2018, 41 (4), 295-300.
Figures
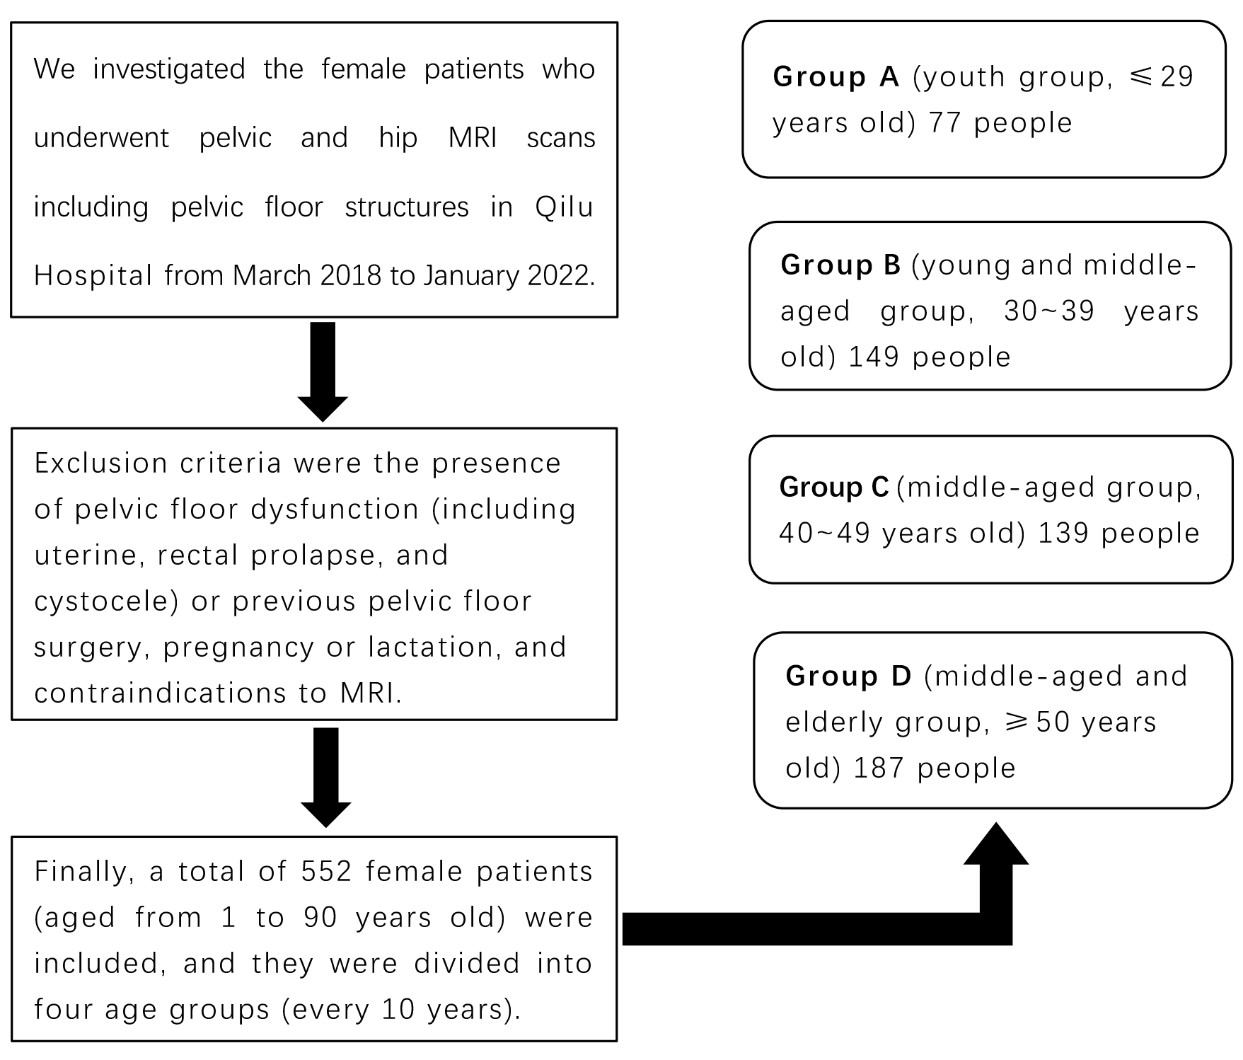
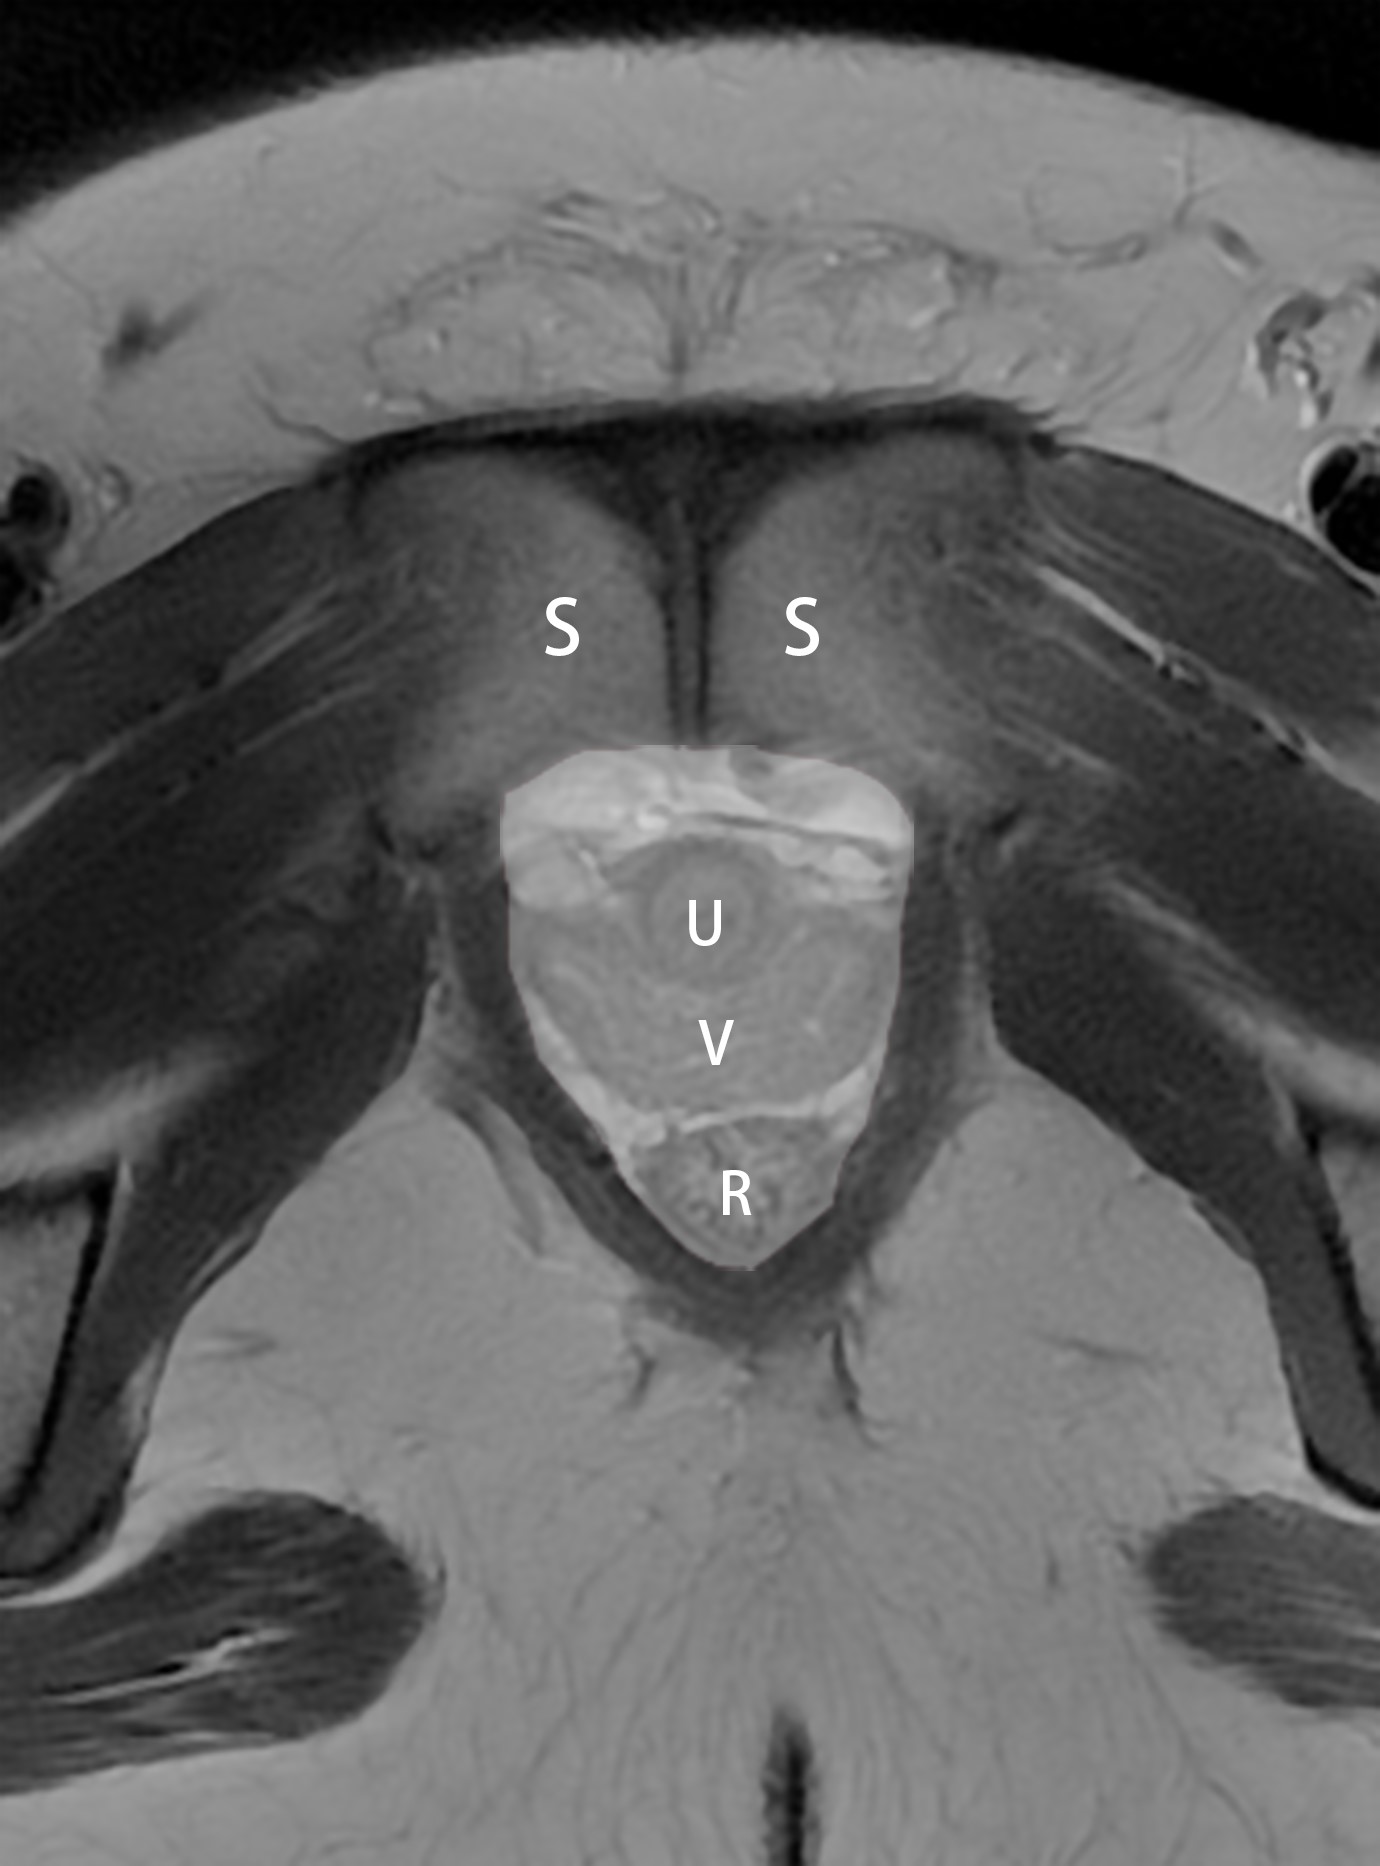
Figure 2. Sketch map of levator ani hiatus area.
Note: In the axial T2WI image with the maximum levator ani hiatus, a closed curve is drawn along the medial border of the pubis and the medial border of the levator ani muscle. The area enclosed by the curve (white area) is the area of the levator hiatus. S: pubic symphysis; U: urethra; V: vagina; R: rectum.
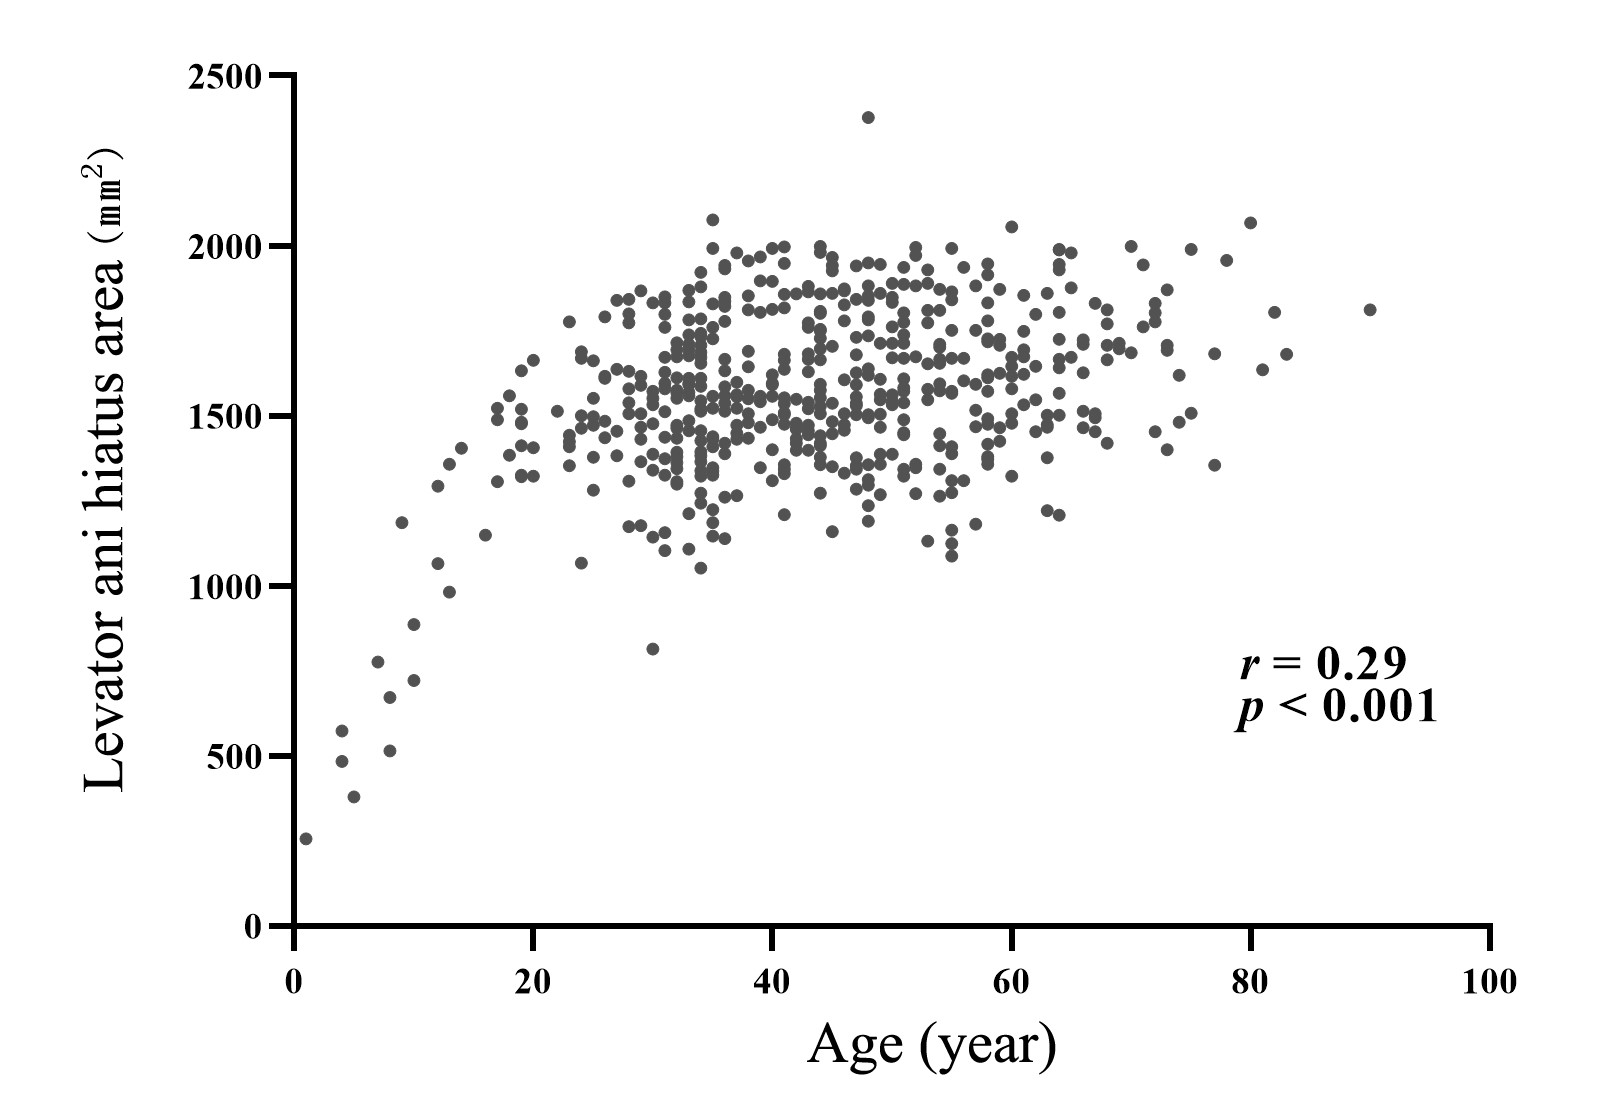
Figure 3. Correlation analysis between age and levator ani hiatus area in healthy women (scatter plot).
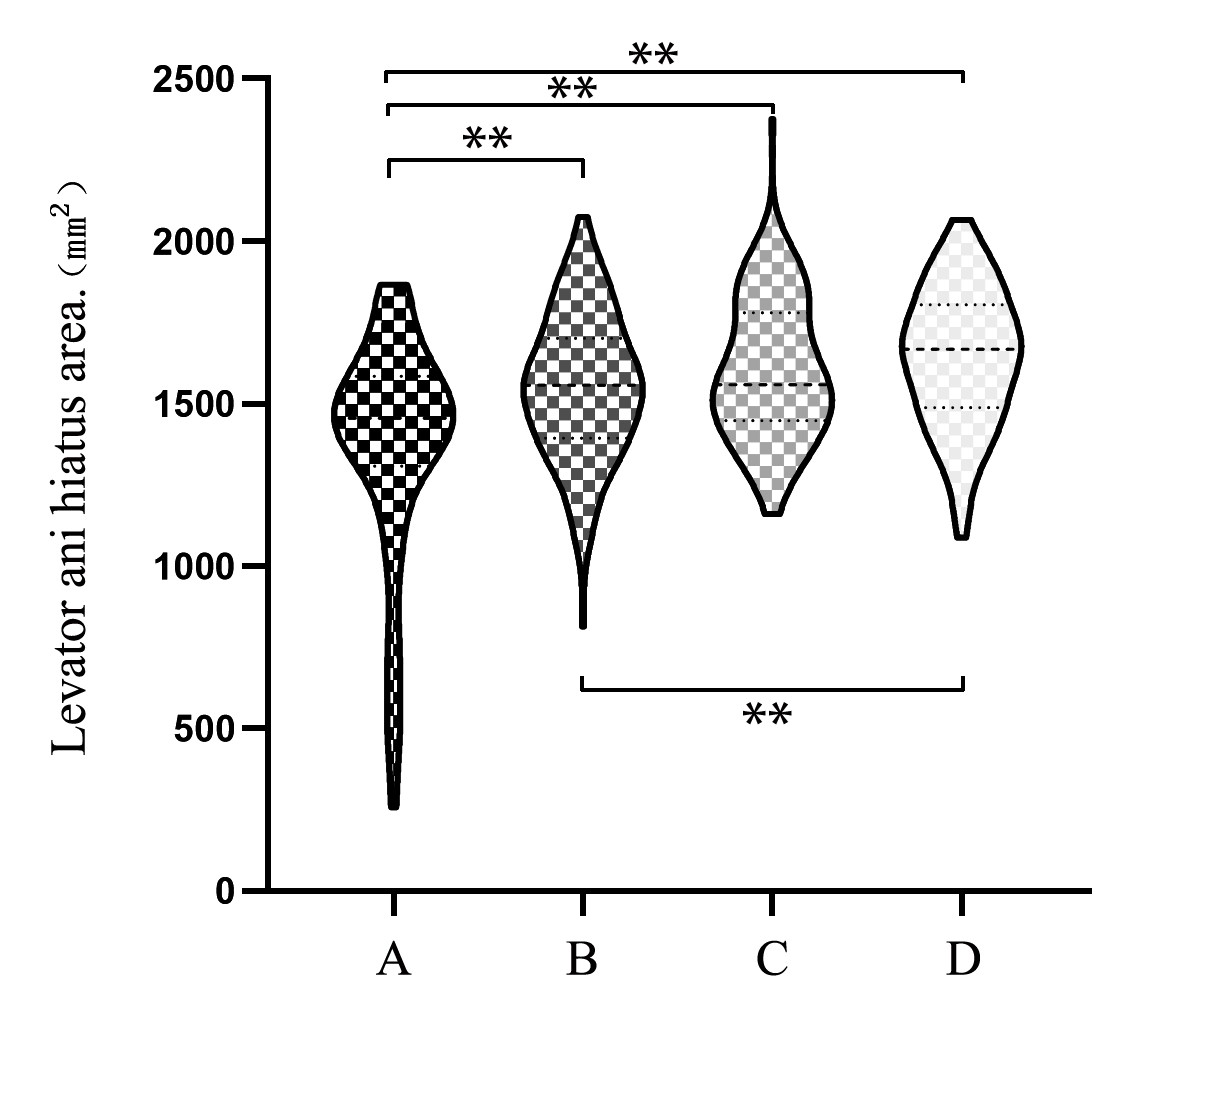
Figure 4. Comparison of levator ani hiatus areas among four age groups (violin diagram).
Note: The width of each violin plot represents the concentration of the sample distribution on the vertical axis, the two endpoints of each violin plot represent the maximum and minimum values, the thick dashed line represents the median, and the thin dashed line represents the quartile.
A, youth group; B, young-middle group; C, middle group; D, middle-elderly group. **: P < 0.001.