2958
Predicting the Risk of Non-Saccular Aneurysms Based on the Dynamic Contrast-Enhanced Magnetic Resonance Imaging1Center for Biomedical Imaging Research, Tsinghua University, Beijing, China, 2Department of Neurosurgery, Beijing Tiantan Hospital, Beijing Neurosurgical Institute, Capital Medical University, Beijing, China
Synopsis
Keywords: Data Analysis, DSC & DCE Perfusion
Assessment of intracranial aneurysm rupture risk is clinically critical. Recent studies have shown that the aneurysm wall permeability (Ktrans) and wall enhancement index are independent risk factors for predicting saccular aneurysm rupture. However, this conclusion has not been confirmed in non-saccular aneurysms. Our study suggested that Ktrans was significantly associated with the aneurysm size and PHASES score in non-saccular aneurysms. But Ktrans did not associate with the wall enhancement index in non-saccular aneurysms. Therefore, Ktrans can provide an independent quantitative indicator for assessing the risk of rupture of in non-saccular intracranialaneurysms.
Introduction
Intracranial aneurysm is a common vascular disease affecting approximately 3.2% of the population.1 Aneurysmal subarachnoid hemorrhage has a mortality of approximate 50%, with survivors incurring a tremendous personal and financial burden due to permanent disabilities.2 Although prophylactic treatment of surgical intervention can effectively prevent aneurysm rupture, patients also need to bear the risks and complications of surgery. Therefore, an effective assessment of aneurysm rupture risk is crucial. At present, aneurysm diameter and the Population, Hypertension, Age, Size, Earlier Subarachnoid Hemorrhage, and Site (PHASES) score3 are often used to assess the risk of aneurysm rupture in clinical practice. Recent studies have found that the enhancement of the aneurysm wall was an effective risk factor for predicting aneurysm rupture.4,5 Vakil et al. performed DCE-MR imaging in patients and found that high-risk aneurysms had higher aneurysm wall permeability (Ktrans), suggesting that Ktrans was an important predictor of aneurysm rupture.6 Qi, H., et al. showed the aneurysm wall permeability and aneurysm wall enhancement was risk factors for predicting saccular aneurysm rupture.7 However, this conclusion has not been confirmed in non-saccular aneurysms. This study aimed to investigate the relationship between aneurysm wall permeability by DCE-MR imaging and wall enhancement index by vessel wall MR imaging, and then to evaluate the role of DCE-MR imaging in predicting the risk of non-saccular intracranial aneurysms rupture.Methods
Subjects: This study was approved by the Ethics Committee of Tsinghua University, and all patients signed informed consent. Non-saccular aneurysm patients diagnosed by CTA, DSA or MRA were included in this study. Exclusion criteria were (1) pregnant or breastfeeding women; (2) any contraindications to MRI, such as claustrophobia, metal implants, allergy to gadolinium contrast agents, etc. We collected the demography and clinical risk factors such as hypertension, diabetes, hyperlipidemia, smoking history, and drinking history.Imaging Protocol: Pharmacokinetic modeling and analysis of DCE-MR imaging were carried out using the extended Kety/Tofts model8. The pharmacokinetic parameters Ktrans, Vp and Ve were obtained by fitting pixel by pixel in the region of interest on the DCE-MR imaging using the nonlinear least squares method (Figure 1). The layer demonstrating the largest Ktrans value was selected, then the outer wall of the aneurysm was manually delineated as ROI1. ROI2 was generated by expanding ROI1 by 3 pixels. The mean Ktrans for the non-saccular aneurysm was calculated within the annular region between ROI1 and ROI2. Without knowledge of other patient information, experienced doctors compared the pre- and postcontrast 3D black blood T1-weighted VISTA images to qualitatively determine whether the aneurysm wall was enhanced.9 To quantitatively describe the degree of enhancement, we introduced the wall enhancement index (WEI)10. We processed 3D black blood T1-weighted VISTA images before and after contrast enhancement to match the slices with the highest Ktrans values in the DCE-MR imaging analysis. Next, the aneurysm wall was manually delineated and the mean WEI of the aneurysm wall was calculated.
Statistical Analysis: Categorical variables were expressed as counts (percentages). Stage scores were summarized as medians (interquartile range, [IQR]). The Kolmogorov-Smirnov test was used to test the existence of normal distribution for each continuous variable, and then the variables were expressed as mean±SD or median (IQR). Spearman correlation analysis was used to evaluate the correlation between Ktrans and WEI, and the relationship between Ktrans and WEI with aneurysm size and PHASES score. All statistical analyses were performed two-tailed with SPSS (IBM, Armonk, New York). P<0.05 was defined as statistically significant.
Results
Ten patients with aneurysms were included in the study. Table 1 shows the clinical information of the patients. High aneurysm wall permeability was demonstrated in the two cases, but their degree of aneurysm wall enhancement (AWE) showed marked differences (Figure 2). Spearman correlation analysis showed that Ktrans correlated with IA size (ρ = 0.806, P = .005) and PHASES score (ρ = 0.697, P = .025). Ktrans was not significantly associated with WEI (P = .603) and other clinical and imaging features (Figure 3).Discussion and Conclusion
High intracranial aneurysm wall permeability was significantly correlated with aneurysm size and PHASES score. However, Ktrans and WEI were not well correlated, and they could reflect two different pathophysiological states. Ktrans could provide a new independent quantitative indicator for assessing the risk of rupture of non-saccular intracranial aneurysms. More patients with non-saccular intracranialaneurysms are expected to include in this study to further confirm the independent value of aneurysm wall permeability in predicting the risk of rupture of non-saccular intracranialaneurysms. With the application of quantitative magnetic resonance imaging technology represented by DCE-MR imaging, the combined application of multimodal imaging and clinical risk factors for the comprehensive evaluation of non-saccular intracranial aneurysms will become a potential solution for predicting clinical outcomes of non-saccular intracranial aneurysms.Acknowledgements
None.References
1. Vlak, Monique HM, et al. "Prevalence of unruptured intracranial aneurysms, with emphasis on sex, age, comorbidity, country, and time period: a systematic review and meta-analysis." The Lancet Neurology 10.7 (2011): 626-636.
2. Vakil, P., et al. "Quantifying intracranial aneurysm wall permeability for risk assessment using dynamic contrast-enhanced MRI: a pilot study." American Journal of Neuroradiology 36.5 (2015): 953-959.
3. Greving, Jacoba P., et al. "Development of the PHASES score for prediction of risk of rupture of intracranial aneurysms: a pooled analysis of six prospective cohort studies." The Lancet Neurology 13.1 (2014): 59-66.
4. Fu, Qichang, et al. "Qualitative and quantitative wall enhancement on magnetic resonance imaging is associated with symptoms of unruptured intracranial aneurysms." Stroke 52.1 (2021): 213-222.
5. Wang, Guang-xian, et al. "Wall enhancement ratio and partial wall enhancement on MRI associated with the rupture of intracranial aneurysms." Journal of NeuroInterventional Surgery 10.6 (2018): 566-570.
6. Vakil, P., et al. "Quantifying intracranial aneurysm wall permeability for risk assessment using dynamic contrast-enhanced MRI: a pilot study." American Journal of Neuroradiology 36.5 (2015): 953-959.
7. Qi, H., et al. "Complementary roles of dynamic contrast-enhanced MR imaging and postcontrast vessel wall imaging in detecting high-risk intracranial aneurysms." American Journal of Neuroradiology 40.3 (2019): 490-496.
8. Tofts, Paul S., et al. "Estimating kinetic parameters from dynamic contrast‐enhanced T1‐weighted MRI of a diffusable tracer: standardized quantities and symbols." Journal of Magnetic Resonance Imaging: An Official Journal of the International Society for Magnetic Resonance in Medicine 10.3 (1999): 223-232.
9. Liu, Peng, et al. "Relationship between aneurysm wall enhancement and conventional risk factors in patients with unruptured intracranial aneurysms: a black-blood MRI study." Interventional Neuroradiology 22.5 (2016): 501-505.
10. Omodaka, S., et al. "Quantitative assessment of circumferential enhancement along the wall of cerebral aneurysms using MR imaging." American Journal of Neuroradiology 37.7 (2016): 1262-1266.
Figures
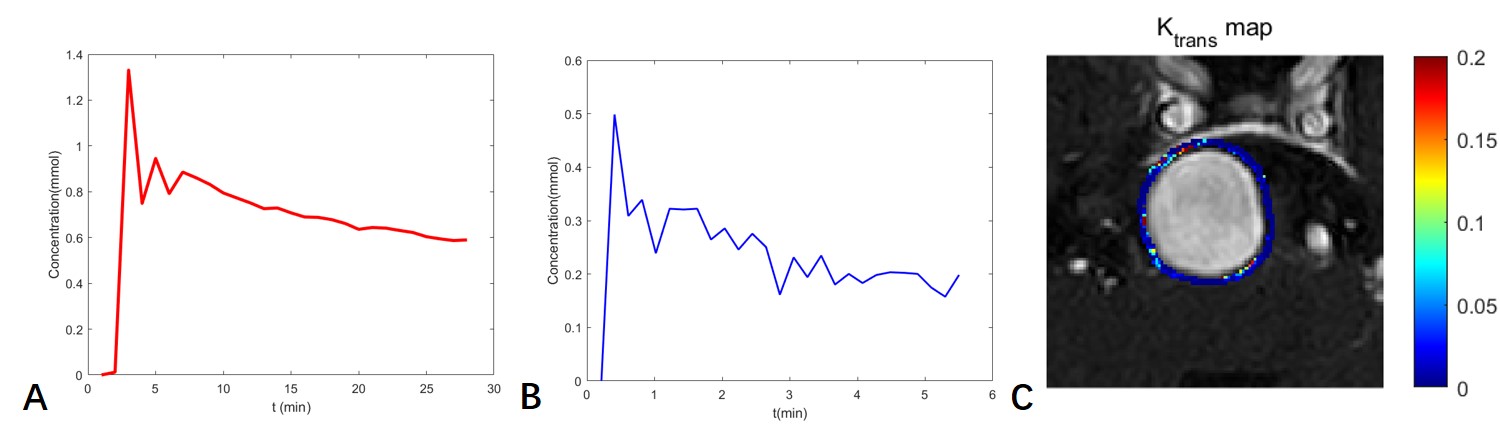
Figure 1. The permeability of the aneurysm wall was measured by DCE-MR imaging. (A)Time-dependent relationship of plasma contrast agent concentration. (B)Contrast agent concentration versus time in the tissue surrounding the aneurysm wall. (C)The outer wall of the aneurysm was manually delineated. Then the region of interest was obtained by expanding outward by 3 pixels. The Ktrans map obtained by fitting the region of interest pixel by pixel.

Table 1. Demographic and clinical information of the sample(N=10). Categoric variables were summarized as count (percentage). The PHASES score was expressed as median (interquartile range, [IQR]). The Kolmogorov-Smirnov test was used to test the existence of normal distribution for each continuous variable, and then the variables were expressed as mean±SD or median (IQR).
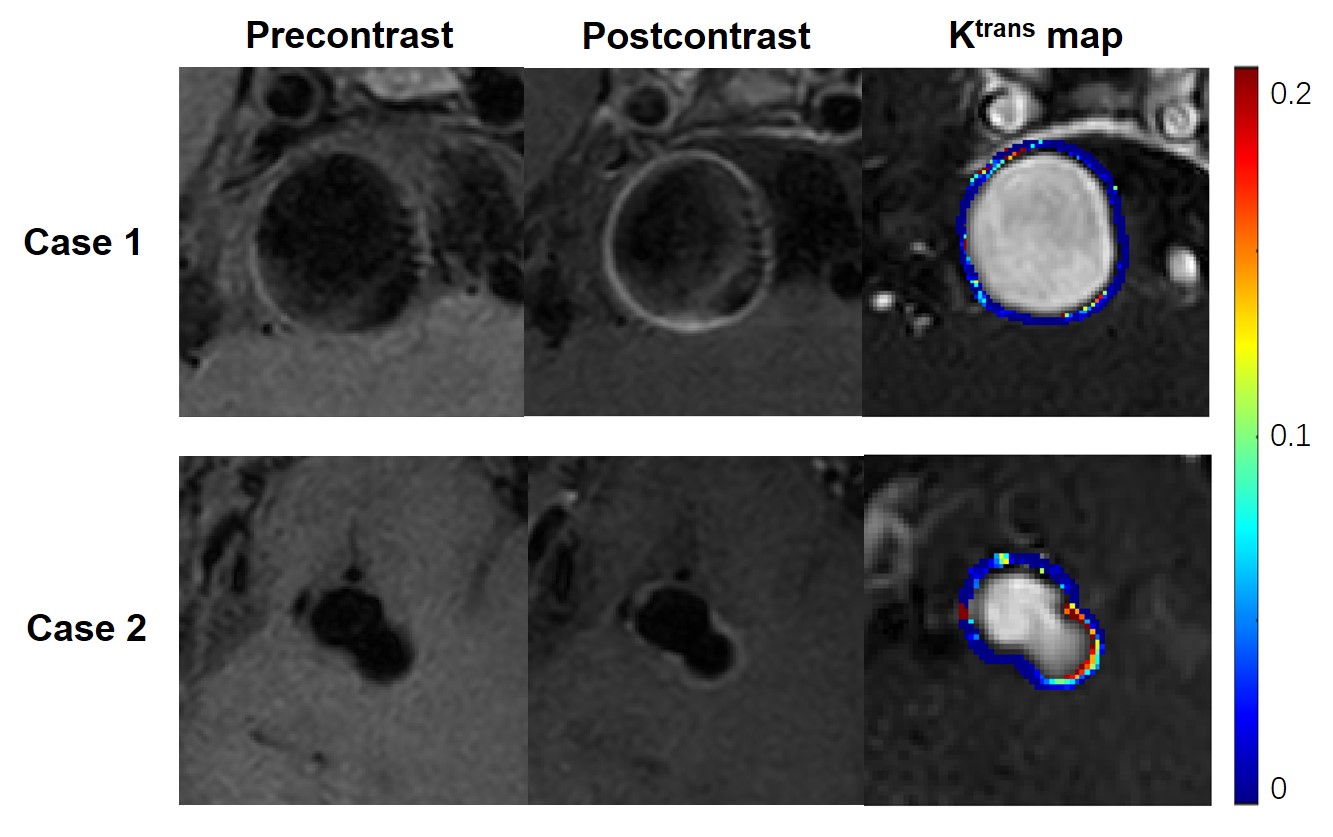
Figure 2. High Ktrans with high or low enhancement of the non-saccular intracranial aneurysm wall. Case 1: A 39-year-old male with 23.8 mm aneurysm. Significant wall enhancement was observed after injection of contrast, and DCE-MR imaging showed high aneurysm wall permeability (Ktrans=0.050min-1). Case 2: 47-year-old male with 11.5 mm aneurysm. There was low aneurysm wall enhancement after injection of contrast, but DCE-MR imaging showed high aneurysm wall permeability (Ktrans=0.132min-1).
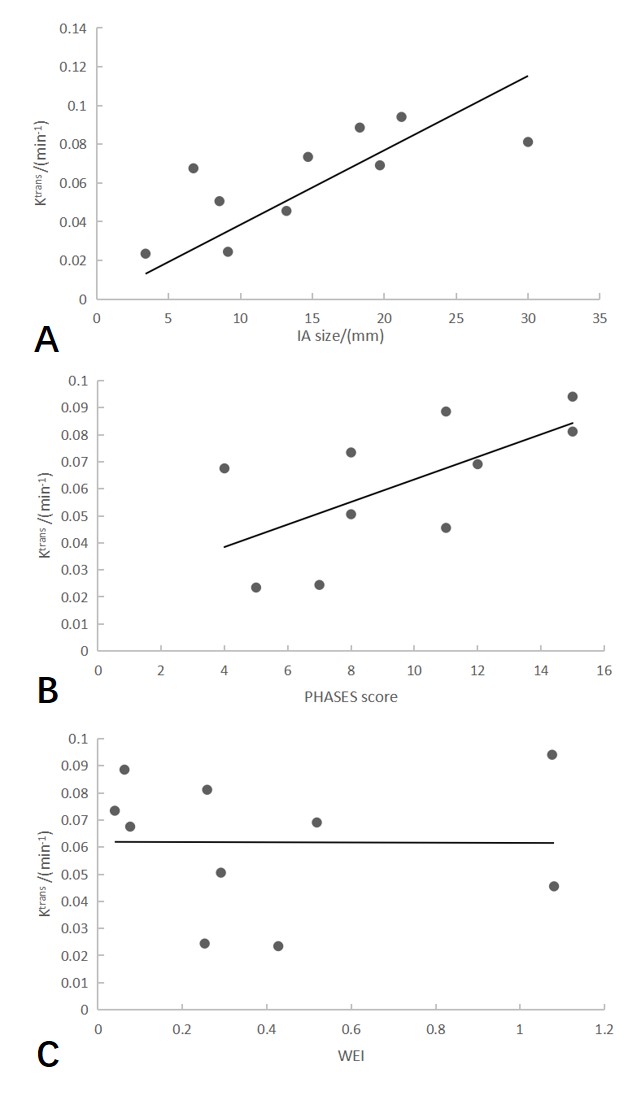
Figure 3. Associations between aneurysm wall permeability and size (A), the PHASES score (B) and the wall enhancement index(C). Spearman correlation analysis showed that Ktrans correlated with IA size (ρ = 0.806, P = .005) and PHASES score (ρ = 0.697, P = .025). Ktrans was not significantly correlated with the wall enhancement index (P = .603).