2949
Manifold Learning and Dimensionality Estimation for the Human Functional Connectome1Section on Functional Imaging Methods, NIMH, Bethesda, MD, United States, 2Machine Learning Team, NIMH, Bethesda, MD, United States, 3FMRI Core Facility, NIMH, Bethesda, MD, United States
Synopsis
Keywords: Machine Learning/Artificial Intelligence, fMRI, Manifold Learning, TSNE, UMAP, Laplacian Eigenmaps, Intrinsic Dimension
The exploration of time-varying aspects of the human functional connectome (FC) is challenging because the high dimensionality of connectivity matrices precludes direct visual inspection in a meaningful manner. Dimensionality reduction helps circumvent this problem, yet effective application requires a-priori knowledge of the intrinsic dimension of the data and careful selection of algorithmic hyperparameters. Here, we first estimate the intrinsic dimension of FC data. Next, we use data with known cognitive state changes to evaluate the effectiveness of Laplacian Eigenmaps, T-SNE and UMAP to generate informative low dimensional representations of time-varying FC data for explorative and predictive purposes.
Introduction
Whole-brain functional connectivity (FC) patterns evolve over time. Yet, our ability to explore their dynamics is severely constrained by the dimensionality of FC data (>10,000). To overcome this difficulty, researchers seek to generate 2D/3D representations that retain its most informative aspects (Fig 1). But should we expect such high dimensional data to be meaningfully summarized with just a few dimensions? To answer this, we estimate the intrinsic dimension (ID) of time-varying FC (tvFC) data, which tell us the minimum number of variables (dimensions) required to describe a non-linear surface (manifold) where the data lies with little loss of information.Furthermore, manifold learning techniques (MLTs) are often benchmarked using everyday images. Image and tvFC data are quite different (i.e., images lack temporal autocorrelation and tend to reside near smooth manifolds). It is unclear how image-based benchmarks will transfer to tvFC data. To address this gap, we evaluate the effectiveness of three top performing MLTs at generating neurobiologically informative embeddings of tvFC data.
Methods
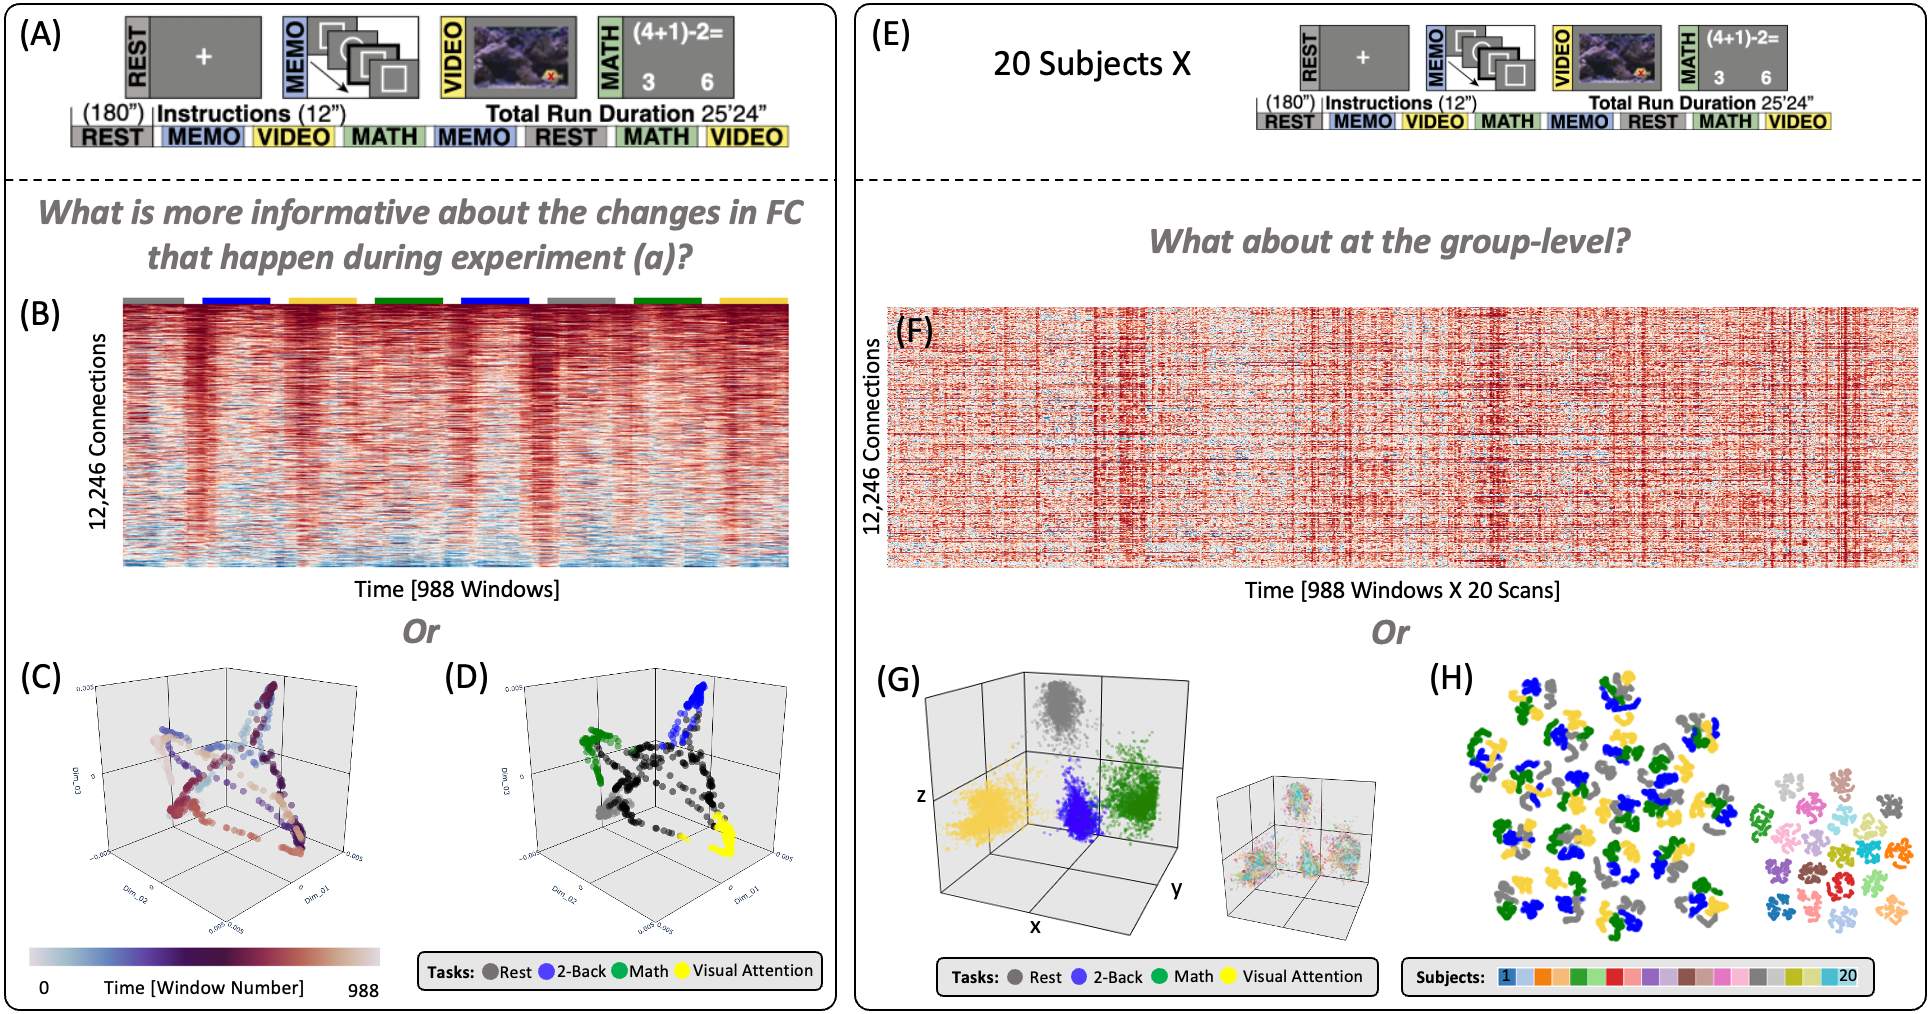
Dataset: 22 subjects scanned continuously for 25mins while performing four tasks: rest, math, 2-back, and visual-attention (7T, TR=1.5s, 2x2x2mm; Fig 1.A). Each task occupied two separate 180-s blocks, preceded by 12s instructions. Additional details here2.Preprocessing: despiking, physiological noise correction, slice-time correction, head-motion correction, nuisance regression (slow trends, WM & ventricular signals, motion and first derivative), bandpass filtering, spatial smoothing.
tvFC: time-series were extracted using the 200ROI Craddock Atlas3. tvFC matrices [12246 connections X 988 temporal windows] (Fig. 1.B) were generated per scans using 45sec rectangular windows with a step of one sample.
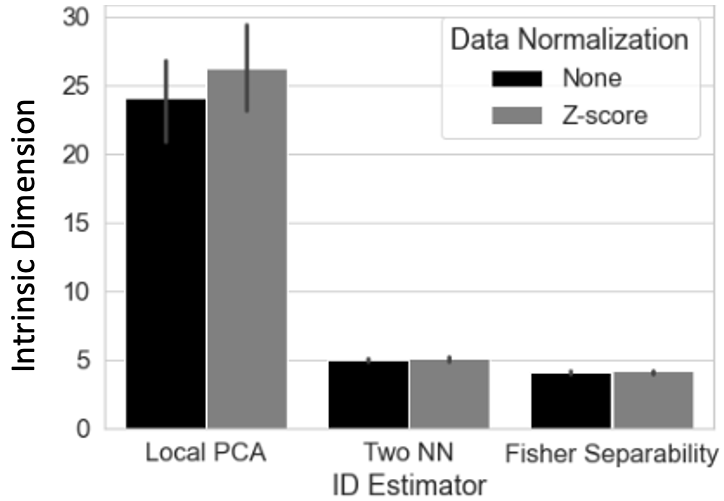
ID Estimation: scan-level ID was estimated with local PCA, two-nearest neighbors4, and Fisher separability5.
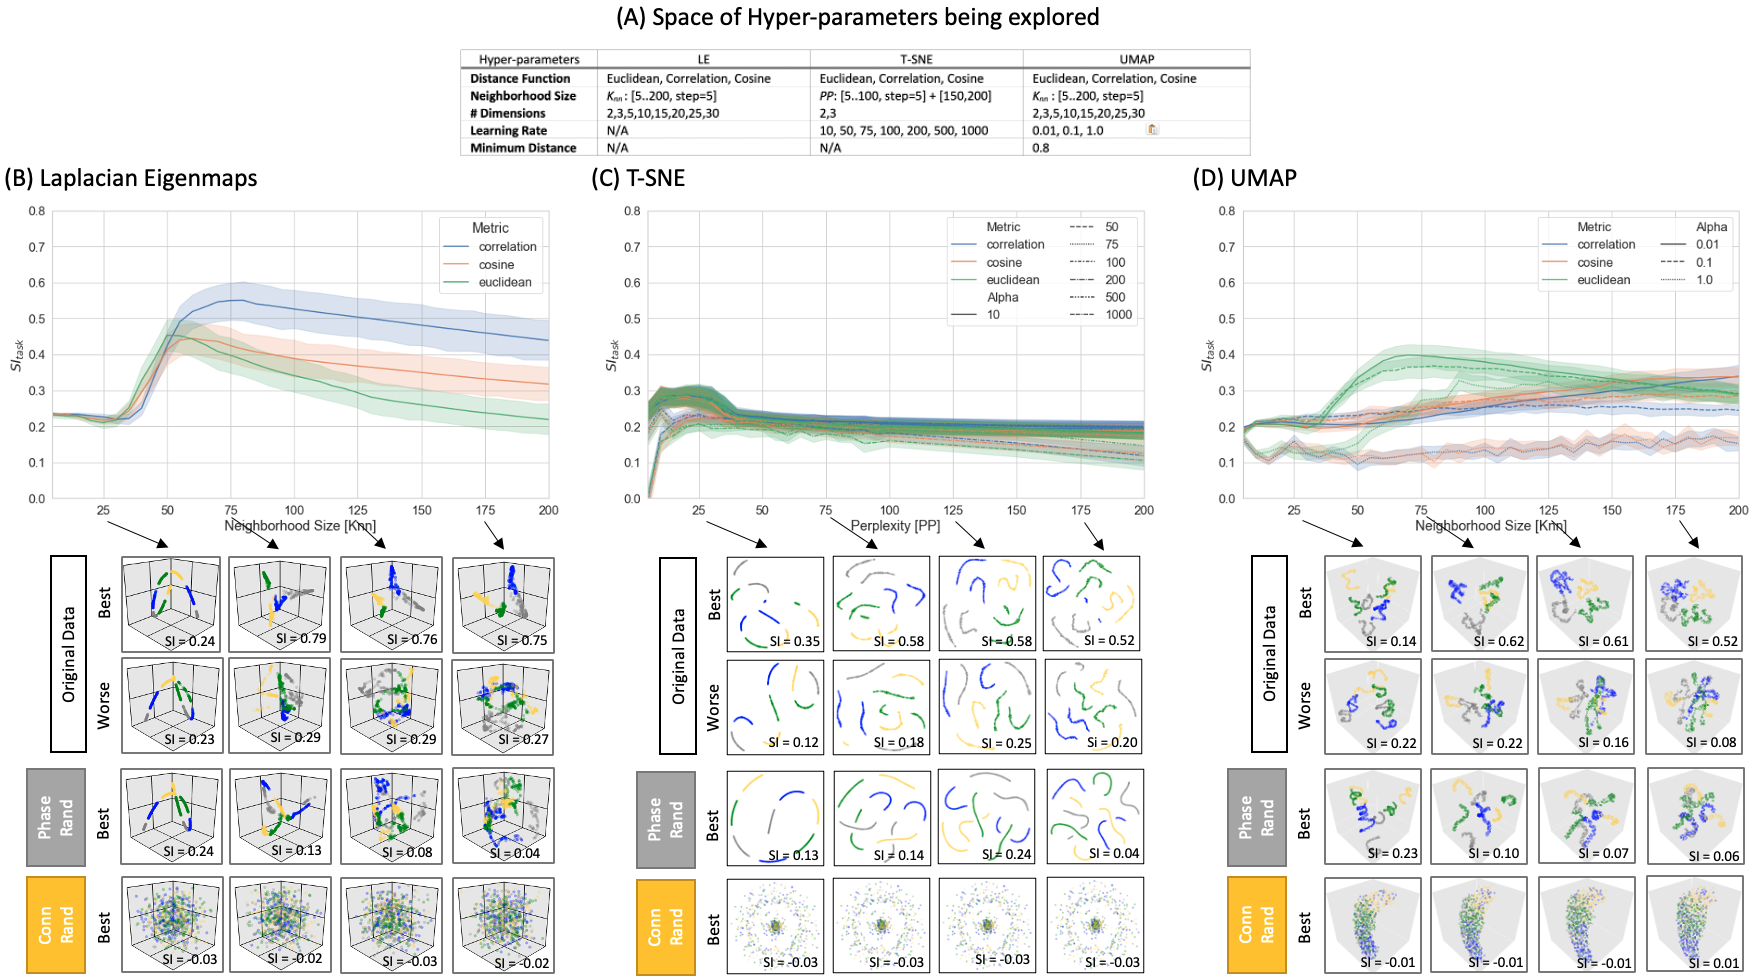
Dim. Reduction: embeddings of tvFC data were generated with Laplacian Eigenmaps (LE)6, T-SNE7, and UMAP1. Fig 3.A shows the hyper-parameter space investigated here.
Group Aggregation: group embeddings generated in two ways: 1) concatenation of scan-level tvFC matrixes followed by MLT; 2) MTL at the scan-level followed by Procrustes transformation8.
Embedding Evaluation: we benchmarked the unsupervised embeddings based on task separability and predictive value. We do so to mimic two common uses of MLTs in neuroscience: exploration of group structure in the data (e.g., FC states, populations) and generation of input features for classification (e.g., biomarker development). We quantify task separability via the silhouette index (SI)9 and predictive value by the accuracy of a logistic regressor classifier at predicting task.
Results
Figure 1 shows high-quality embeddings for scan- (Fig 1.A-D) and group-levels (Fig 1.G-H). At group-level, embeddings can either retain (Fig 1.G | Procrustes) or bypass inter-subject differences (Fig 1.H | Concatenation) depending on aggregation method.Figure 2 shows average ID estimates, which ranged between 3 (Fisher Separability) and 25 (local PCA). Despite differences across methods, tvFC’s ID always remained several orders of magnitude below its original value.
Figure 3.B-D shows SI as a function of neighborhood size and distance. Below these curves, we present embeddings for real data (top two rows) and two null models (bottom two rows). In real data, small neighborhood size (i.e., Knn=25) results in embeddings that only capture temporal autocorrelation, but not the repetitive task structure. Clear task separation (SI > 0.4) is only achieved for a limited set of neighborhood sizes around 75. Distance-wise, Correlation works best for LE and TSNE, and Euclidean does for UMAP. Overall, LE was the best performer. When connections are randomized across windows (second to last row), embeddings lose all meaningful structure. When time series are phase-randomized prior to computing tvFC (bottom row), embeddings reproduce the temporal autocorrelation imposed by the sliding window procedure.
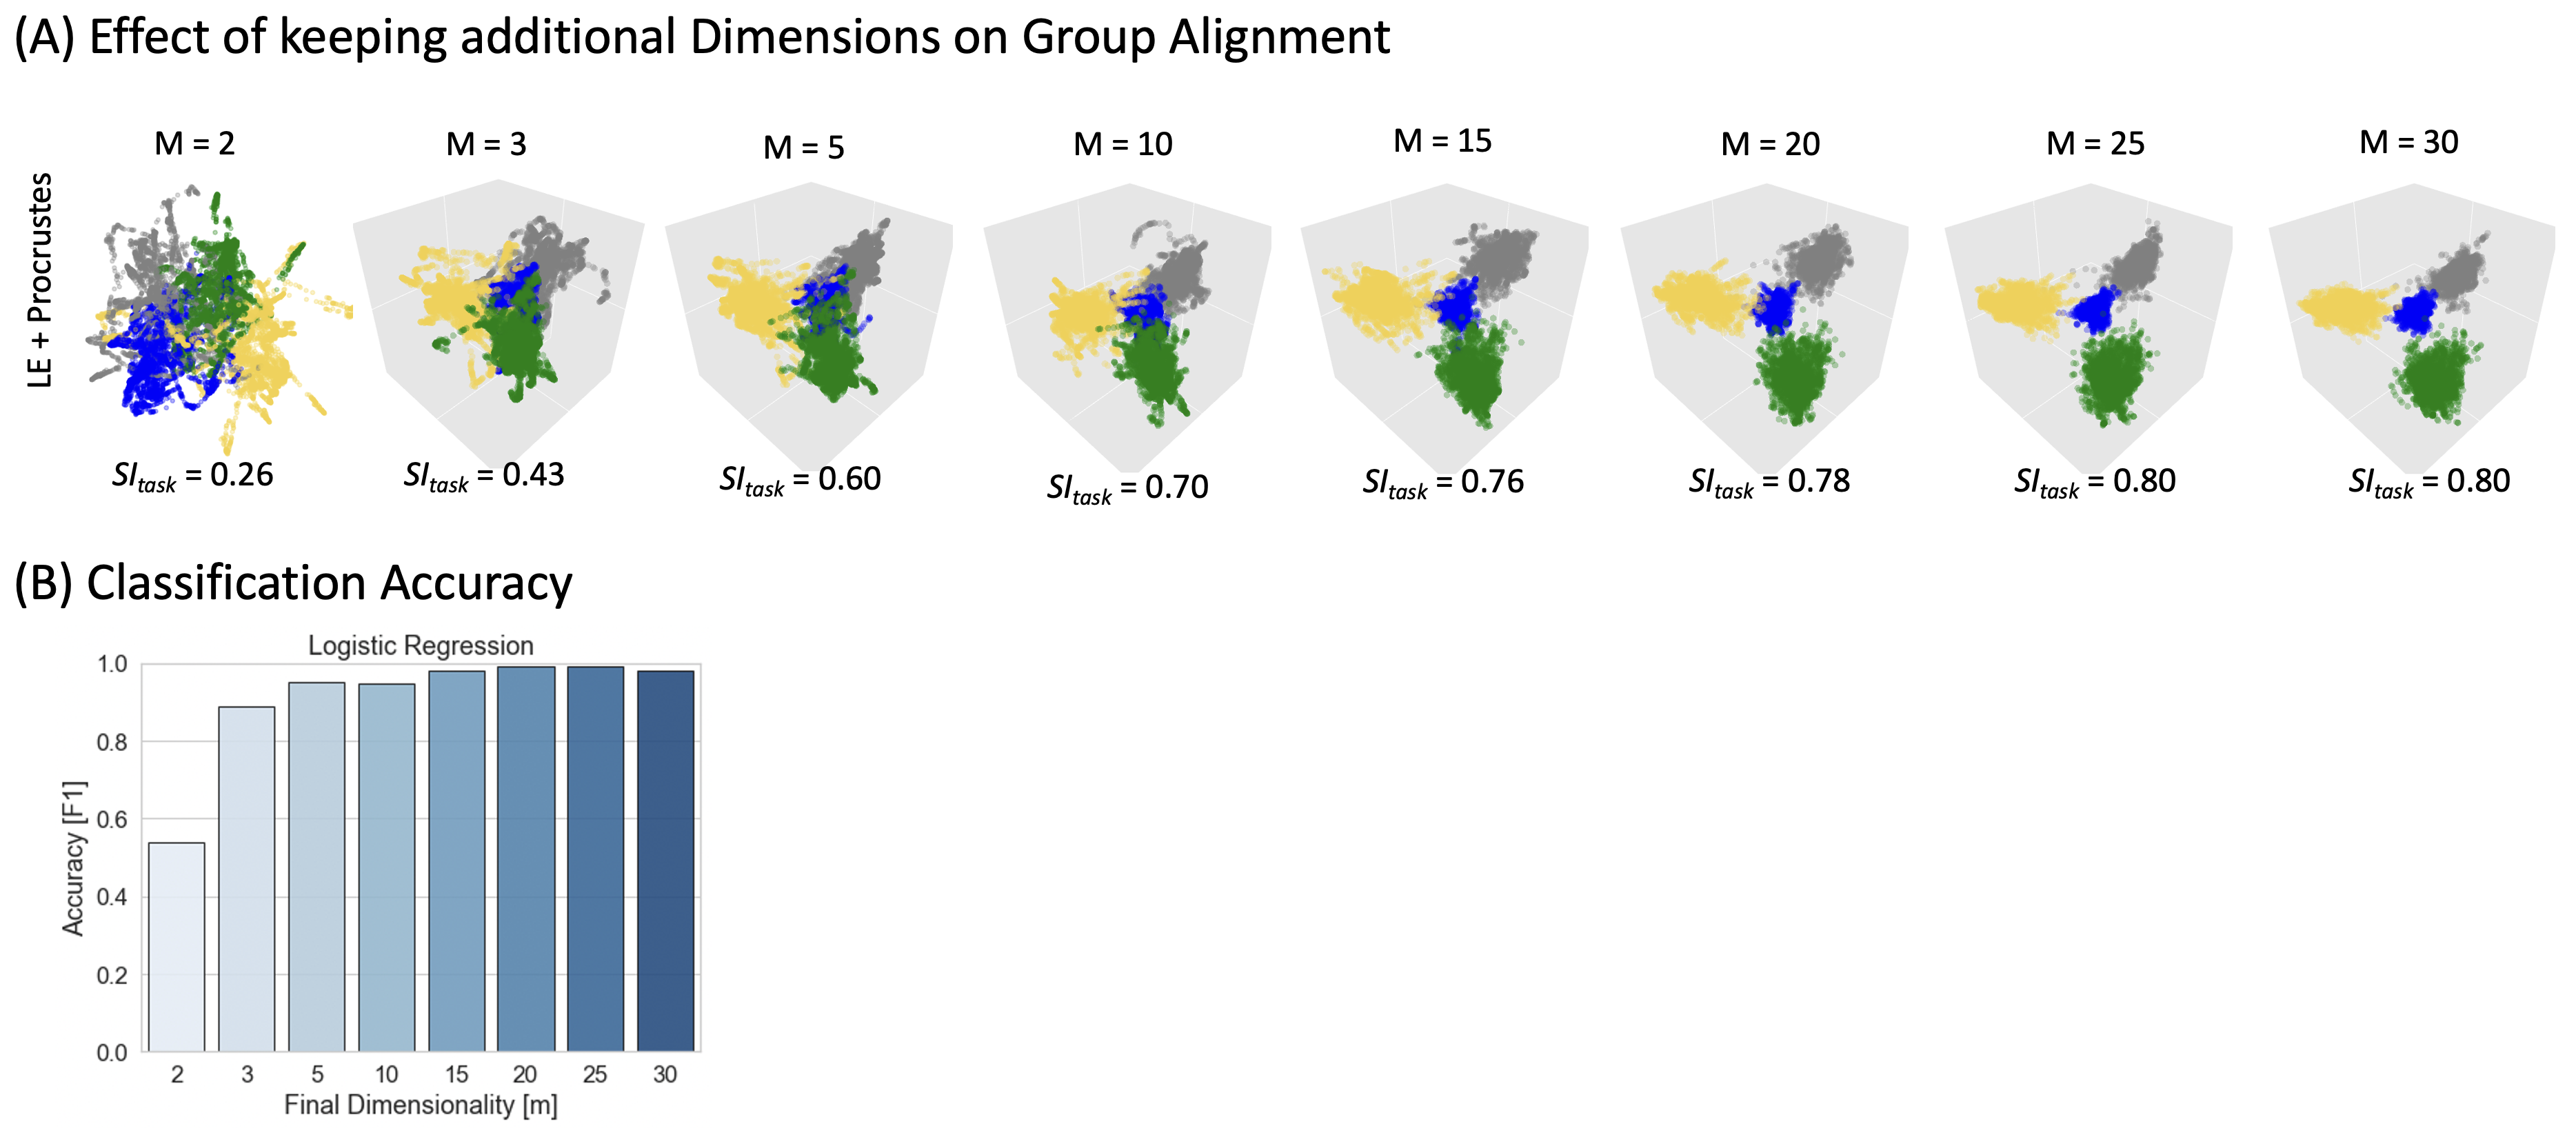
Figure 4 exemplifies benefits of retaining dimensions up to ID. Fig 4.A shows how group-level embeddings obtained with Procrustes transformation improve as the number of dimensions approaches ID. Fig. 4.B shows classification accuracy improving in a similar way.
Discussion / Conclusions
tvFC’s ID ranged between 3 and 25. This suggests that although 3D should effectively summarize many aspects of tvFC data, non-visualization applications could benefit from retaining dimensions up to ID. Our results confirm both implications. First, 2D/3D embeddings faithfully represented task and subject structure, although that was true for a limited set of hyperparameters. Although automation of hyper-parameter selection is possible, it requires larger datasets and an optimization function. Defining such function in absence of labels (e.g., resting-state) is extremely challenging. Transferring heuristics from studies like ours, based on multi-task data, might be an effective alternative. Second, inter-scan alignment and task prediction improved as input dimensions approached ID, confirming the value of retaining dimensions up to ID for non-visualization purposes.Finally, our results also demonstrate the pervasiveness of tvFC temporal autocorrelation in MLTs. Sliding window procedures artifactually re-introduces dependence between consecutive windows even if the original timeseries lack it (e.g., null models). This will induce structure in the embeddings that can be misinterpreted as originated by actual neuronal processes. Null models can help alleviate this issue, but more informative embeddings might arise from tvFC representations that do not rely on sliding windows, such as edge-centric FC10. Understanding how to effectively apply MLTs to tvFC data will allow a more detailed exploration of the neural mechanisms underlying internally driven mentation and other phenomena for which the experimenter lacks a-priori information about their timing.
Acknowledgements
This research was also possible thanks to the support of the National Institute of Mental Health Intramural Research Programs (ZIAMH002783, ZICMH002968). Portions of this study used the high-performance computational capabilities of the Biowulf Linux cluster at the National Institutes of Health, Bethesda, MD (biowulf.nih.gov).
References
1. McInnes, L., Healy, J. & Melville, J. UMAP: Uniform Manifold Approximation and Projection for Dimension Reduction. Arxiv (2018).
2. Gonzalez-Castillo, J. et al. Tracking ongoing cognition in individuals using brief, whole-brain functional connectivity patterns. Proceedings of the National Academy of Sciences 112, (2015).
3. Craddock, R. C., James, G. A., Holtzheimer, P. E., Hu, X. P. & Mayberg, H. S. A whole brain fMRI atlas generated via spatially constrained spectral clustering. Human brain mapping 33, 1914–28 (2012).
4. Facco, E., d’Errico, M., Rodriguez, A. & Laio, A. Estimating the intrinsic dimension of datasets by a minimal neighborhood information. Sci Rep-uk 7, 12140 (2017).
5. Albergante, L., Bac, J. & Zinovyev, A. Estimating the effective dimension of large biological datasets using Fisher separability analysis. 2019 Int Jt Conf Neural Networks Ijcnn 00, 1–8 (2019).
6. Belkin, M. & Niyogi, P. Laplacian Eigenmaps for Dimensionality Reduction and Data Representation. Neural Computation 15, 1373–1396 (2003).
7. Maaten, L. van der & Hinton, G. Visualizing Data using t-SNE. https://www.jmlr.org/papers/v9/vandermaaten08a.html (2008).
8. Gower, J. C. Generalized procrustes analysis. Psychometrika 40, 33–51 (1975).
9. Rousseeuw, P. J. Silhouettes: A graphical aid to the interpretation and validation of cluster analysis. J Comput Appl Math 20, 53–65 (1987).
10. Faskowitz, J., Esfahlani, F. Z., Jo, Y., Sporns, O. & Betzel, R. F. Edge-centric functional network representations of human cerebral cortex reveal overlapping system-level architecture. Nat Neurosci 1–11 (2020) doi:10.1038/s41593-020-00719-y.
Figures