2948
MP-PCA image denoising technique for high resolution quantitative susceptibility mapping (QSM) of the human brain in vivo1Department of Electrical Engineering, Tel Aviv University, Tel Aviv, Israel, 2The Department of Biomedical Engineering, Tel-Aviv University, Tel-Aviv, Israel, 3Sagol School of Neuroscience, Tel-Aviv University, Tel-Aviv, Israel, 4Department of Medical Physics and Biomedical Engineering, University College London, London, United Kingdom, 5Center for Advanced Imaging Innovation and Research (CAI2R), New-York University Langone Medical Center, New York, NY, United States
Synopsis
Keywords: Data Processing, Susceptibility, Denoising
Quantitative susceptibility mapping (QSM) has many clinical applications such as distinguishing between acute and chronic multiple sclerosis (MS) lesions, and probing microbleeds in traumatic brain injury. High scan resolutions improve diagnostic quality and reduce partial volume artifacts albeit at a price of a lower signal-to-noise ratio (SNR). In this study, we introduce a principal component analysis (PCA) denoising algorithm for QSM data, showing the ability to generate QSM maps of the human brain at 0.6x0.6x0.6 mm3 resolution at 3T in vivo.
Introduction
Quantitative susceptibility mapping (QSM) is useful for a number of clinical applications such as distinguishing between acute and chronic multiple sclerosis (MS) lesions, probing microbleeds in traumatic brain injury patients, identifying iron level changes in the substantia nigra of Parkinson's disease patients, and, differentiating between calcification and hemorrhage1. QSM data is typically acquired with about 1mm3 isotropic resolution2-4, while higher resolution data can contribute to the contrast in the susceptibility maps by providing more accurate mapping of local field variations, leading to improved phase contrast4-6.Increasing image resolution can promote more accurate diagnosis, reduce partial volume effects, and enhance our understanding of brain pathology. On the other hand, acquiring high resolution data without greatly increasing scan times generally leads to a reduction in the SNR which can lower the diagnostic image quality. In this work, we applied Marchenko Pastur PCA (MP-PCA) denoising for T2*-weighted and QSM data4.
Validations are shown for in vivo human brain data.
Methods
MRI ScansA healthy volunteer was imaged on a 3 Tesla Prisma Siemens scanner (Ethics approval #3933-17-SMC), using a 20-channel head coil. T2*-weighted data were acquired using a 3D gradient echo (GRE) protocol [TE1 = 3.99 ms, ΔTE = 5.24 ms, Nechoes = 8, TR = 45 ms, FOV = 19.2 x 15.6 x 24 cm3, voxel size = 0.6 x 0.6 x 0.6 mm3, BW = 320 Hz/Px].
Denoising of QSM data
Denoising was performed on T2*-weighted images, which were then inputted into a QSM pipeline. The magnitude and the phase images were combined into a complex matrix of the T2*-weighted data. Denoising was done by shifting a 4-dimensional moving window of 2x2x2 voxels and N=8 echo times on this complex matrix. PCA was performed on each window, and principal components corresponding to noise were removed based on the distribution of the eigenvalues of the data covariance matrix according to Marchenko-Pastur criteria7-9. Data was then transformed back to the image domain as a complex matrix to yield denoised multi-echo T2*-weighted images which were used to reconstruct QSM maps using an optimized processing pipeline10.
Statistical analysis
Seven regions-of-interest (ROIs) were manually segmented on the original QSM maps (before denoising) and the mean, standard deviation (SD), and coefficient of variation (CV) of the magnetic susceptibility in each ROI were calculated before and after denoising.
Results
Figure 1 shows the T2*-weighted magnitude image at the 1st echo time before and after applying MP-PCA denoising, the difference map, and a map showing the number of principal components which were used for each voxel (P-map). Residual anatomical features can be observed in the difference map due to the spatial variability in the number of principal components retained within each voxel. Specifically, regions with sharp tissue features required relatively more principal components to be kept (higher P-map values) while areas with lower spatial frequency variations in contrast required retention of fewer principal components (lower P-map values) resulting in more effective denoising.High resolution (0.6x0.6x0.6 mm3) QSM Maps with and without denoising are shown in Figure 2. A 4D kernel of 2x2x2x8 was chosen in this case to match the slab selective 3D scan data over the echoes. One can appreciate the effectiveness of the denoising process and the fine details preservation of the tissue in the map in Figure 2B.
Segmented ROIs are presented in Figure 3A, overlaid on the denoised T2*-weighted magnitude image from the 1st echo time. Figure 3B illustrates four zoomed regions used to validate (by visual comparison in Figure 4) that no information is being lost in the denoising process. As can be appreciated in Figure 4, the denoised QSM map maintains fine details and edges with no visible blurring artifacts in comparison to the original map.
Table 1 contains the mean, standard deviation (SD), and coefficient of variation (CV) of the QSM map pre- and post-denoising for each segmented ROI. Mean values exhibited small changes pre- and post-denoising indicating that no bias is introduced by the denoising process beyond the natural inter-scan variability. SD and CV values decreased after denoising as expected, except for the right Thalamus, where the measured susceptibility was close to zero.
Discussion
In this study, we introduced a pipeline for denoising high-resolution QSM data based on MP-PCA and provided proof-of-concept of this denoising technique for a high-resolution brain image. Our results show that the MP-PCA denoising algorithm can be used to denoise T2*-weighted magnitude images and applied to high-resolution QSM without visible loss of information. The relatively close mean susceptibility values in the selected ROIs show that no bias was introduced by the denoising process. Moreover, a distinct decrease in the SD and CV values was observed in all ROIs with denoising, as expected.This study provides initial validation and proof-of-concept of the denoising pipeline. However, further analysis is required on a larger cohort and for specific pathologies. Based on these results, we believe that the proposed pipeline has the potential to be applied to high-resolution scans to improve the diagnostic quality of QSM.
Acknowledgements
Karin Shmueli, Anita Karsa and Patrick Fuchs were supported by European Research Council Consolidator Grant DiSCo MRI SFN 770939.
References
[1] Eskreis-Winkler, S., Zhang, Y., Zhang, J., Liu, Z., Dimov, A., Gupta, A., & Wang, Y. (2017). The clinical utility of QSM: disease diagnosis, medical management, and surgical planning. NMR in Biomedicine, 30(4), e3668. https://doi.org/10.1002/nbm.3668
[2] Langkammer, C., Bredies, K., Poser, B. A., Barth, M., Reishofer, G., Fan, A. P., Bilgic, B., Fazekas, F., Mainero, C., & Ropele, S. (2015). Fast quantitative susceptibility mapping using 3D EPI and total generalized variation. NeuroImage, 111, 622–630. https://doi.org/10.1016/j.neuroimage.2015.02.041
[3] Dimov, A. v., Gupta, A., Kopell, B. H., & Wang, Y. (2019). High-resolution QSM for functional and structural depiction of subthalamic nuclei in DBS presurgical mapping. Journal of Neurosurgery, 131(2), 360–367. https://doi.org/10.3171/2018.3.JNS172145
[4] Karsa, A., Punwani, S., & Shmueli, K. (2019). The effect of low resolution and coverage on the accuracy of susceptibility mapping. Magnetic Resonance in Medicine, 81(3), 1833–1848. https://doi.org/10.1002/mrm.27542
[5] Wang, Y., & Liu, T. (2015). Quantitative susceptibility mapping (QSM): Decoding MRI data for a tissue magnetic biomarker. Magnetic Resonance in Medicine, 73(1), 82–101. https://doi.org/10.1002/mrm.25358
[6] Haacke, E. M., Liu, S., Buch, S., Zheng, W., Wu, D., & Ye, Y. (2015). Quantitative susceptibility mapping: current status and future directions. Magnetic Resonance Imaging, 33(1), 1–25. https://doi.org/10.1016/j.mri.2014.09.004
[7] Does, M. D., Olesen, J. L., Harkins, K. D., Serradas‐Duarte, T., Gochberg, D. F., Jespersen, S. N., & Shemesh, N. (2019). Evaluation of principal component analysis image denoising on multi‐exponential MRI relaxometry. Magnetic Resonance in Medicine, mrm.27658. https://doi.org/10.1002/mrm.27658.
[8] Veraart, J., Novikov, D. S., Christiaens, D., Ades-aron, B., Sijbers, J., & Fieremans, E. (2016). Denoising of diffusion MRI using random matrix theory. NeuroImage, 142, 394–406. https://doi.org/10.1016/j.neuroimage.2016.08.016.
[9] Stern, N., Radunsky, D., Blumenfeld‐Katzir, T., Chechik, Y., Solomon, C., & Ben‐Eliezer, N. (2022). Mapping of magnetic resonance imaging’s transverse relaxation time at low signal‐to‐noise ratio using Bloch simulations and principal component analysis image denoising. NMR in Biomedicine. https://doi.org/10.1002/nbm.4807
[10] Karsa, A., Punwani, S., & Shmueli, K. (2020). An optimized and highly repeatable MRI acquisition and processing pipeline for quantitative susceptibility mapping in the head‐and‐neck region. Magnetic Resonance in Medicine, 84(6), 3206–3222. https://doi.org/10.1002/mrm.28377
Figures
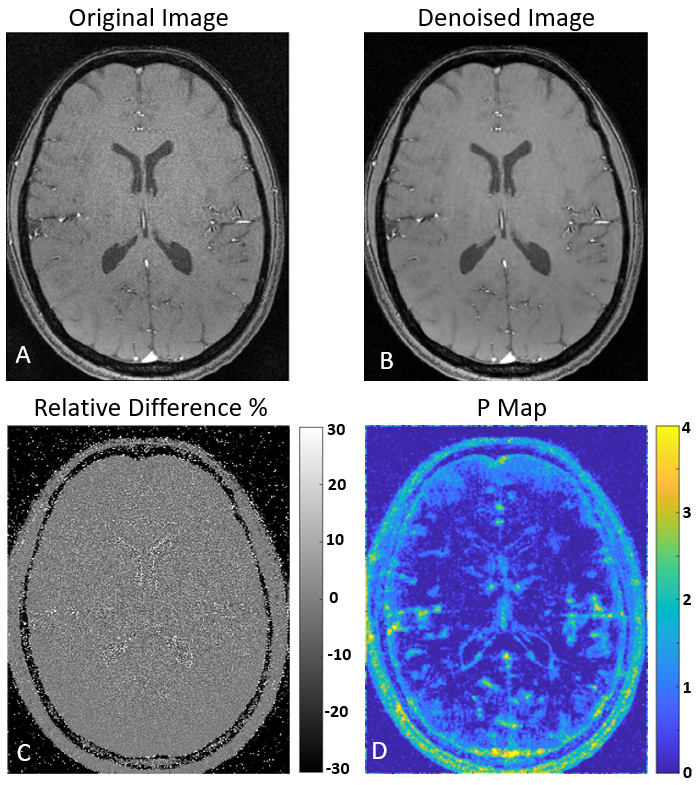
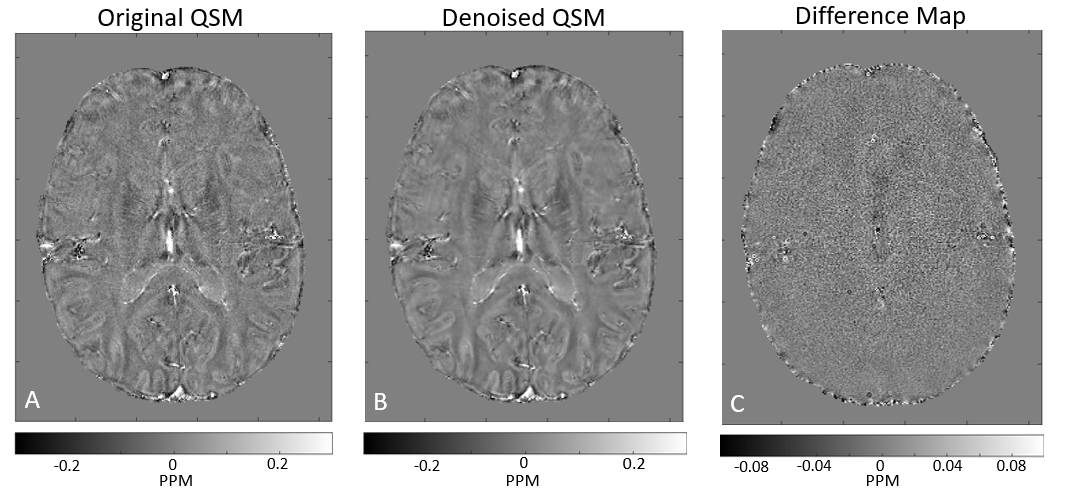
Figure 2. Quantitative Susceptibility maps, (A) the original QSM output, (B) the QSM output which was denoised before with a 2x2x2x8 window, and (C) the difference between the two outputs. As can be seen there is almost no visible anatomy.
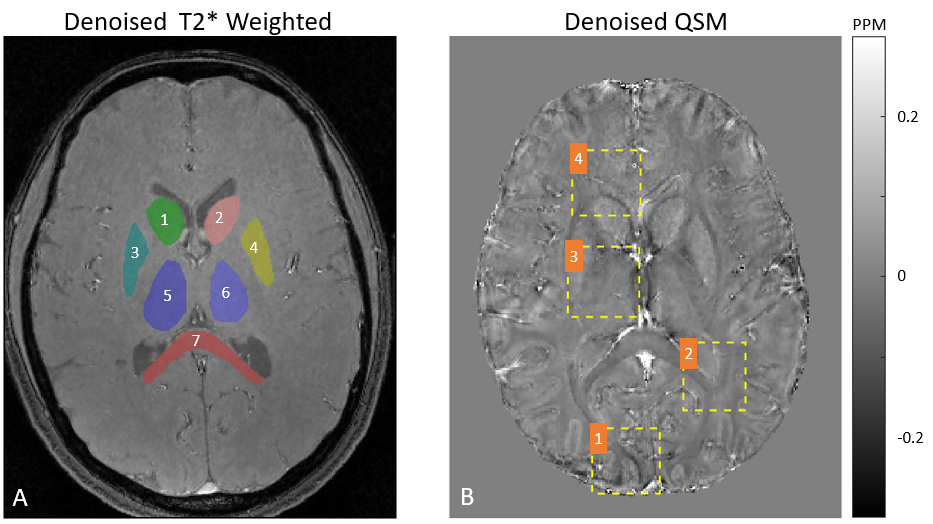
Figure 3. (A) Manual Segmentation of seven brain ROIs: (1) Left Putamen (2) Right Putamen (3) Left Caudate (4) Right Caudate (5) Left Thalamus (6) Right Thalamus (7) Corpus Callosum. (B) Example of four representative ROIs used to validate no information is being lost by the denoising process.
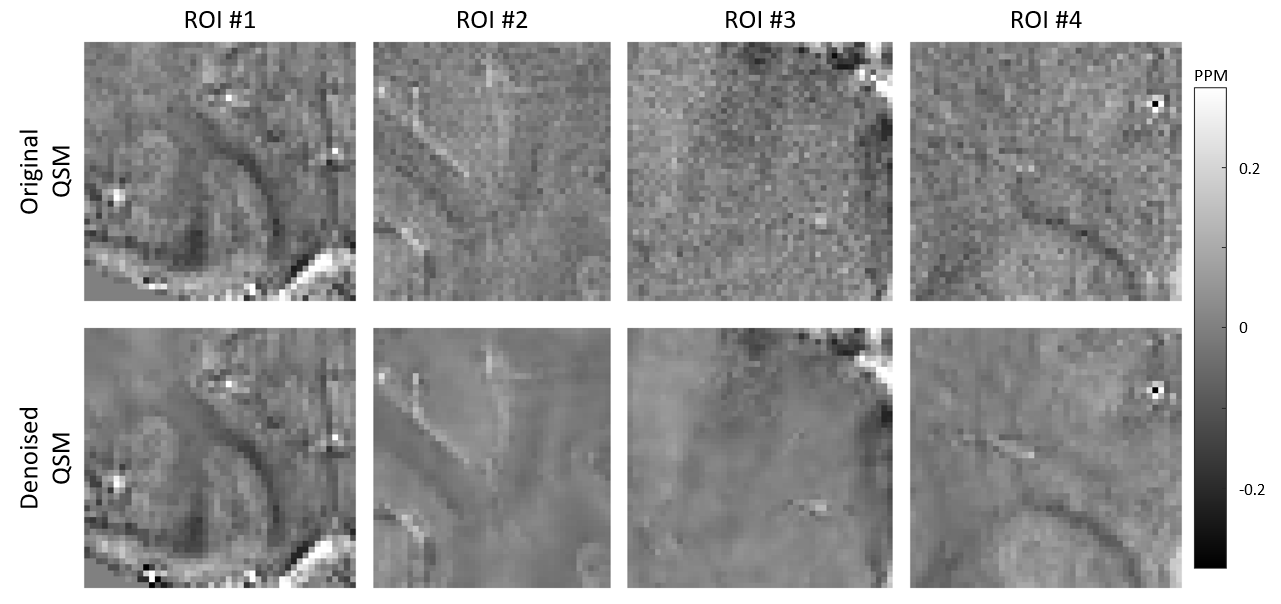
Figure 4. Four zoomed-in ROIs on QSM maps before and after denoising (see Figure 3B).
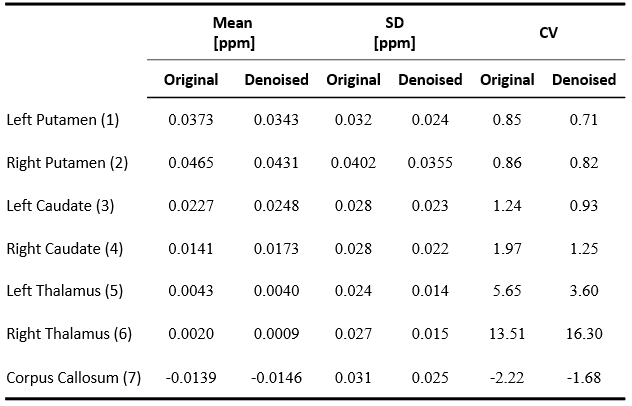
Table 1. Statistical analysis for the ROIs were segmented in Figure 3A. Mean, standard deviation (SD), and coefficient of variation (CV) were calculated for each ROI.