2939
Through-plane Super-resolution of Prostate MRI Using Diffusion Models1Department of Radiological Sciences, University of California, Los Angeles, Los Angeles, CA, United States
Synopsis
Keywords: Data Analysis, Prostate, super resolution
We proposed a generative models-based method for through-plane super-resolution of multi-slice MRI scans. We proposed a novel slice-profile transformation that synthesizes low/high through-plane resolution slices for model training without accessing to isotropic datasets. Expert ready study, visual and quantitative comparisons reveal our method produce superior super-resolution results in terms of sharpness, artifacts, noise level and overall image quality.Purpose
High-resolution isotropic three-dimensional (3D) magnetic resonance imaging (MRI) sequences are clinically desirable because they can be reformatted into preferred orientations but suffer from long scanning time-related blurring. Multi-slice two-dimensional (2D)TSE imaging is commonly used because of its high in-plane resolution but is limited clinically by poor through-plane resolution.This study aimed at providing a deep learning-based method for through-plane super-resolution (SR) of multi-slice 2D turbo spin-echo (TSE) MRI. The proposed method can produce isotropic 3D scans from 2D TSE MR images via through-plane super-resolution.
Method
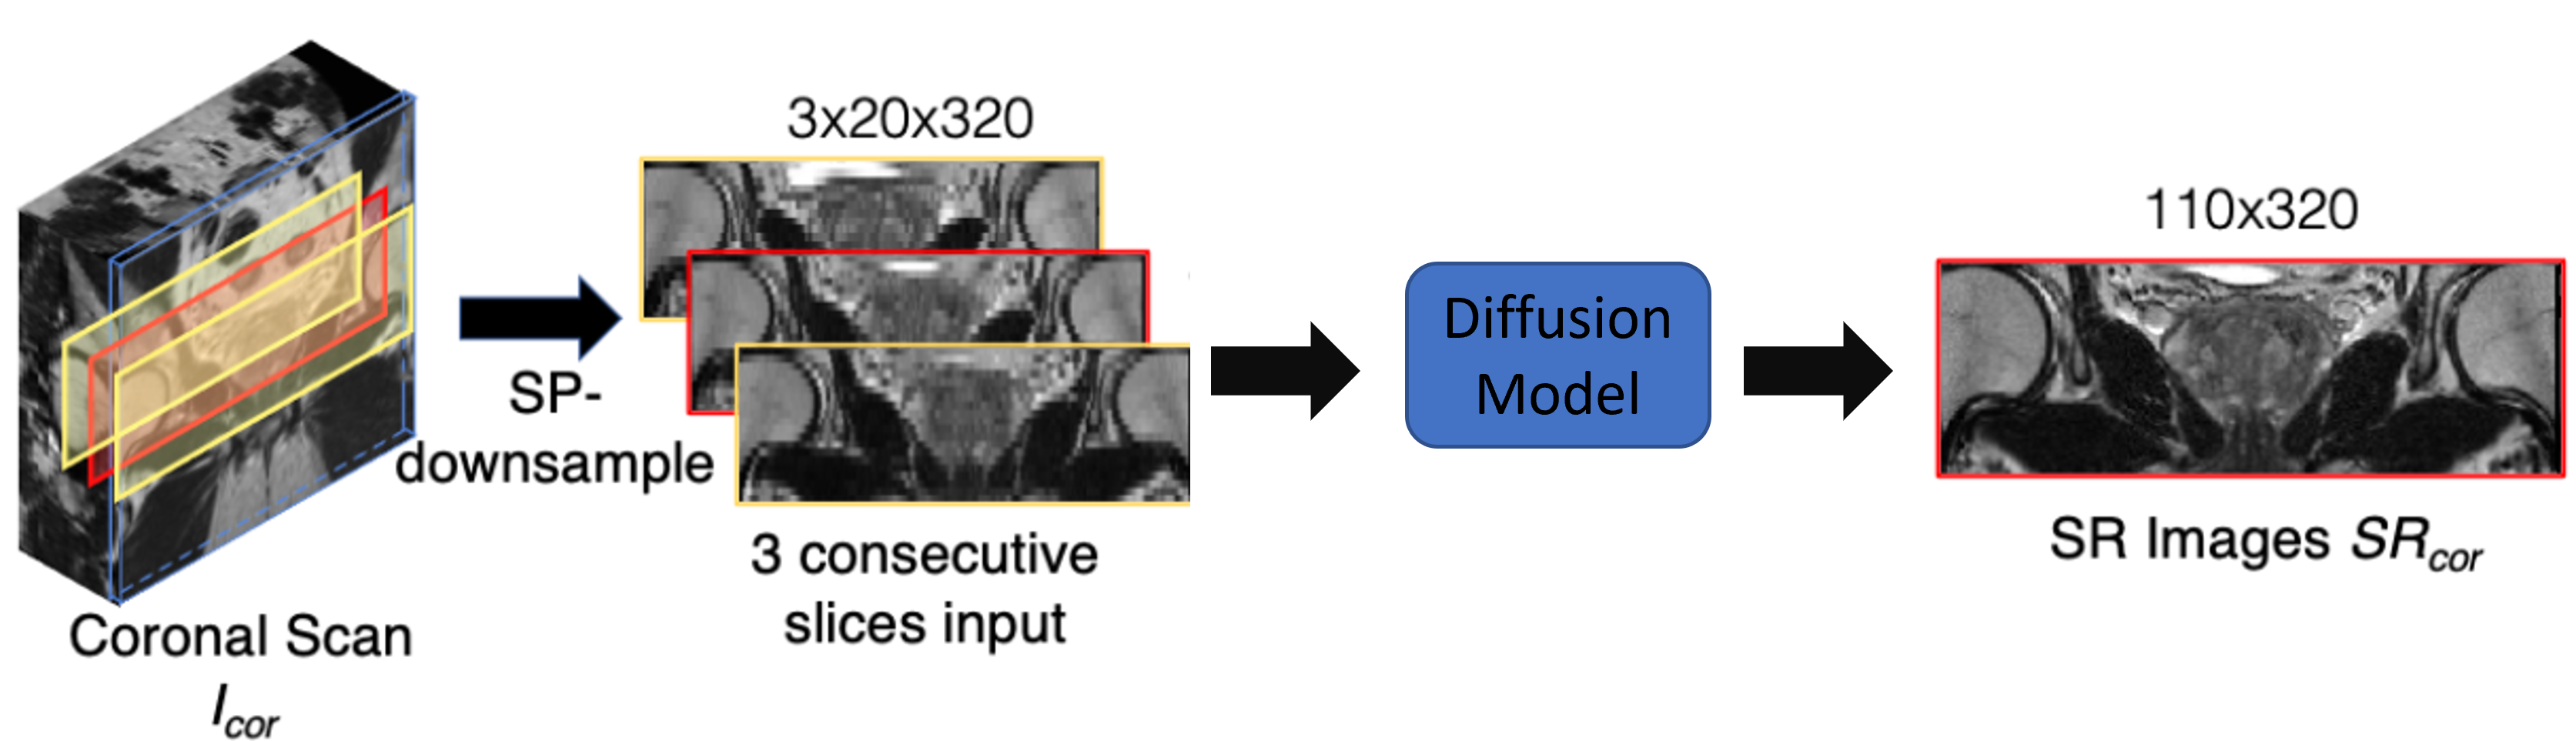
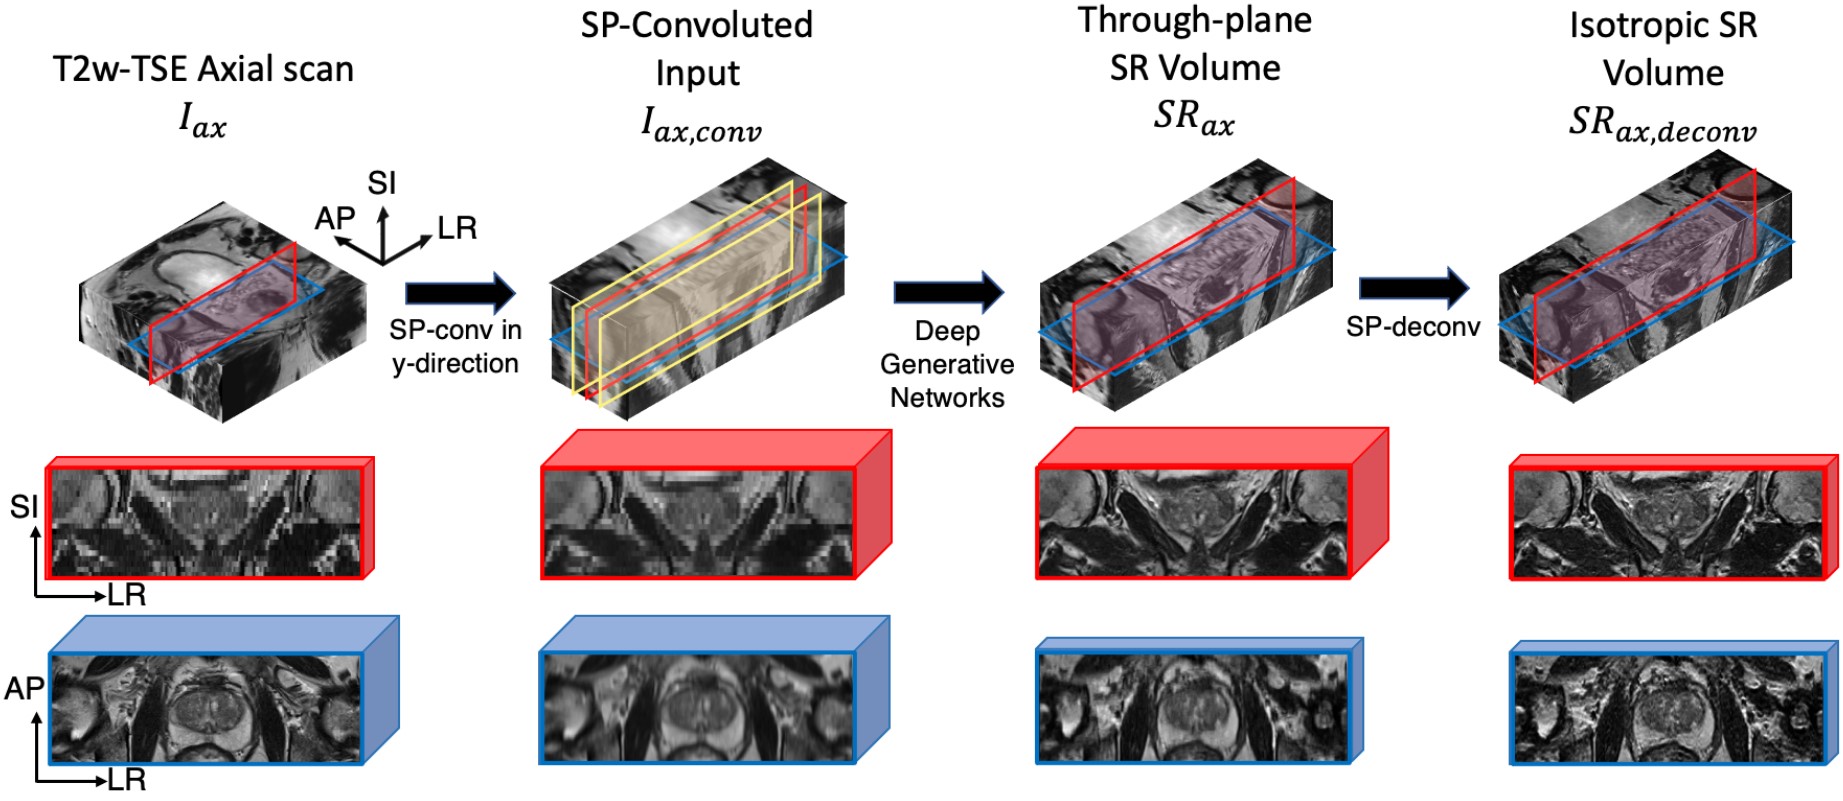
Due to the lack of low/high through-plane resolution image pairs, we proposed to use the slice-profile transformation to synthesize low-resolution images from another orthogonal plane. Specifically, to perform through-plane SR of an axial scan, we use slice-profile transformation to down-sample coronal scans along the superior-inferior (SI) direction. The slice-profile down-sampled coronal scan images are used as the input to diffusion models8 and the original coronal scans were used as ground-truth to supervise the model. During training, the model learned to SR along the SI direction. The flow chart of the training phase was illustrated in Fig.1.The overall inference flow is shown in Fig. 2. Similar to the training, 3-slice input, the input for inference contains three SPconvolved slices, including a center slice (red) and two adjacent slices (yellow). When testing, the axial scans are input to the trained model to get SR output. The SR is performed along the SI direction as it was during training. Fig.2 illustrated the testing pipeline of our method.
Results
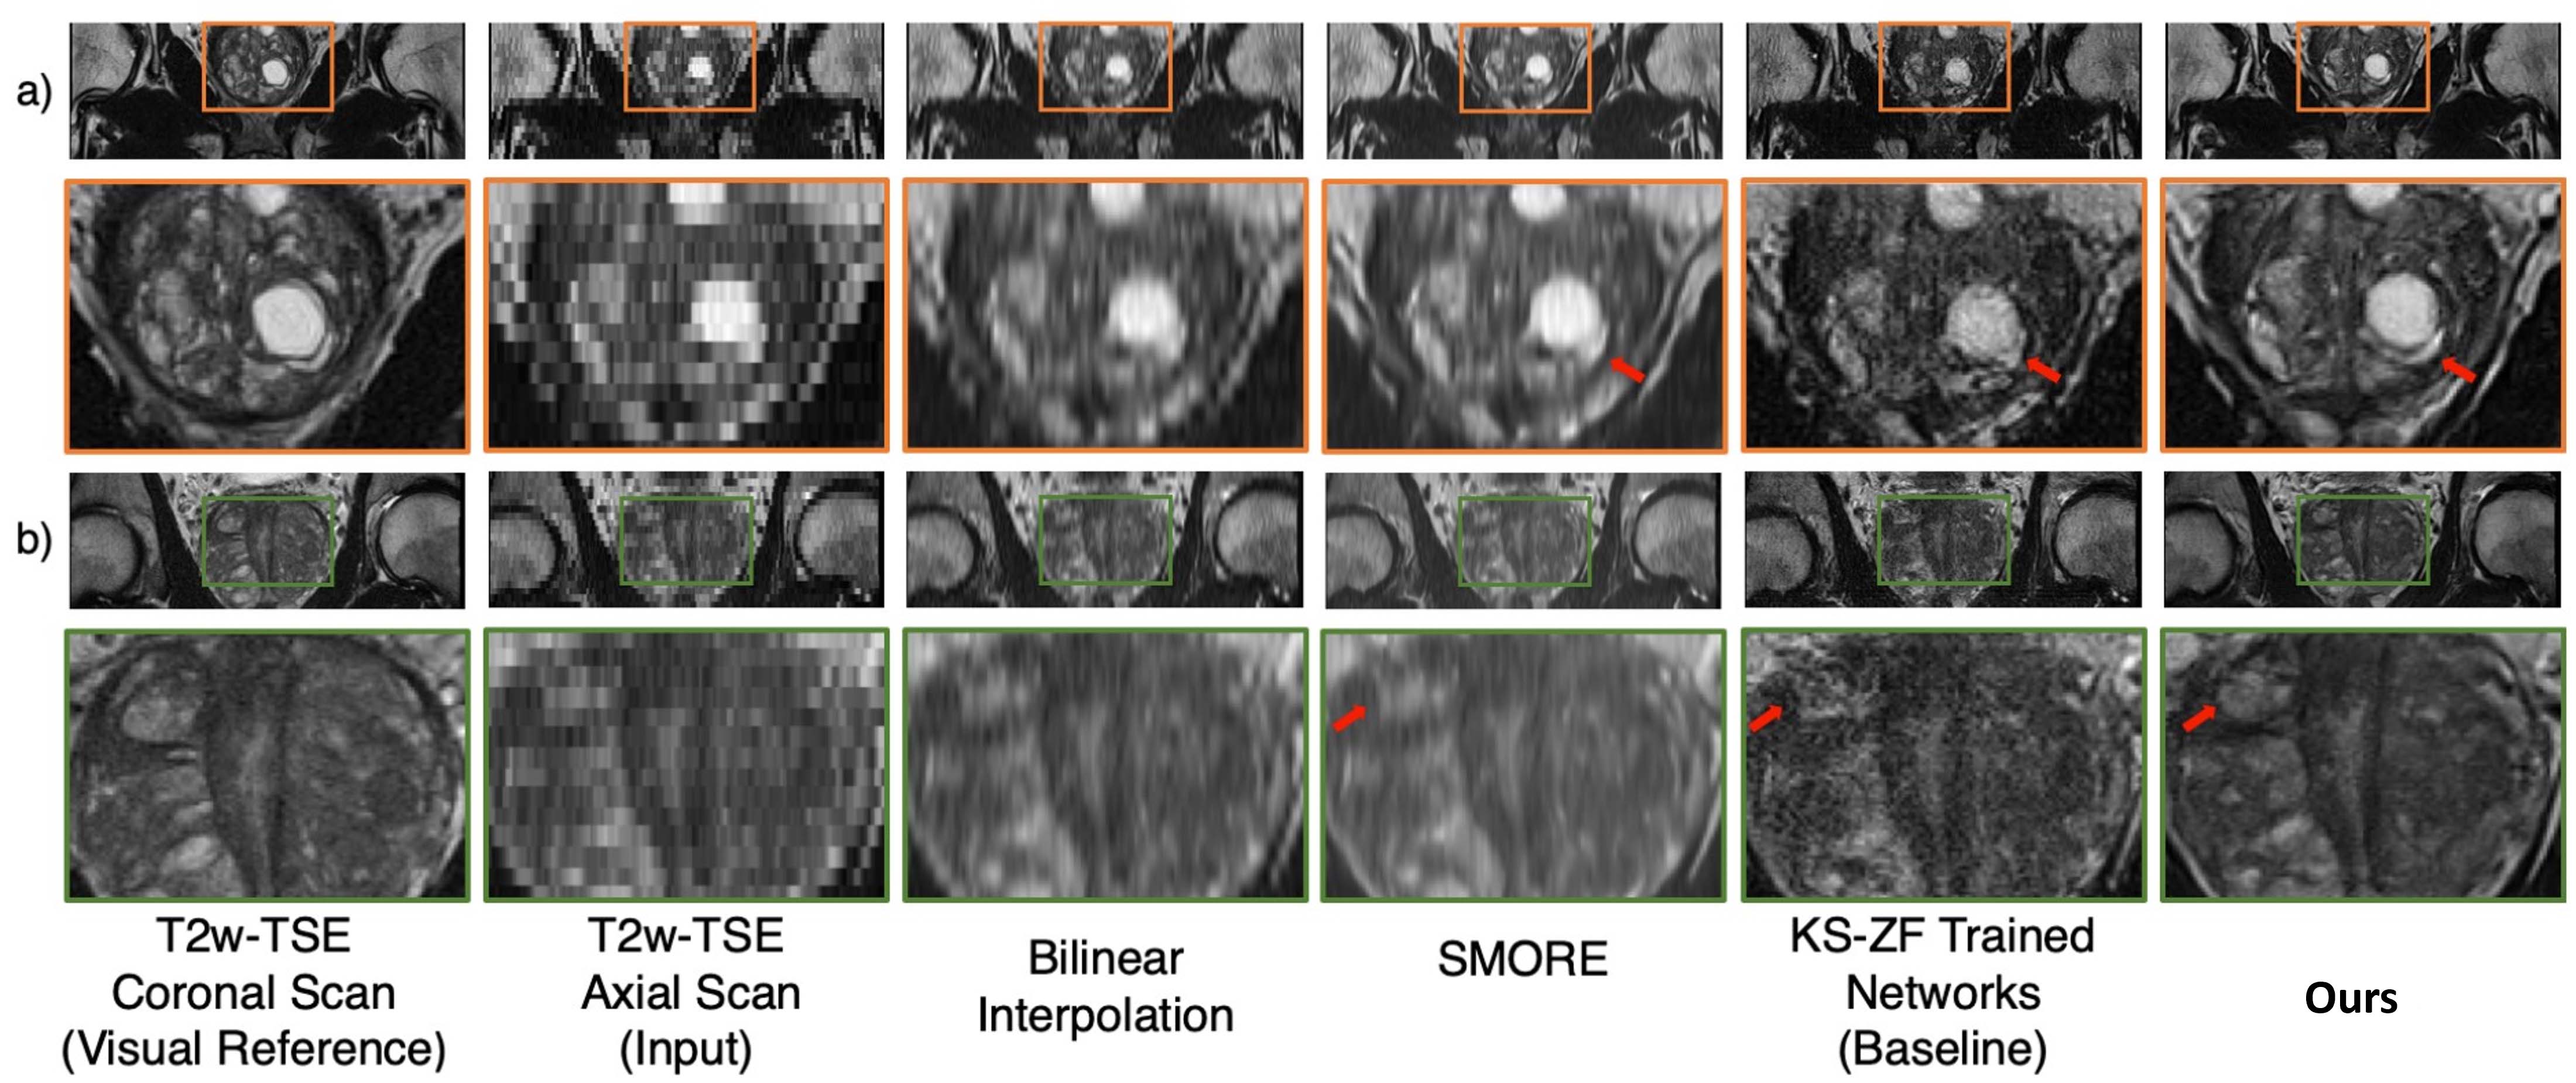
We retrospectively reviewed all clinical prostate MRI scans from March 2013 to December 2018 at a single academic institution and identified a total of 3,895 clinical subjects with 4,878 pairs of axial and coronal scans using the multi-slice 2D T2-weighted turbo spin-echo (T2w-TSE) sequence. The training/validation/testing splits were 3,453/392/50 from 3,895 clinical subjects. Training and validation used coronal scans. All of the training and validation coronal scans were cropped (320 to 110) in the z-direction to the same physical coverage distance as the axial scans.Two visual through-plane SR results were shown in Fig.3. Our SR quality is better than other SR method such as SMORE1. Model trained with our proposed slice-profile downsample performs better than being trained with other downsampling method lick k-space zero-filling (KS-ZF)2,3
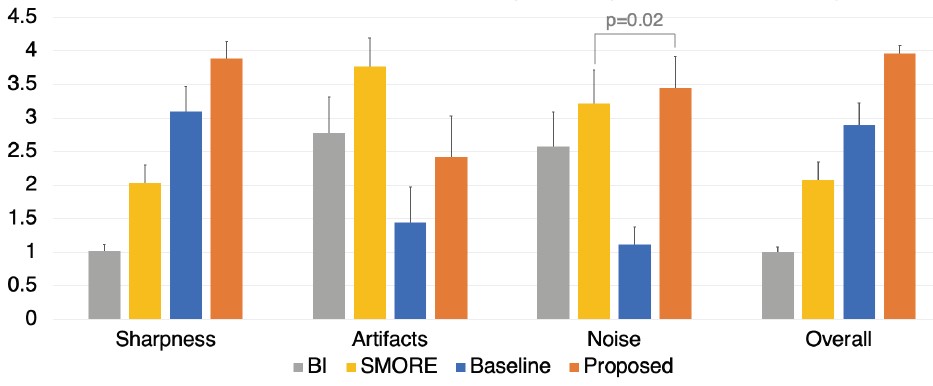
We performed expert reader study similar to recent studies4,5. After a few training sessions, two genitourinary radiologists (M.Q. and C.S.; each had interpreted 500-1,500 prostate MRI scans with 5+ years ofexperience) independently assessed four methods: bilinear interpolation (BI), SMORE [1], KS-ZF trained networks(baseline) and the proposed. The quality of SR is evaluated by a overall quality score ranging from 1 to 4 (higher is better). Results in Fig.4 demonstrated that our method is the best among other competitors.
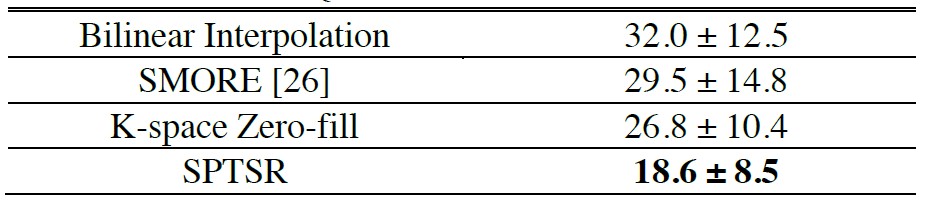
Quantitative comparisons using the Frechet Inception Distance (FID)6 score were summarized in Fig.5. Our method achieved the best FID scores, demonstrating the superior quality of SR results.
Discussions
We proposed a slice-profile transformation-based super-resolution method using the diffusion models8. Our method can convert multi-slice TSE-MRI images to isotropic 3D volumes by performing SR in the through-plane axis. We performed expert reader studies, visual comparisons, and quantitative comparisons. All the comparisons reveal that our method produced better SR outputs compared to existing SR methods and baselines.Conclusion
In conclusion, we developed a novel slice-profile transformation-based super-resolution framework for the super-resolution of multi-slice 2D MRI scans. The proposed slice-profile transformations bridge the inherent physical mismatches between training and testing inputs due to an imperfect slice-selection profile. A large set of 4,878 pairs of axial and coronal MRI scans were used for training, validation, and testing of the proposed SPTSR framework. The expert reader study and experimental validation demonstrated the effectiveness of SPTSR in 5.5x through-plane SR with isotropic voxel spacing. Furthermore, we illustrated the feasibility of achieving the isotropic SR with non-overlapping cubic voxels.Acknowledgements
This work was supported in part by the National Institutes of Health R01-CA248506 and funds from the Integrated Diagnostics Program, Departments of Radiological Sciences and Pathology, David Geffen School of Medicine, UCLA.References
[1] Zhao, Can, et al. "SMORE: a self-supervised anti-aliasing and super-resolution algorithm for MRI using deep learning." IEEE transactions on medical imaging 40.3 (2020): 805-817.
[2] Masutani, Evan M., Naeim Bahrami, and Albert Hsiao. "Deep learning single-frame and multiframe super-resolution for cardiac MRI." Radiology 295.3 (2020): 552.
[3] Wang, Jiancong, et al. "Enhanced generative adversarial network for 3D brain MRI super-resolution." Proceedings of the IEEE/CVF Winter Conference on Applications of Computer Vision. 2020.
[4] Chaudhari, Akshay S., et al. "Super‐resolution musculoskeletal MRI using deep learning." Magnetic resonance in medicine 80.5 (2018): 2139-2154.
[5] Yaman, Burhaneddin, et al. "Self‐supervised learning of physics‐guided reconstruction neural networks without fully sampled reference data." Magnetic resonance in medicine 84.6 (2020): 3172-3191.
[6] Heusel, Martin, et al. "Gans trained by a two time-scale update rule converge to a local nash equilibrium." Advances in neural information processing systems 30 (2017).
[8] Ho, Jonathan, Ajay Jain, and Pieter Abbeel. "Denoising diffusion probabilistic models." Advances in Neural Information Processing Systems 33 (2020): 6840-6851.
Figures