2918
MRI evidence for reduced human brain oxygen metabolism during midazolam sedation1Cardiff University Brain Research Imaging Centre (CUBRIC), Department of Psychology, Cardiff University, Cardiff, United Kingdom, 2Cardiff University Brain Research Imaging Centre (CUBRIC), School of Physics and Astronomy, Cardiff University, Cardiff, United Kingdom, 3Department of Anaesthetics, ICU and Pain medicine, Cwm Taf Morgannwg University Health Board, Merthyr Tydfil, United Kingdom, 4Neurosciences, Imaging and Clinical Sciences, University “G. d'Annunzio” of Chieti-Pescara, Chieti, Italy, 5Institute for Advanced Biomedical Technologies (ITAB), G. d’Annunzio University’ of Chieti-Pescara, Chieti, Italy
Synopsis
Keywords: Data Analysis, Arterial spin labelling
We investigated the effects of mild sedation with the type A GABA receptor positive allosteric modulator (GABAA-R PAM) midazolam, on cerebral blood flow (CBF), oxygen extraction fraction (OEF) and the rate of cerebral metabolic oxygen consumption (CMRO2) in the healthy human brain using ASL and TRUST MRI. CMRO2 was significantly reduced during sedation compared to wakefulness but no statistically significant change in CBF or OEF was detected. Our data are consistent with prior imaging evidence of reduced brain energy consumption during sedation with midazolam.Introduction
Consistent with many pharmacological agents with an anaesthetic or sedative action, acute administration of benzodiazepines produces a progressive reduction in cerebral blood flow (CBF) and cerebral oxygen metabolism,1-3 reflecting a reduced brain energy consumption. Midazolam is a GABAA-R PAM, benzodiazepine commonly used in clinical practice to achieve conscious sedation through potentiation of GABA receptors by increasing GABAA-R signalling in the presence of GABA by facilitating chloride channel opening. Prior imaging studies suggest that after midazolam infusion, a reduction in cerebral blood flow (CBF) and the cerebral metabolic rate of oxygen consumption (CMRO2) is observed, with no difference in oxygen extraction fraction.3 Most prior studies examining midazolam-induced changes in CMRO2 rely on positron emission tomography. 3-5 Here, we aim to demonstrate the combined use of T2-Relaxation-Under-Spin-Tagging (TRUST),6 an MRI method to estimate brain oxygen extraction fraction, with arterial spin labelling (ASL) CBF MRI to estimate global change in CMRO2 with midazolam sedation in healthy volunteers. We hypothesise a decrease in CMRO2 and CBF under sedation compared to wakefulness.Methods
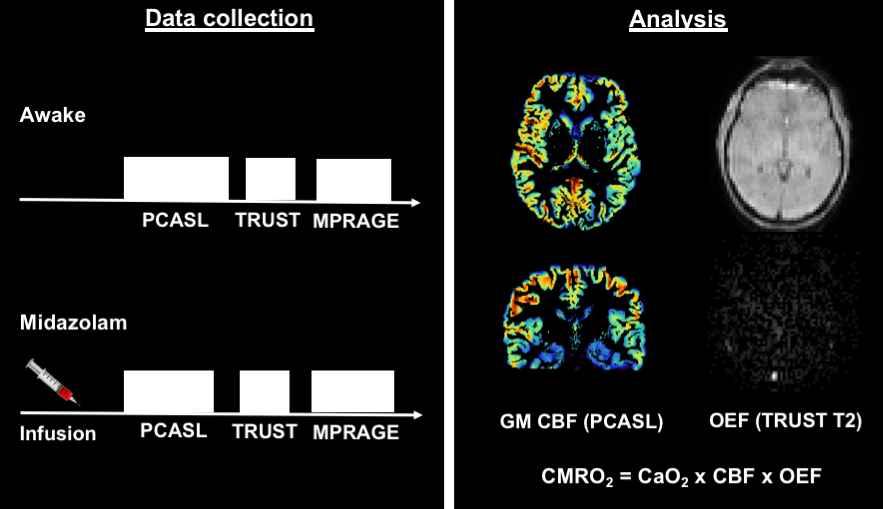
Eight young healthy males took part in this MRI study (mean age = 25 ± 3.7 years). Participants were scanned at Cardiff University Brain Research Imaging Centre (CUBRIC) using the same MRI protocol awake, and then during sedation with intravenously administered midazolam, using a target controlled infusion through an Arcomed pump (Figure 1).7 Infusion was started at an effect site concentration of 10 ng/ml. Once steady-state was achieved, we waited for 5 min for further equilibration. Infusion rate was increased in 2ng/ml increments until mild sedation was achieved (Objective assessment of Alertness/sedation score of 4).8 If participants appeared over-sedated, infusion rate was reduced in 1ng/ml steps. Measurements were performed at 3T (Prisma MAGNETOM, Siemens Healthcare, Erlangen, Germany) with a 32 channel Siemens head receive coil. The MRI protocol included TRUST 6 to estimate global venous oxygenation from the superior sagittal sinus (Scan parameters - TE: 3.9 ms, TR: 3000 ms, slice thickness: 5mm, eTE: 0ms, 40ms, 80ms, 160ms, GRAPPA acceleration factor: 3) and a dual-excitation PCASL based ASL sequence to estimate CBF (Scan parameters - TE1: 10ms, TR1: 3600ms, TE2: 30ms, TR2: 800ms, slices: 15, measurements: 68, slice thickness: 6.5mm, and GRAPPA acceleration factor 3). We also acquired a phase-contrast scan for localising neck vessels (for PCASL sequence), and a 1mm isotropic resolution T1-MPRAGE for grey matter segmentation and image registration. An inversion recovery sequence (Scan parameters - TE: 22ms, ΔTR: 150ms, flip angle: 90 degrees, and GRAPPA acceleration factor 2) was used to measure blood T1 and estimate Hct. OEF was estimated assuming 98% arterial oxygen saturation, and stable Hct between wakefulness and sedation. The venous oxygen saturation was derived from exponential fitting of the TRUST signal in the sagittal sinus. CBF was estimated from the first 5 minutes of the PCASL data, with the average grey matter perfusion signal (GM pve > 0.5) calculated with a standard 1-compartment ASL model. Paired-samples t-tests were performed for each parameter in order to compare between sedative and wakeful states.Results
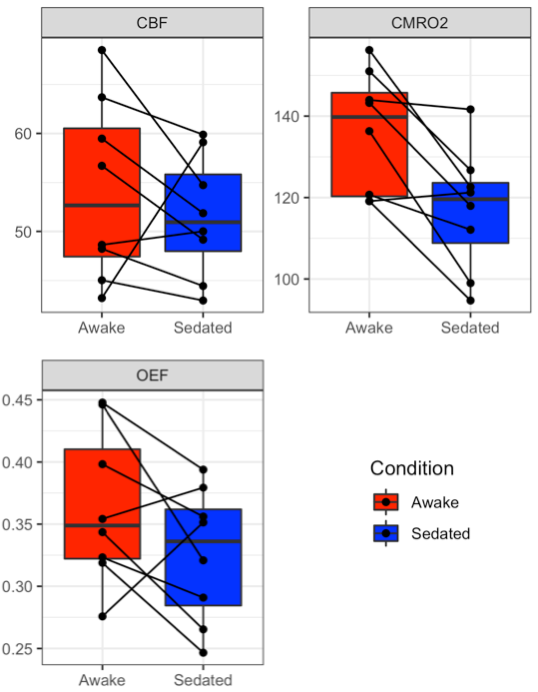
The effect site concentration required to achieve mild sedation was on average 14.4 ± 1.3 ng/ml. Results show significantly reduced CMRO2 during sedation (sedation vs awake: 116.99 ± 5.34 vs. 136.20 ± 5.27, μmol/100g/min) [df = 7, t = 3.74 , p = 0.007], but no significant difference in CBF (sedation vs awake: 51.52 ± 2.19 vs. 54.18 ± 3.28, ml/100g/min) [df = 7, t = 0.86, p = 0.42] or OEF (sedation vs awake: 0.33 ± 0.02 vs. 0.36 ± 0.02) [df = 7, t = 1.71 , p = 0.13] (Figure 2).Discussion and Conclusions
Our results are consistent with prior evidence showing a substantial reduction in CMRO2 during mild sedation with midazolam.1-3 However, our results do not identify a statistically significant reduction in CBF, perhaps partly due to the small number of participants in our cohort. This result may also reflect the lighter levels of sedation reached with midazolam in our study (lower serum concentrations of midazolam compared to prior reports).5 We have demonstrated the methodological feasibility of measuring global CMRO2, a marker of brain energy consumption, during pharmacological sedation with midazolam. However, we make a number of assumptions including: that the whole brain OEF is reflected by the venous blood oxygen saturation in the superior sagittal sinus, and the CBF variation is represented by the GM CBF signal that is more reliably measured by ASL than the WM signal. In conclusion, we suggest that by combining TRUST (OEF) and ASL (CBF), we have a metabolic measurement (CMRO2) that may be more sensitive to alterations in cerebral oxygen consumption in pharmacological studies.Acknowledgements
HLC, ID, SK, NS, and MG were funded by a Wellcome Strategic Award to CUBRIC, ‘Multi-scale and multi-modal assessment of coupling in the healthy and diseased brain’, grant reference 104943/Z/14/Z. MG thanks the Wellcome Trust for its support via a Sir Henry Dale Fellowship (220575/Z/20/Z).References
1. Slupe AM and Kirsch JR. Effects of anesthesia on cerebral blood flow, metabolism, and neuroprotection. J Cereb Blood Flow Metab. 2018; 38: 2192-208.
2. Cotev S and Shalit MN. Effects on diazepam on cerebral blood flow and oxygen uptake after head injury. Anesthesiology. 1975; 43: 117-22.
3. Veselis RA, Reinsel RA, Beattie BJ, et al. Midazolam changes cerebral blood flow in discrete brain regions: an H2(15)O positron emission tomography study. Anesthesiology. 1997; 87: 1106-17.
4. Nugent M, Artru AA and Michenfelder JD. Cerebral metabolic, vascular and protective effects of midazolam maleate: comparison to diazepam. Anesthesiology. 1982; 56: 172-6.
5. Reinsel RA, Veselis RA, Dnistrian AM, Feshchenko VA, Beattie BJ and Duff MR. Midazolam decreases cerebral blood flow in the left prefrontal cortex in a dose-dependent fashion. Int J Neuropsychopharmacol. 2000; 3: 117-27.
6. Lu, H., Xu, F., Grgac, K., Liu, P., Qin, Q. and Van Zijl, P., 2012. Calibration and validation of TRUST MRI for the estimation of cerebral blood oxygenation. Magnetic resonance in medicine, 67(1), pp.42-49.
7. Greenblatt DJ, Ehrenberg BL, Culm KE, et al. Kinetics and EEG effects of midazolam during and after 1-minute, 1-hour, and 3-hour intravenous infusions. J Clin Pharmacol. 2004; 44: 605-11.
8. Thomson AJ, Nimmo AF, Tiplady B and Glen JB. Evaluation of a new method of assessing depth of sedation using two-choice visual reaction time testing on a mobile phone. Anaesthesia. 2009; 64: 32-8.
Figures