2916
Comparison of Blood Flow Measurement of Posterior Cerebral Circulation at Vertebral and Basilar Arteries Using Phase Contrast MRI1The Russell H. Morgan Department of Radiology and Radiological Science, Johns Hopkins University, Baltimore, MD, United States, 2F.M. Kirby Research Center for Functional Brain Imaging, Kennedy Krieger Institute, Baltimore, MD, United States
Synopsis
Keywords: Data Acquisition, Velocity & Flow
Phase contrast (PC) MRI provides a quantitative measurement of the total flux of blood flow. As it is not easy to find a perpendicular plane to the vertebral arteries (VA) at the base of the brain, especially in the elderly and people who developed tortuous arteries, we explored the alternative imaging location at the basilar artery (BA) where two VA merged in front of the pon. The flux of BA shows an excellent correlation (ρ=0.9, P<0.01) with that of VA, suggesting that BA is a practical choice for measuring the global blood flow of posterior cerebral circulation using PC MRI.Introduction
Phase contrast (PC) MRI measures the accumulative phase that is sensitive to the through-plane velocity to provide a quantification of the flux of blood flow within vessels of interest. Since PC MRI gives a fast and quantitative measurement of the flux, its utility in neuroimaging has been critical. For example, the global cerebral blood flow (CBF) in units of mL/100g/min derived from PC MRI has been used in the calibration of positron emission tomography 1, susceptibility contrast MRI 2, and arterial spin labeling 3 for perfusion mapping, as well as the quantification of the whole-brain cerebral metabolic rate of oxygen 4,5.It is known that the accuracy of the PC MRI is sensitive to the angle between the image slice and vessel 6. Ideally, the imaging slice of PC MRI needs to be placed perpendicular to the blood vessel. However, this can be challenging when deploying this requirement on the vertebral arteries (VA), the major blood supply for the posterior portion of circles of Willis. As bilateral VAs present two turns between the 2nd cervical vertebrae (C2) and the entrance to the foramen magnum, there is only a sweet spot for placing the imaging slice 7. Thus it is very difficult to find that sweet spot in the elderly and patients who have developed tortuous arteries. Compared to VAs at the base of the skull area, the basilar artery (BA) is relatively straight after VAs merge in front of the pon. Here, we compared the flux measurement by PC MRI between two VAs and one BA to promote a more practical protocol for global CBF quantification with PC MRI.
Methods
Experiments were conducted on a 3T Philips scanner using a 32-channel head-only coil for signal reception. 14 subjects (age 39.5±12.8 years old, 10F/4M) were enrolled with written informed consent.To visualize the VA and BA, a 3D velocity-selective (VS) MR angiography 8,9 was used for large coverage from head to neck. FOV = 200 (AP) x 180 (LR) x 200 (FH), acquired voxel size = 0.6 x 0.7 x 1.2 mm3, reconstructed voxel size = 0.6 x 0.6 x0.6 mm3, TR / TE / FA = 9.1 ms/ 2.4 ms / 8°, Compressed SENSE factor = 6, cutoff velocity = 1.7 cm/s, the scan duration = 3 min 10 s.
The axial single-slice acquisition of PC MRI was used for targeting one artery at a time. Three runs of PC MRI were performed using a plane oriented perpendicular to the left VA, the right VA, and the BA, respectively. Scan parameters were acquired at voxel size = 0.5 x 0.5 x 5 mm3, reconstructed voxel size = FOV = 200 x 200 x 5 mm3, TR / TE / FA = 19 ms/ 9 ms/ 15°, maximum velocity encoding = 60 cm/s, without cardiac triggering, the scan duration of each run was 20 s.
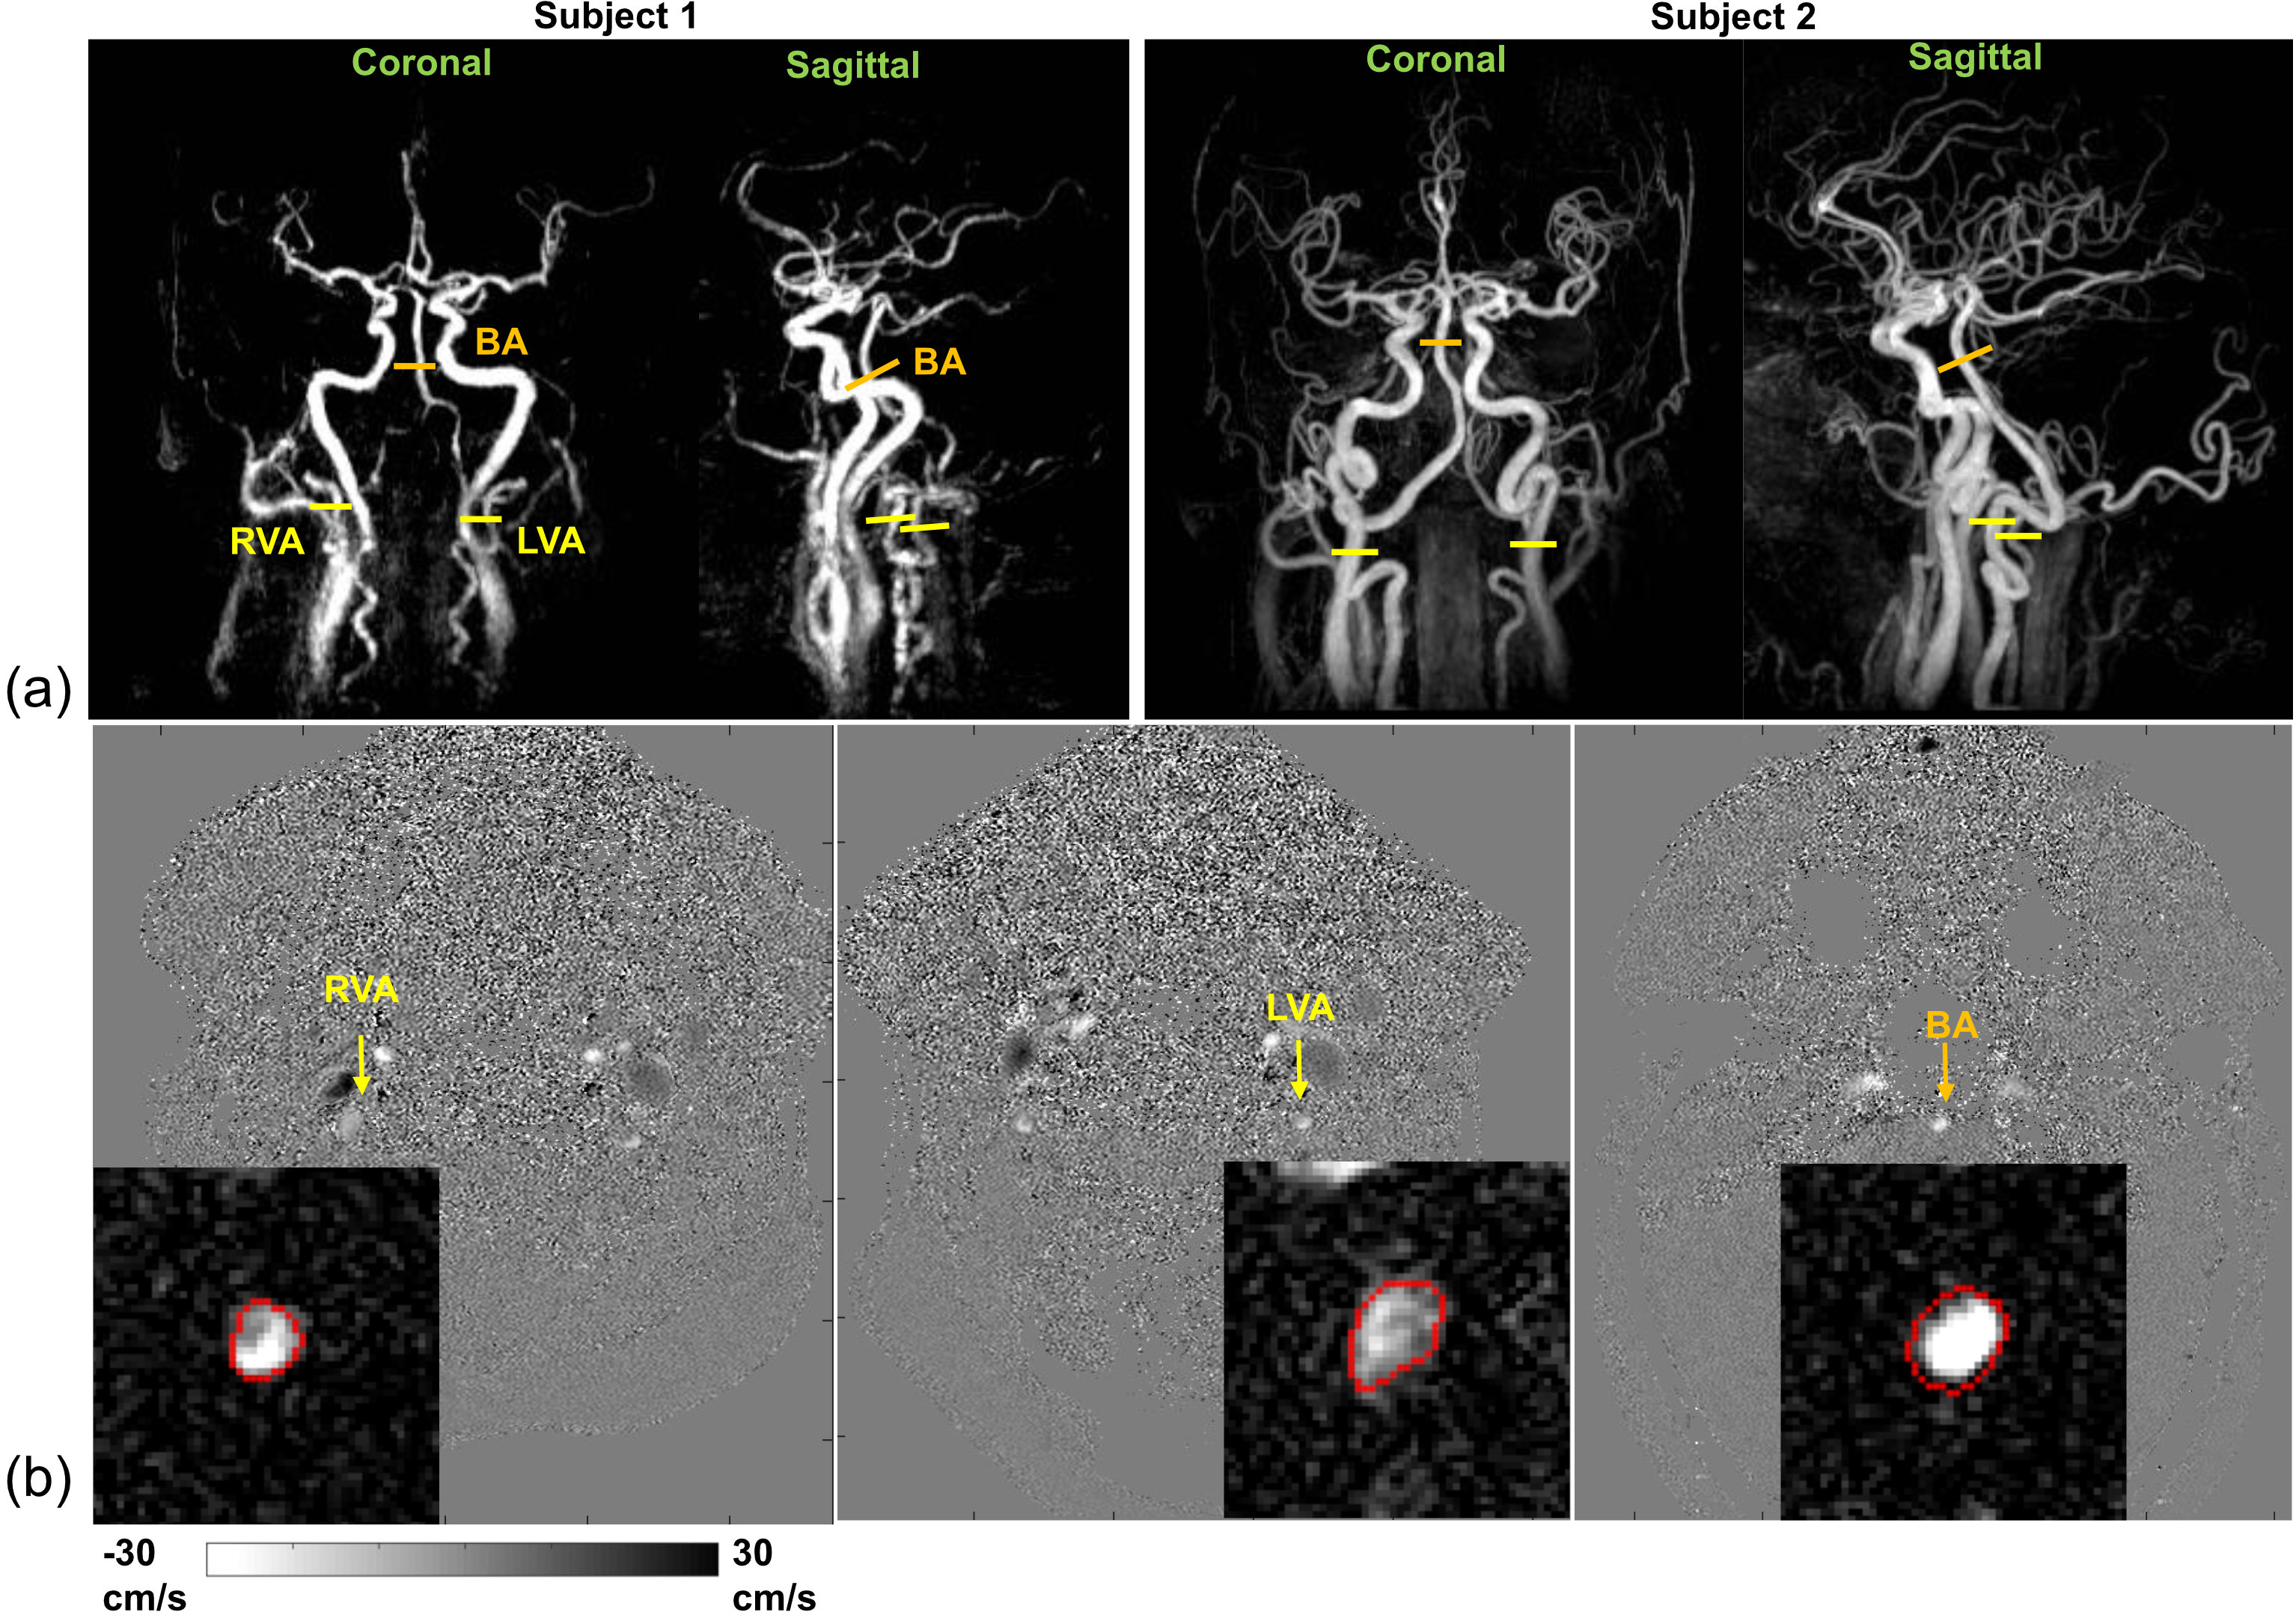
The flux (in units of mL/min) was obtained from the mean velocities of the vessel and the cross-sectional area (flux = mean velocity x area). The velocity map was calculated from the phase map of the PC MRI and given by the scanner. The area of each vessel was determined from the ROI manually drawn on the magnitude image which showed higher contrast than the velocity map (Fig.1b). Paired t-test was used to detect the difference in the mean and P < 0.05 was considered significant.
Results and Discussion
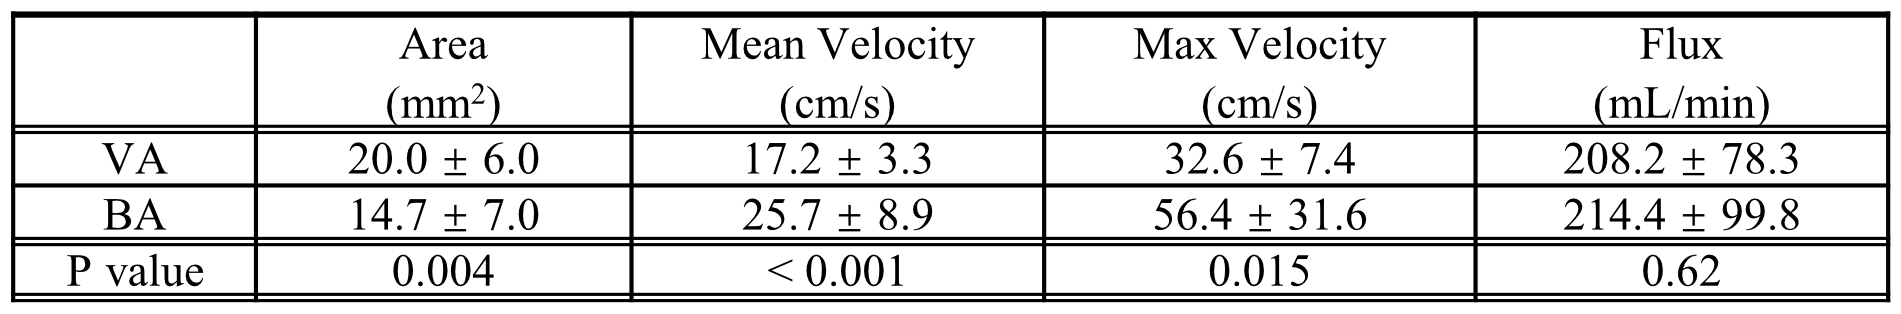
Figure 1a displays the maximum intensity projection (MIP) from the VS MRA on two representative subjects who have tortuous vessels at the neck. The imaging planes perpendicular to the bilateral VAs and the BA are shown in Figure 1a. Figures 1b shows the velocity maps and manual ROIs drawn on the magnitude image (zoomed in) and applied on the velocity map for each blood vessel.Table 1 lists the cross-sectional area, mean velocity, max velocity, and flux of the VA and BA. The results revealed a significantly smaller area (P = 0.04), significantly higher mean velocity (P < 0.001) as well as max velocity (P = 0.015) in BA than those in VA. Because the difference in velocity and area were in opposite directions, the total flux did not show a difference (P = 0.61).
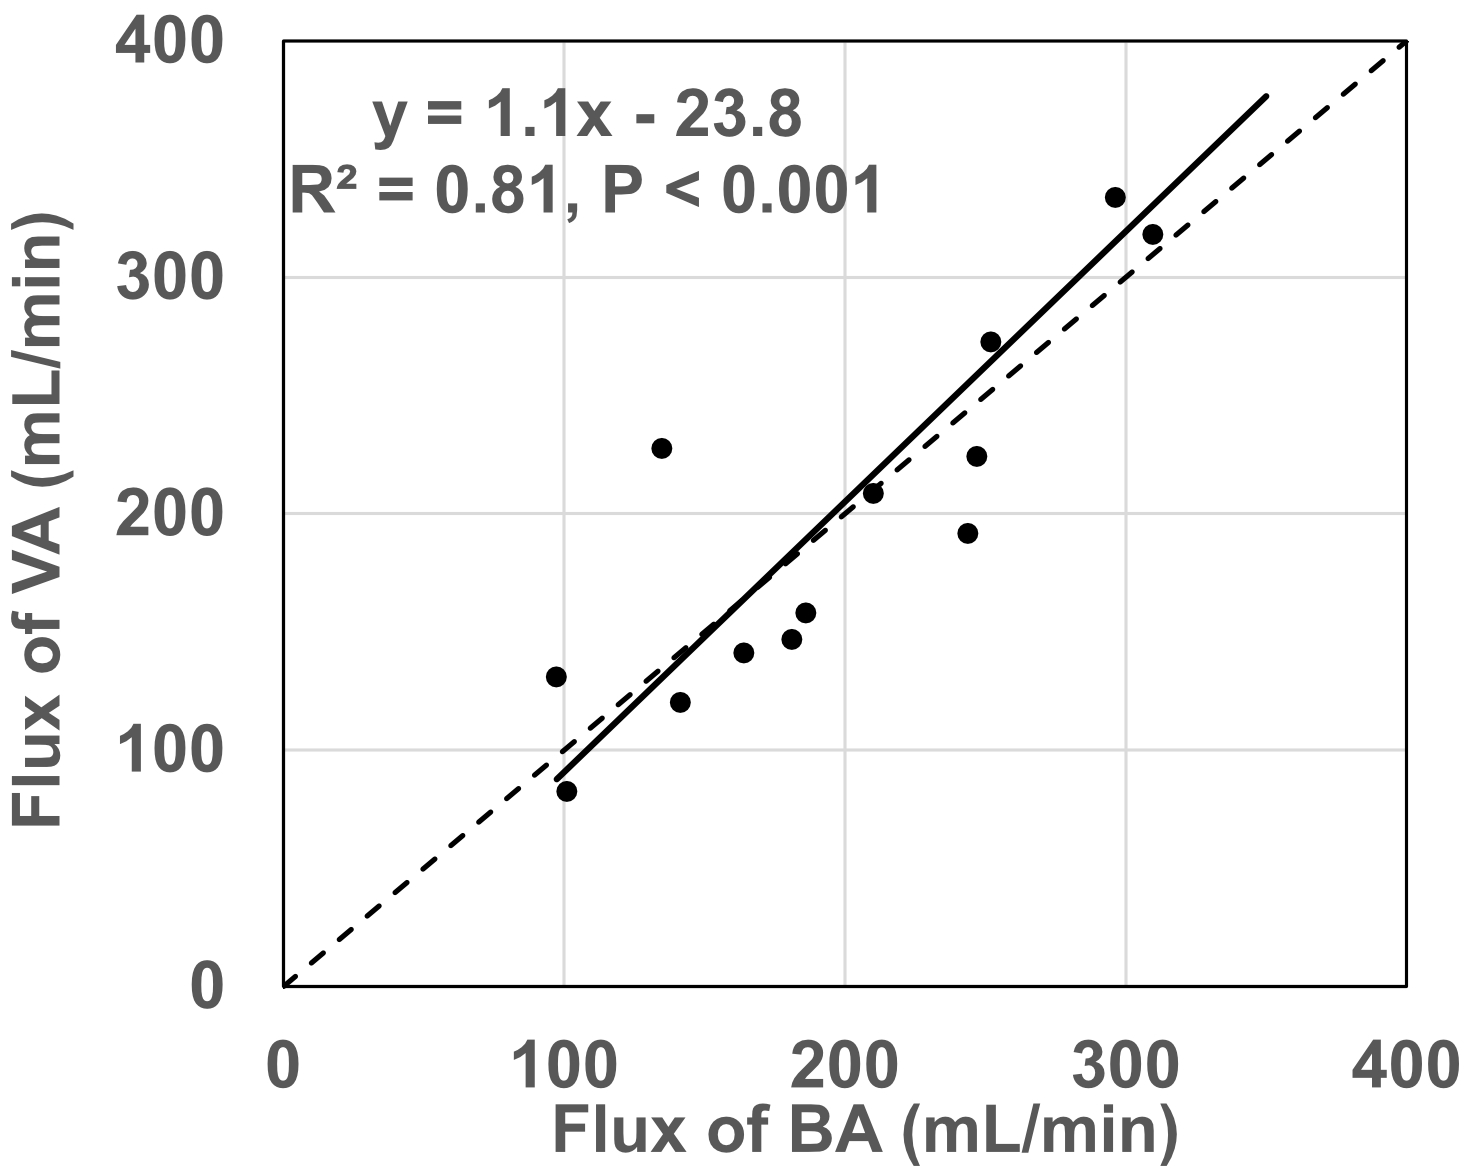
The scatter plot in Figure 2 demonstrates the excellent correlation between the flux of VA and BA. Pearson’s correlation coefficient was 0.9 with a P value < 0.01.
Hence, despite BA being located upstream of VA, the flux of the vessels that branch off from VA at the segment between the transverse foramen and the joint of the two VA at the base of the pon is negligible compared to the measurement error. Furthermore, although VA becomes relatively straight at the level below C4, that location is far from the center of the head coil and gradient coils, therefore, may suffer from a low signal-to-noise ratio.
Conclusion
As finding perpendicular planes to bilateral VAs separately at the segment between C2 and C1 is challenging, positioning the imaging plane at BA at the base of pon is a simpler choice with only half of the time for total flux measurement of posterior cerebral circulation.Acknowledgements
No acknowledgement found.References
1 Ishii Y, Thamm T, Guo J, Khalighi MM, Wardak M, Holley D et al. Simultaneous phase-contrast MRI and PET for noninvasive quantification of cerebral blood flow and reactivity in healthy subjects and patients with cerebrovascular disease. J Magn Reson Imaging 2020; 51: 183–194.
2 Bonekamp D, Degaonkar M, Barker PB. Quantitative cerebral blood flow in dynamic susceptibility contrast MRI using total cerebral flow from phase contrast magnetic resonance angiography. Magn Reson Med 2011; 66: 57–66.
3 Aslan S, Xu F, Wang PL, Uh J, Yezhuvath US, van Osch M et al. Estimation of labeling efficiency in pseudocontinuous arterial spin labeling. Magn Reson Med 2010; 63: 765–771.
4 Xu F, Ge Y, Lu H. Noninvasive quantification of whole-brain cerebral metabolic rate of oxygen (CMRO2) by MRI. Magn Reson Med 2009; 62: 141–148.
5 Xu F, Li W, Liu P, Hua J, Strouse JJ, Pekar JJ et al. Accounting for the role of hematocrit in between-subject variations of MRI-derived baseline cerebral hemodynamic parameters and functional BOLD responses. Hum Brain Mapp 2018; 39: 344–353.
6 Peng S-L, Su P, Wang F-N, Cao Y, Zhang R, Lu H et al. Optimization of phase-contrast MRI for the quantification of whole-brain cerebral blood flow. J Magn Reson Imaging 2015; 42: 1126–1133.
7 Liu P, Xu F, Lu H. Test-retest reproducibility of a rapid method to measure brain oxygen metabolism. Magn Reson Med 2013; 69: 675–681.
8 Qin Q, Shin T, Schär M, Guo H, Chen H, Qiao Y. Velocity-selective magnetization-prepared non-contrast-enhanced cerebral MR angiography at 3 Tesla: Improved immunity to B0/B1 inhomogeneity. Magn Reson Med 2016; 75: 1232–1241.
9 Li W, Xu F, Schär M, Liu J, Shin T, Zhao Y et al. Whole-brain arteriography and venography: Using improved velocity-selective saturation pulse trains. Magn Reson Med 2018; 79: 2014–2023.
Figures