2914
Resolution Dependency Study of Cerebral Blood Volume and Vessel Size Index1BME, UNIST, Ulsan, Korea, Republic of
Synopsis
Keywords: Data Analysis, Blood vessels
To obtain cerebral vasculature related information, various kinds of cerebrovascular magnetic resonance imaging (MRI) technique are being applied. However, it turned out that cerebral blood volume (CBV) and vessel size index (VSI) values differ depending on their spatial resolutions. To find an adjustment solution for this phenomenon, the resolution dependency must be confirmed in advance. Therefore, this study aims to investigate the resolution dependency of CBV and VSI through whole brain and region of interest based analysis. The results show that micro CBV and VSI values are resolution-dependent, while total CBV did not show any distinct patterns.Introduction
Non-invasive cerebral perfusion mapping is important for determining perfusion changes due to molecular and neuropathological modifications. Perfusion magnetic resonance imaging (MRI) provides quantitative information related to the cerebral vasculature non-invasively. In particular, cerebral blood volume (CBV) and vessel size index (VSI) are considered important physiological indicators in that they are used to evaluate abnormalities in tissue and vascular reactivity as well as the microvascular structure of tumors1. These measurements are known to depend on spatial resolution, but to the best of our knowledge they have not been systematically studied. Here, we investigate the resolution dependence of perfusion MRI measured using exogenous contrast agents. We compared rat CBV and VSI for three different spatial resolutions by region-by-region basis. The results of this study will be helpful in quantitatively analyzing the cerebral perfusion values measured at various spatial resolutions.Methods
Data acquisitionMRI datasets were acquired from 20 rats (Wistar, 210‒400 g, under 2.0‒1.5% isoflurane anesthesia) on a 7 T Bruker scanner. For ΔR2* and ΔR2 mapping, multi-echo gradient-echo (MGE) and multi-slice multi-echo (MSME) pulse sequence were performed before and after the contrast agent administration (300 µmol Fe/Kg of monocrystalline iron oxide nanoparticles (MION) were administered as an intravenous bolus injection). Three different in-plane resolution data (125, 250, and 500 µm2 in-plane resolutions with 1.5 mm slice thickness) were measured.
Determination of perfusion parameters
ΔR2* and ΔR2 maps were calculated by using the mono-exponential and decay equation with one fixed echo time (ΔR2*,ΔR2 = 1/TE · ln(DATApre/DATApost))2. ΔR2* and ΔR2 were normalized to the total CBV and micro CBV, and VSI was calculated by the proportional equation (VSI ≈ (ΔR2*/ΔR2)3/2) 3. CBV and VSI maps of each animal were then registered to the Waxholm Space (WHS) rat brain atlas4,5 via Advanced Normalization Tools (ANTs) registration software6. The co-registered CBV and VSI maps of 3 different resolutions were used for the whole brain and ROI analysis (cortex, corpus callosum, striatum, thalamus, and hippocampus). The declination of ΔR2* and ΔR2 due to washout of the contrast agent was corrected based on the general assumption that ΔR2* is linearly proportional to the tissue contrast agent concentration.
Results
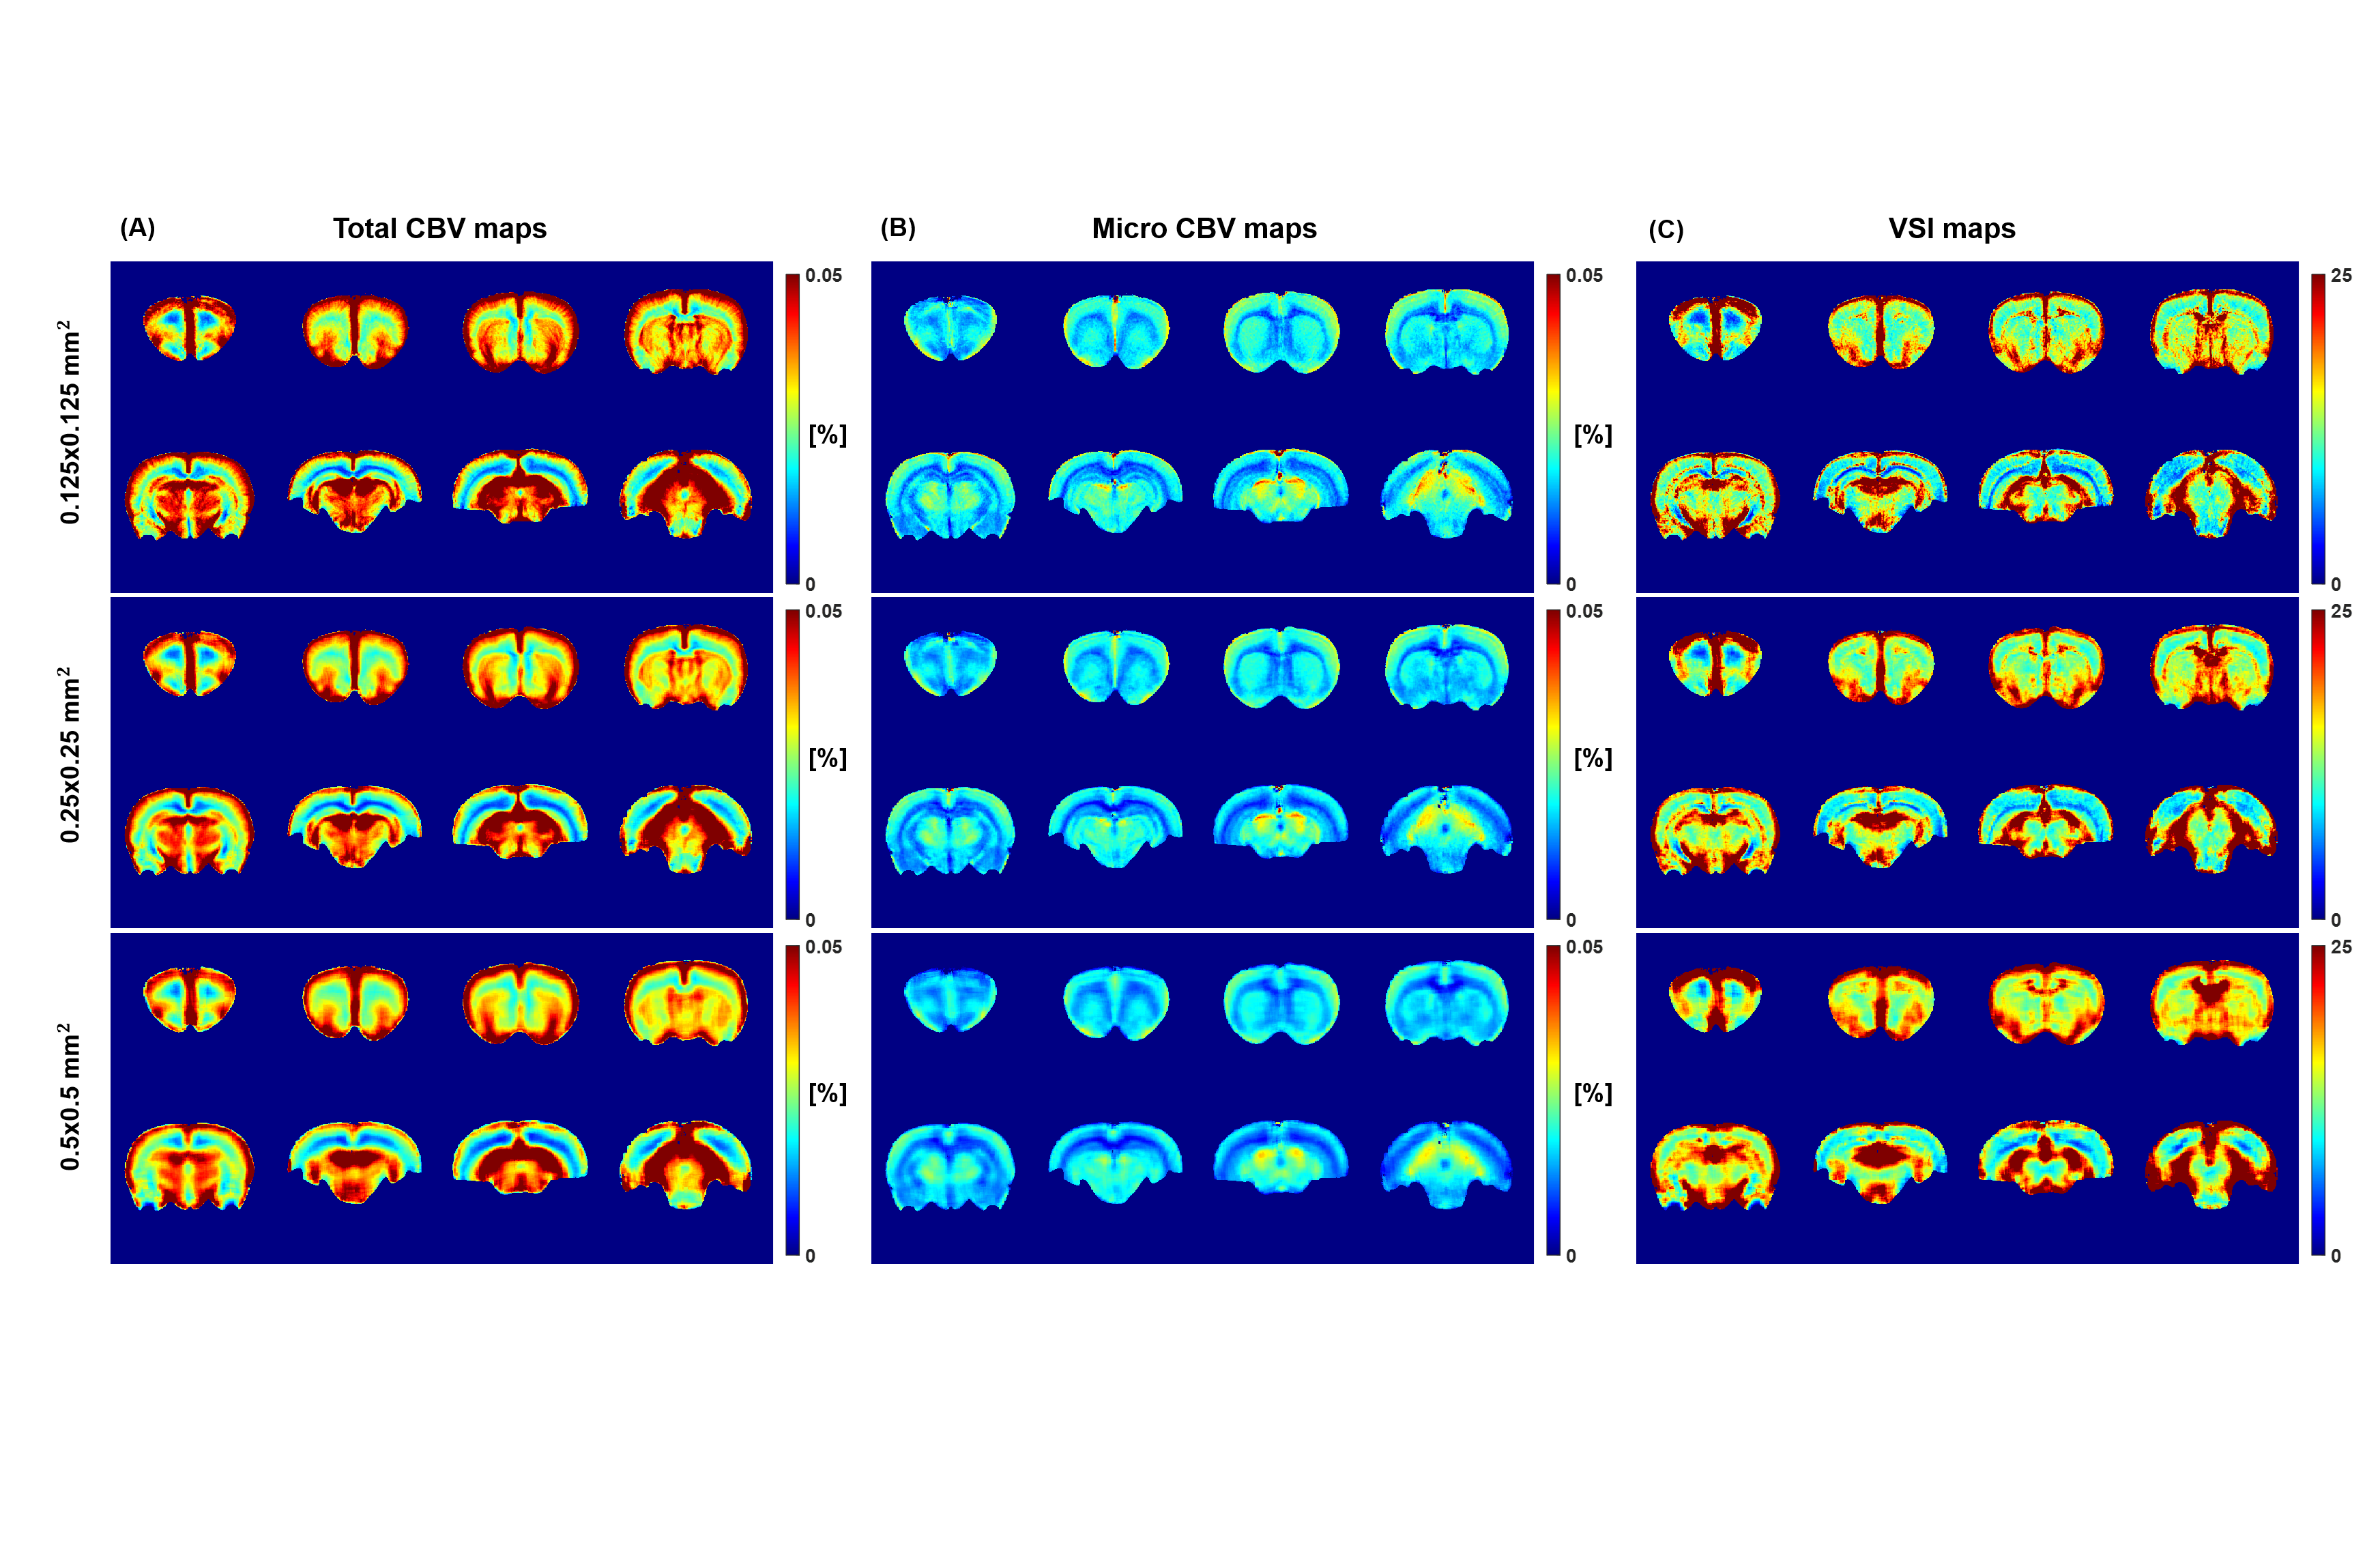
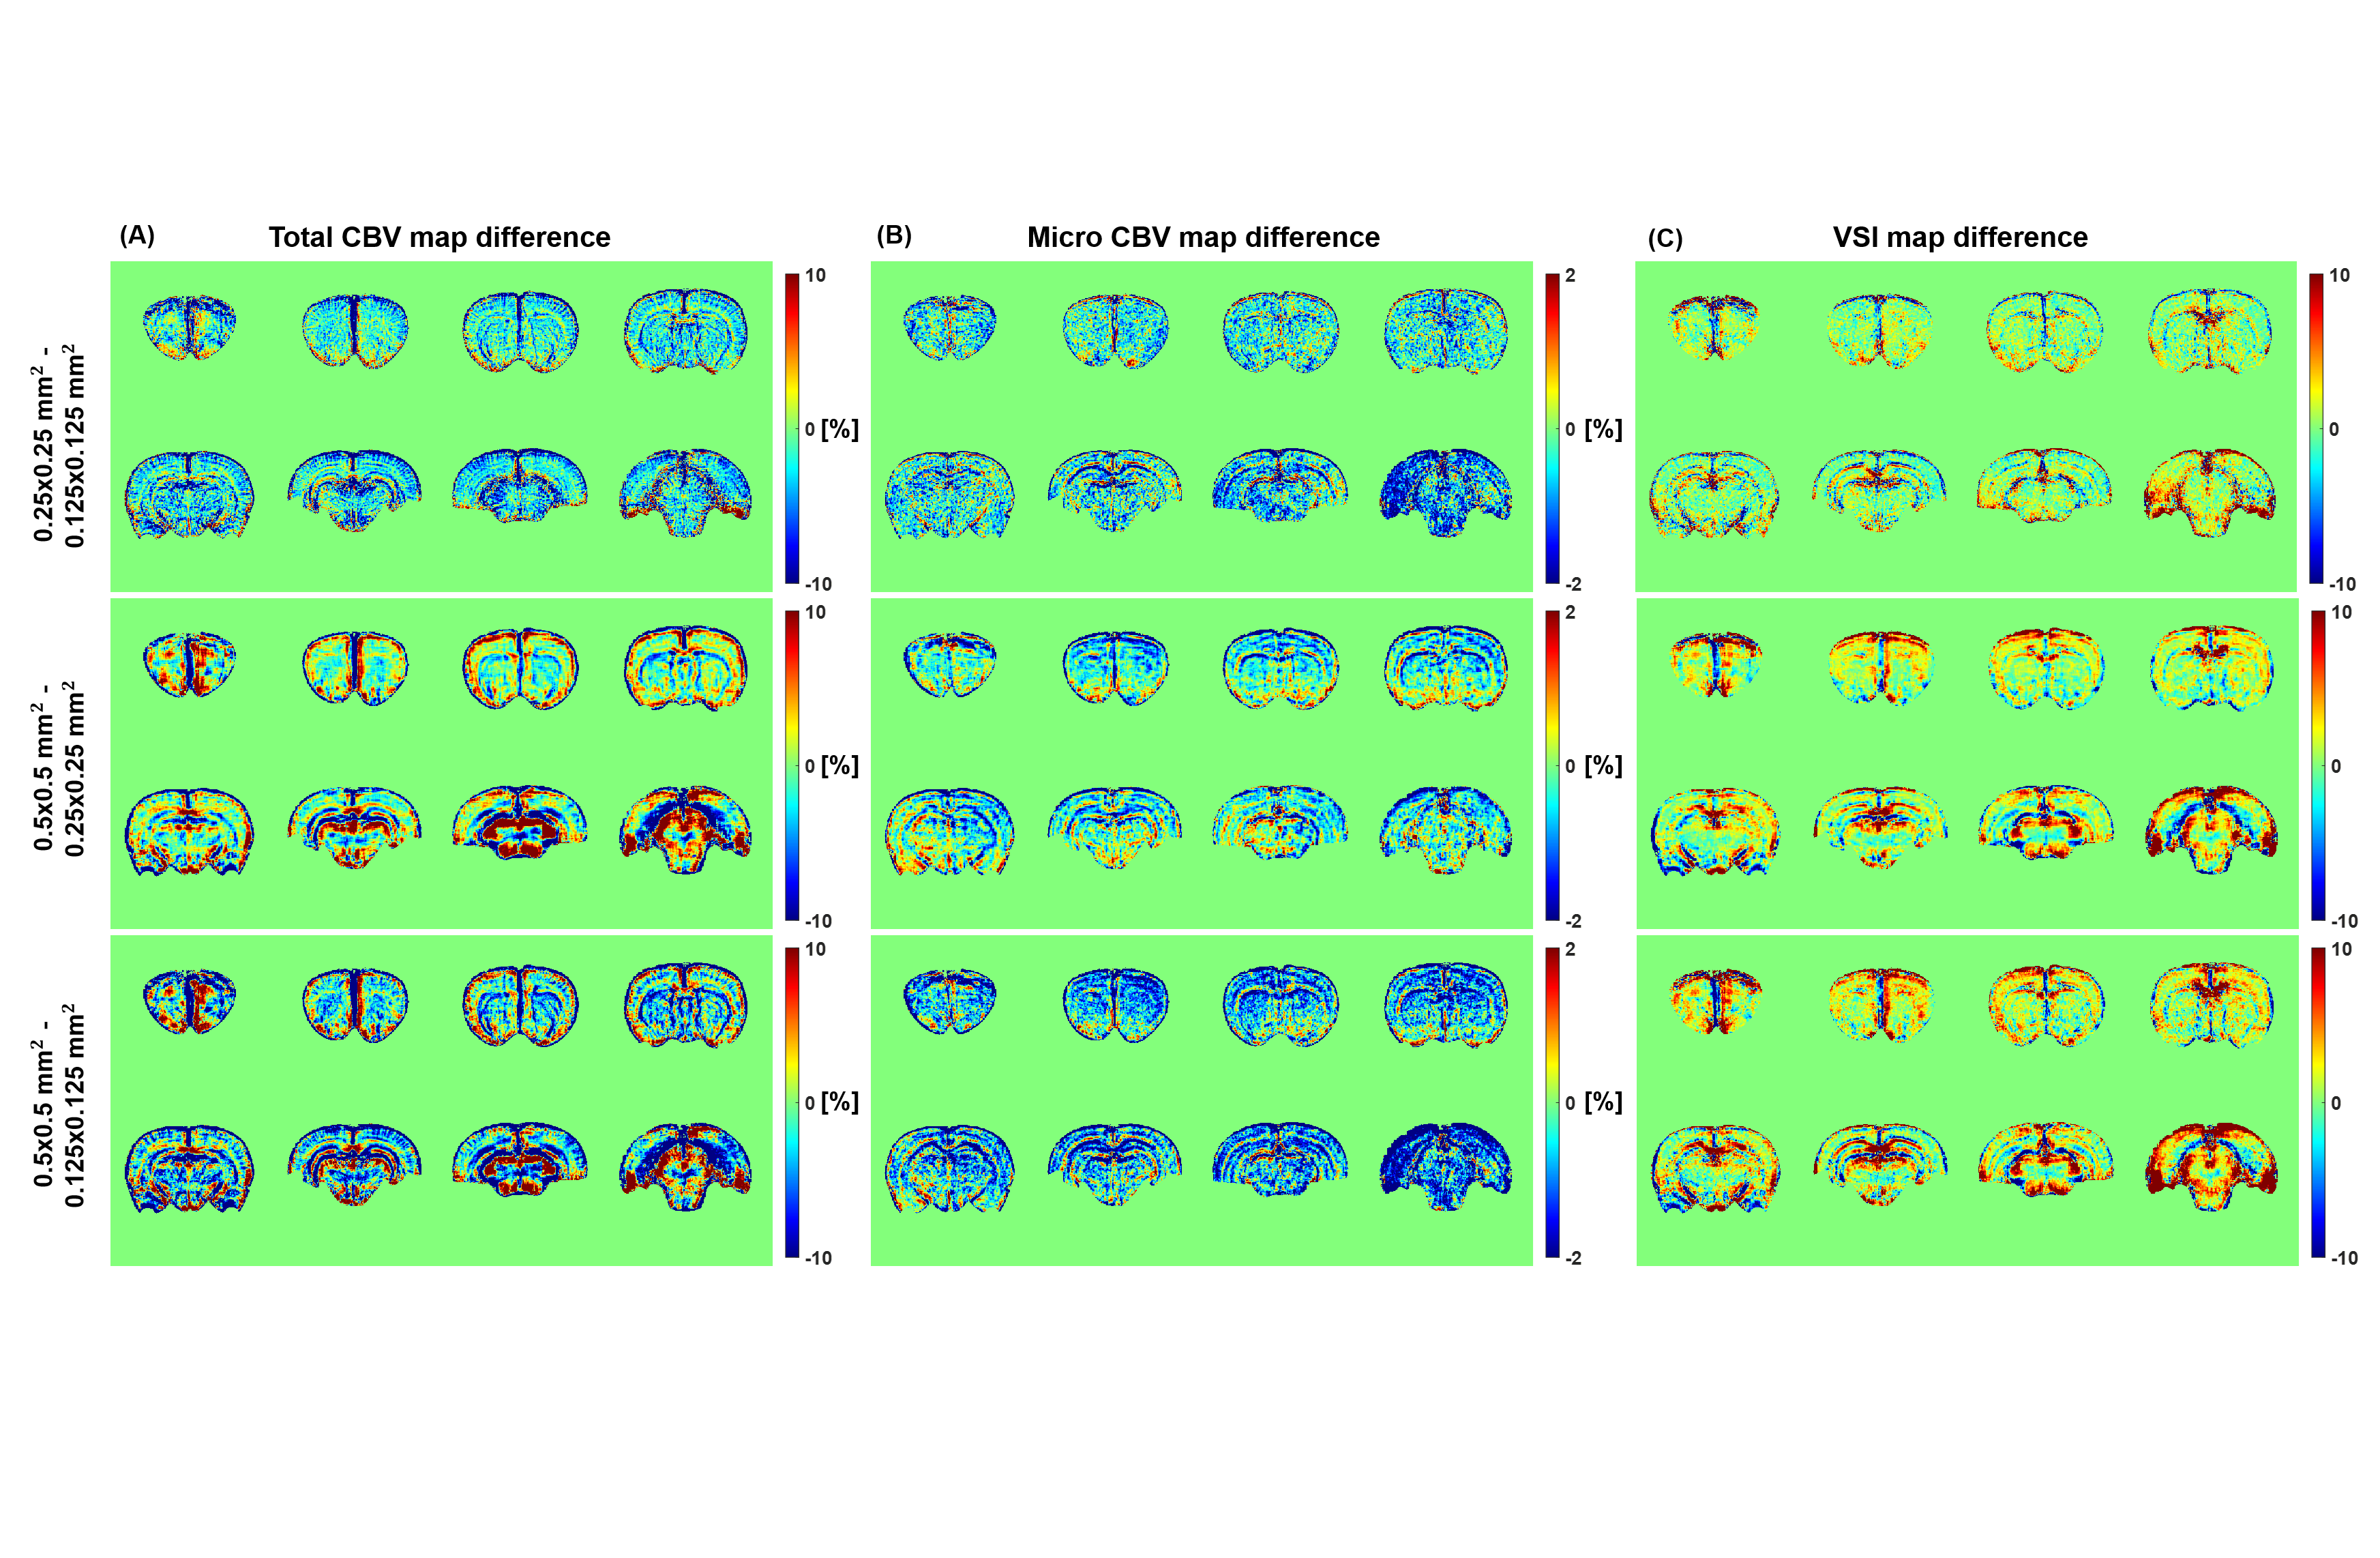
Figure 1 shows the voxel-wise mean total CBV, micro CBV, and VSI maps of twenty rats (n=20). Differences in perfusion values in cortical and white matter regions are clearly distinguished. The white matter corpus callosum showed low perfusion values, while some brain regions had high perfusion values possibly due to the high sensitivity of gradient-echo imaging to large vessels. In both total CBV and micro CBV maps, the lower the spatial resolution, the wider the area with the lower perfusion value at high resolution. On the other hand, in the VSI map, as the resolution decreased, regions with high values tended to spread.The difference map for each resolution is shown in Figure 2. In the difference map, positive values indicate that the CBV and VSI increase with decreasing resolution, and negative values indicate that the values decrease with decreasing resolution. Total CBV tended to decrease as the brain in-plain resolution decreased from 0.125 µm2 to 0.250 µm2. On the other hand, when the in-plane resolution was decreased from 0.125 µm2 to 0.500 µm2 and from 0.250 µm2 to 0.500 µm2, an increasing portion and a decreasing portion were mixed. As the in-plain resolution decreased, micro CBV showed a tendency to decrease overall in the brain, and VSI showed a tendency to increase overall.
Figure 3 shows the whole brain and selected ROIs (left side) and boxplot analysis results for the ROIs (right side). The Kruskal-Wallis test was used to calculate the p-value for each difference in the three resolution data. All p-values were close to 0, except for one case of total CBV in the thalamus, indicating that the change in the value according to the resolution change was statistically significant. The median of the total CBV showed a tendency to gradually decrease as the resolution decreased and showed a tendency to increase exceptionally in the corpus callosum region. The median value of micro CBV showed a tendency to decrease as the resolution decreased and decreased faster than the total CBV. As a result, the median value of VSI showed a tendency to increase as the resolution decreased in all ROIs.
Conclusion and discussion
In this study, the resolution dependence of total CBV (ΔR2*), micro CBV (ΔR2) and VSI (ΔR2*/ΔR2) maps was investigated. Both total CBV and micro-CBV (except for the corpus callosum) tended to decrease with decreasing resolution throughout the brain, with micro-CBV decreasing more rapidly. As a result, VSI showed a tendency to increase as the resolution decreased. This may be a result of changes in the distribution, angle, or other structural parameters of blood vessels within a voxel as the size of the imaged voxel increases as the resolution decreases. For further investigation, additional ROI analysis or Monte-Carlo simulations taking into account the vascular characteristics of the region will be required. Increasing the resolution of CBV and VSI using the deep learning network SRGAN (Super-Resolution Generative Adversarial Network)7 is effective in solving the resolution-dependent problem by correcting underestimated and overestimated values.Acknowledgements
This work was supported by the Korea Health Industry Development Institute by the 2019 Research Fund (HI18C0713).References
1. Kang, H-Y., et al. "Comparison of the effect of vessel size imaging and cerebral blood volume derived from perfusion MR imaging on glioma grading." American Journal of Neuroradiology 37.1 (2016): 51-57.
2. Tropres, Irene, et al. "Vessel size imaging." Magnetic Resonance in Medicine: An Official Journal of the International Society for Magnetic Resonance in Medicine 45.3 (2001): 397-408.
3. Kim, Seong‐Gi, et al. "Cerebral blood volume MRI with intravascular superparamagnetic iron oxide nanoparticles." NMR in Biomedicine 26.8 (2013): 949-962.
4. Waxholm Space Atlas of the Sprague Dawley Rat Brain (RRID:SCR_017124)
5. Papp, Eszter A., et al. "Waxholm Space atlas of the Sprague Dawley rat brain." Neuroimage 97 (2014): 374-386.
6. Sosa, Sebastian, et al. "A multilevel statistical toolkit to study animal social networks: The Animal Network Toolkit Software (ANTs) R package." Scientific reports 10.1 (2020): 1-8.
7. Ledig, Christian, et al. "Photo-realistic single image super-resolution using a generative adversarial network." Proceedings of the IEEE conference on computer vision and pattern recognition. 2017.
Figures