2912
MT-DICE for Simultaneous Quantification of Perfusion, Permeability, and Susceptibility1Department of Radiology, Keck School of Medicine, University of Southern California, Los Angeles, CA, United States, 2Department of Biomedical Engineering, University of Southern California, Los Angeles, CA, United States, 3Cedars-Sinai Medical Center, Los Angeles, CA, United States
Synopsis
Keywords: Quantitative Imaging, Permeability, perfusion, susceptibility
We have recently developed an MR MultiTasking based Dynamic Imaging for Cerebrovascular Evaluation (MT-DICE) technique that provides DCE- and leakage-corrected DSC-MRI parameters simultaneously with one scan and a single-dose contrast injection. This work further expanded the technique by incorporating quantitative susceptibility mapping. The refined technique was validated in healthy volunteers and patients, demonstrating the good agreement with reference methods.Introduction
Dynamic susceptibility contrast MRI (DSC-MRI) and dynamic contrast enhanced MRI (DCE-MRI) are commonly used for assessment of cerebrovascular perfusion and permeability hemodynamics, respectively (1,2). Evaluation of both perfusion and vascular permeability parameters is desirable for better risk stratification and prognosis. We have recently developed an MR MultiTasking based Dynamic Imaging for Cerebrovascular Evaluation (MT-DICE) technique for simultaneously acquiring DCE- and DSC-MRI data with a single-bolus injection in one scan (3). In this work, we expanded MT-DICE by incorporating flow compensation for deriving quantitative susceptibility mapping (QSM).Method
Sequence Design: MT-DICE employs a 3D Cartesian acquisition with periodic non-selective saturation recovery (SR) preparations followed by 50 continuous multi-echo FLASH readout segments. The high-temporal-resolution training data are collected every 4 readouts at the center encoding line, and the imaging data are randomly sampled with a variable-density Gaussian pattern. To avoid flow artifacts in vessels and nonlocal artifacts in susceptibility maps, a previously proposed flow compensation scheme are adopted.Imaging Framework: MT-DICE based on the MR multitasking framework (4) adopts a low-rank tensor image model for 6D whole-brain imaging with three spatial dimensions for T1,T2* quantification and capturing contrast kinetics. Specifically, the 6-dimensional image can be expressed as a low-rank tensor . The temporal factor tensor is first determined from the training data and the spatial coefficients are reconstructed by fitting to the imaging data , with undersampling pattern, spatial encoding model and regularization parameter for spatial total variation penalty.
$$\widehat{\mathbf{U}}_{\mathbf{r}}=\underset{\mathbf{U}_{\mathbf{r}}}{\operatorname{argmin}}\left\|\mathbf{d}-\Omega\left(\Phi \times_1 \mathbf{E U}_{\mathbf{r}}\right)\right\|_2^2+\lambda T V\left(\mathbf{U}_{\mathbf{r}}\right) $$
Multiparametric Analysis: Dynamic T1/T2* quantification can be performed according to the SR-FLASH signal equation:
$$\begin{aligned}S\left(A, \alpha, B, n, T E, T 1(t), T 2^*(t)\right) =A \frac{1-e^{-T R / T 1(t)}}{1-e^{-T R / T 1(t)} \cos \alpha}\left[1+(B-1)\left(e^{-T R / T 1(t)} \cos \alpha\right)^n\right] e^{-T E / T 2^*(t)} \sin \alpha\end{aligned}$$
The T1-based CA concentration was firstly calculated from dynamic T1 values. The results were used to assess DCE permeability metrics with the two-compartment extended Tofts model . The derived parameters were used to perform leakage correction to estimate DSC perfusion metrics based on a combined biophysical and pharmacokinetic method. Quantitative susceptibility map was computed with multi-echo images following 3D phase unwrapping, brain extraction, background field removal and field-to-susceptibility inversion (5). In addition, SWI and minimum intensity projection of SWI were also acquired.In vivo Study: 5 healthy volunteers and 1 patients with stroke are scanned. All MT-DICE datasets were collected on a 3T system (Vida, Siemens) with the following imaging parameters: FOV=220×220×120 mm3, spatial resolution=1.5×1.5×2.5 mm3, TR=22.27 ms, TEs=2.46//7.38/12.30/19.68 ms, SR period=temporal resolution=1.1s, FA=10°, total time=8.3 min. Gadavist (0.1 mmol/kg) was administered 1.5 min into the scan at the rate of 3.0 mL/s. Clinical SWI/DSC and 3D flow-compensated ME-GRE (for QSM mapping) were acquired as reference scans.
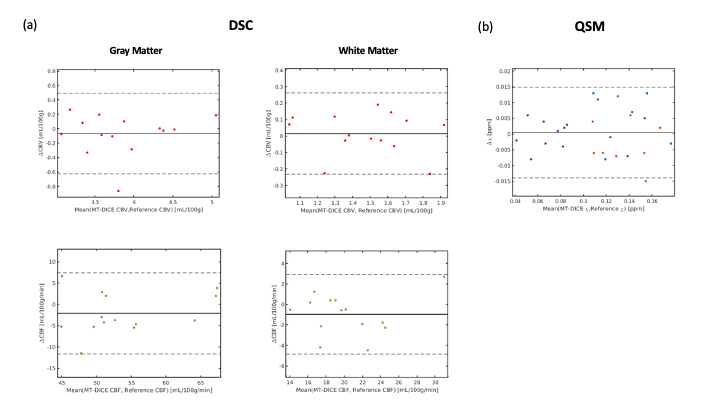
Image Analysis: MT-DICE maps were compared against reference maps to evaluate qualitative and quantitative agreement using Bland-Altman analysis and intra-class correlation coefficient (ICC). DSC metrics (CBV, CBF) were calculated within 10 ROIs (5 for white matter (WM) and 5 for gray matter (GM)), and susceptibility values were calculated.
Results
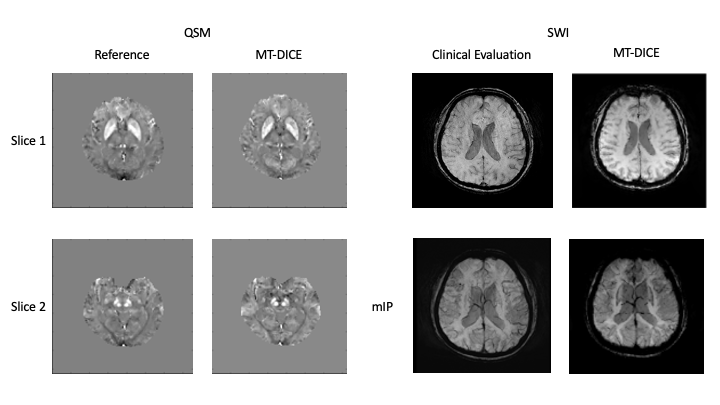
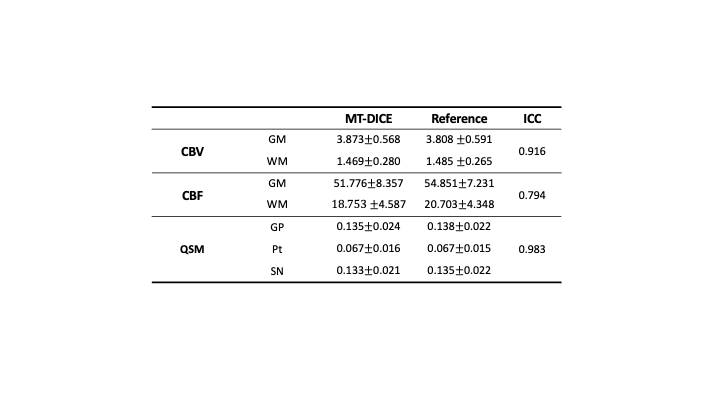
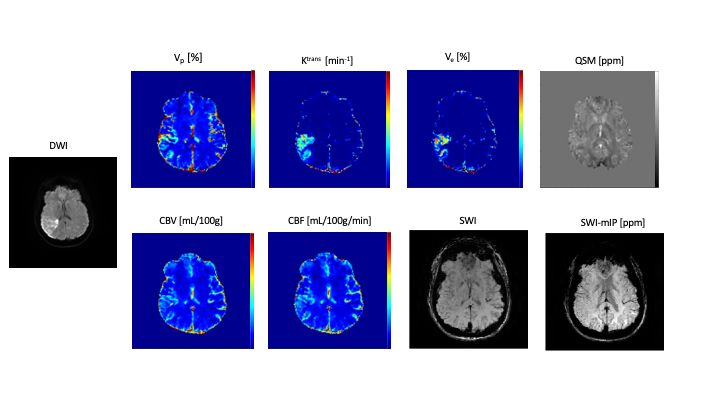
Deep GM structure can be clearly visualized in two slices of QSM maps shown in Figure 1. Both QSM and SWI maps generated from MT-DICE agreed with corresponding reference images. Bland-Altman analysis in Figure 2 showed small biases between MT-DICE and reference measurements. The results for DSC metric and susceptibility measurements are list in Table 1. Parameters measured from MT-DICE are in quantitative agreement with clinical standard DSC and reference QSM maps and all ICC are above 0.75. Figure 3 shows the permeability, perfusion, quantitative susceptibility map and susceptibility-weighted images of a stroke patient. The reduced visibility of cortical veins within the infarction core can be seen from QSM and SWI images.Discussion and Conclusion
In this work, we further expanded the capability of MT-DICE. With one 8-min scan and single-dose contrast injection, MT-DICE allows for simultaneous quantification of brain tissue perfusion, microvascular permeability, and tissue susceptibility. We observed excellent agreement in perfusion and susceptibility between MT-DICE and corresponding clinical reference. As a limitation, due to a need for additional visit, no comparison with conventional DCE imaging was performed. The comprehensive quantification may provide a more complete evaluation for the complex and heterogeneous brain lesion (infarcts, trauma, and tumors) microenvironment. Investigation in patient population is warranted.Acknowledgements
No acknowledgement found.References
1. Essig M, Nguyen TB, Shiroishi MS, Saake M, Provenzale JM, Enterline DS, Anzalone N, Dörfler A, Rovira À, Wintermark M. Perfusion MRI: the five most frequently asked clinical questions. American Journal of Roentgenology 2013;201(3):W495-W510.
2. Bergamino M, Bonzano L, Levrero F, Mancardi G, Roccatagliata L. A review of technical aspects of T1-weighted dynamic contrast-enhanced magnetic resonance imaging (DCE-MRI) in human brain tumors. Physica Medica 2014;30(6):635-643.
3. Hu Z, Christodoulou AG, Wang N, et al. MR multitasking-based dynamic imaging for cerebrovascular evaluation (MT-DICE): Simultaneous quantification of permeability and leakage-insensitive perfusion by dynamic T1/T2* mapping. Magnet Reson Med 2022 doi: 10.1002/mrm.29431.
4. Christodoulou AG, Shaw JL, Nguyen C, Yang Q, Xie Y, Wang N, Li D. Magnetic resonance multitasking for motion-resolved quantitative cardiovascular imaging. Nature biomedical engineering 2018;2(4):215-226.
5. Liu J, Liu T, Rochefort L de, et al. Morphology enabled dipole inversion for quantitative susceptibility mapping using structural consistency between the magnitude image and the susceptibility map. Neuroimage 2012;59:2560–2568 doi: 10.1016/j.neuroimage.2011.08.082.
Figures