2911
Identifying Brain Resting-state Networks from Arterial Spin Labeling with Spectral Clustering1Computer Science, Binghamton University, Vestal, NY, United States, 2Mathematical Sciences, Binghamton University, Vestal, NY, United States, 3Department of Radiology, Beth Israel Deaconess Medical Center and Harvard Medical School, Boston, MA, United States
Synopsis
Keywords: Data Analysis, fMRI (resting state), network detection
We propose a spectral clustering algorithm (SCA) based on the Pearson correlation metric (SCA-PC) to identify large-scale brain networks in arterial spin labeling (ASL) images. It was shown to be more robust to Gaussian distributed noise sources based on simulations. We studied the robustness of SCA-PC vs. the traditional SCA method based on a Euclidean distance metric (SCA-ED) for deriving resting-state networks from real human fMRI data. Our results indicate that SCA-PC can derive better brain networks from ASL data than traditional SCA-ED.Introduction
Functional magnetic resonance imaging (fMRI) has revealed several well-known resting-state brain networks. Three methods, seed-based correlation analysis (SBA) 1, independent component analysis (ICA) 2, and the spectral clustering algorithm (SCA) 3, have been used to detect these brain networks. However, several brain network templates that are accessible from the public domain (e.g., 4,5,6) have very large discrepancies, motivating us to consider the robustness of those methods in separating brain networks when physiological noise is present. We have shown previously that the SCA method had great potential for separating brain networks and ranking the non-neural noise after neural networks from ASL fMRI data 7. The traditional SCA method performs clustering based on the Euclidean distance metric (SCA-ED). We propose a new SCA method based on the Pearson correlation metric (SCA-PC), which we have found to be more robust to Gaussian-distributed noises based on simulations. However, physiological noise and motion from human fMRI scans may not follow the assumed Gaussian distributions. Here, we compared the robustness of SCA-PC vs. SCA-ED for deriving resting-state networks from real human Arterial Spin Labeling (ASL) fMRI data.Theory
The SCA is based on spectral graph theory 3. The SCA uses the pairwise correlation matrix from all brain voxels, performs the eigenvalue decomposition on the correlation matrix, and calculates a low-dimensional representation for the brain voxels 8. The traditional SCA-ED method uses Euclidean distance as the metric for k-mean clustering on the spectral space. Although Euclidean distance is often the preferred measure for k-means, k-means clustering using Euclidean distance as a clustering metric may distort the locations of the cluster centroids when the noise distribution is unknown or a large number of nodes are quasi-equidistant from the centroids. Our simulation showed that SCA-PC is more robust to angular noise in the spectral space. The signs of eigenvectors from eigenvalue decomposition can be random (either positive or negative). However, they can affect the quality of k-means clustering for the SCA-PC method. We selected the sign of each eigenvector based on the major energy direction 9.Methods
We studied the performance of SCA-PC and SCA-ED methods on resting-state ASL 10 (40 image time series), previously acquired from 20 healthy subjects (8 females/12 males, 22–38 years old 30.3 4.6) 11. ASL and axial T1-weighted magnetization prepared rapid gradient echo (MPRAGE) images were collected using a GE 3T scanner. Images were motion corrected and registered to the standard MNI space using SPM8. We scaled each subject’s image time series by the same factor so that the global mean from each subject is the same. All subjects’ data were then temporally concatenated to form a 2D matrix (temporal dimension × spatial dimension), and each voxel was z-score normalized. Both SCA-ED and SCA-PC methods were applied, producing K-many clusters. Ground-truth networks were derived from a previous study of BOLD data for the same subjects 11. Fluctuations from global brain, white matter, CSF regions, and 6-parameter rigid body motion were regressed out. To better evaluate the quality of the networks extracted by the SCA algorithms, two sets of ground-truth networks were used for the analysis. One set of ground-truth networks was obtained from SBA (GT-1). Seed locations were taken from the literature 12,13,14. For each subject, Pearson correlation maps were calculated for seven seed locations – Default Mode (DMN), Sensory Motor (SMN), Left and Right Laterals (LLN and RLN), Dorsal Attention Network (DAN), Medial Visual (MVN) and Lateral Visual (LVN) networks – and then z-transformed. These networks were derived with a voxel-level significance of p < 10-4 and cluster size > 100. Another set of ground-truth networks was obtained from the application of traditional SCA (GT-2), where we found strong agreement between SCA-PC and SCA-ED on nuisance-regressed BOLD data. Overlap percentages with the ground-truth networks were calculated by the ratio of the overlapped volume to the ground-truth volume.Results & Discussion
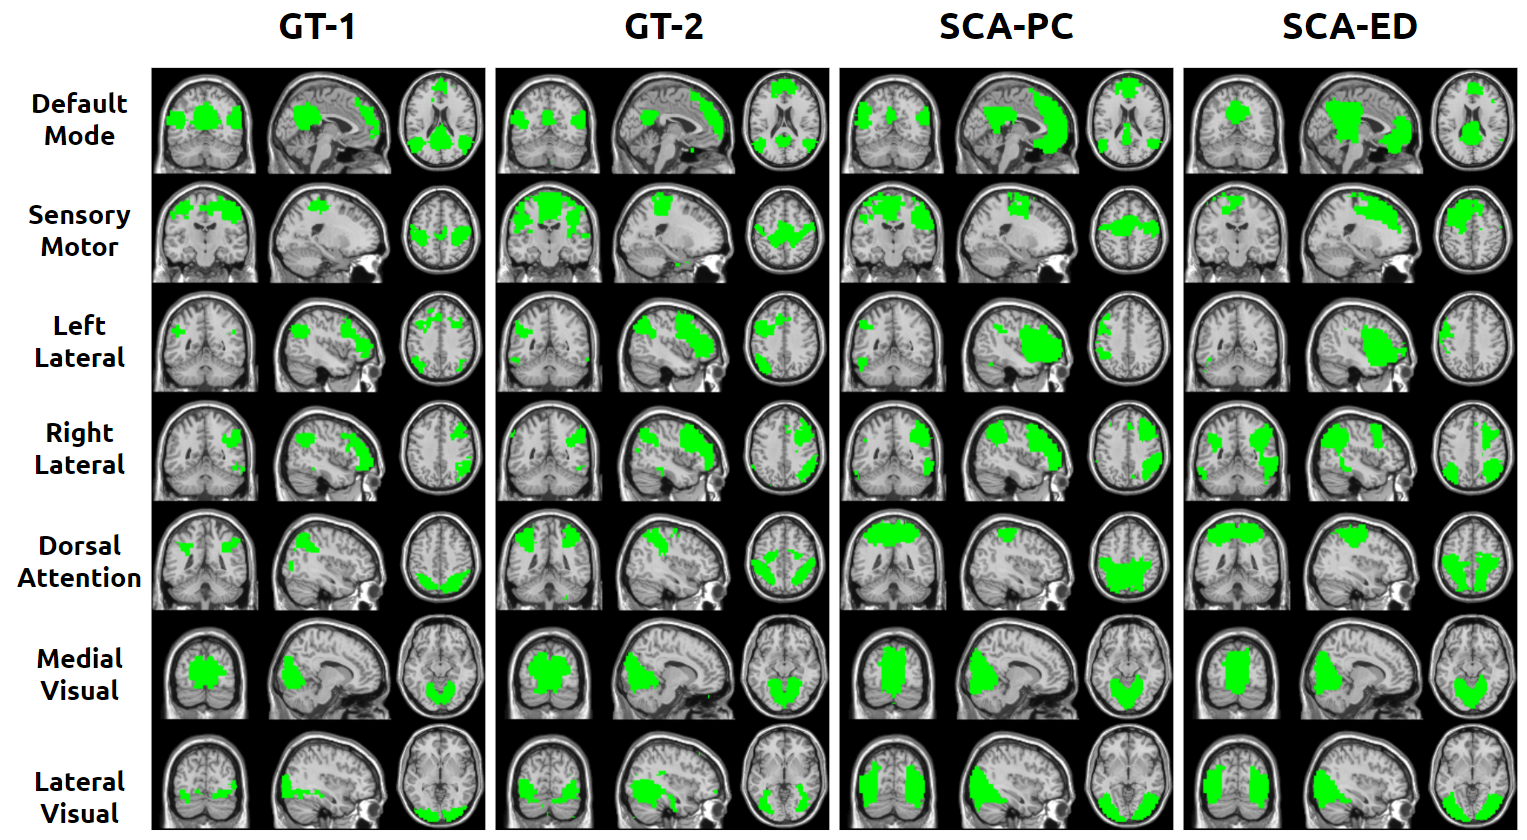
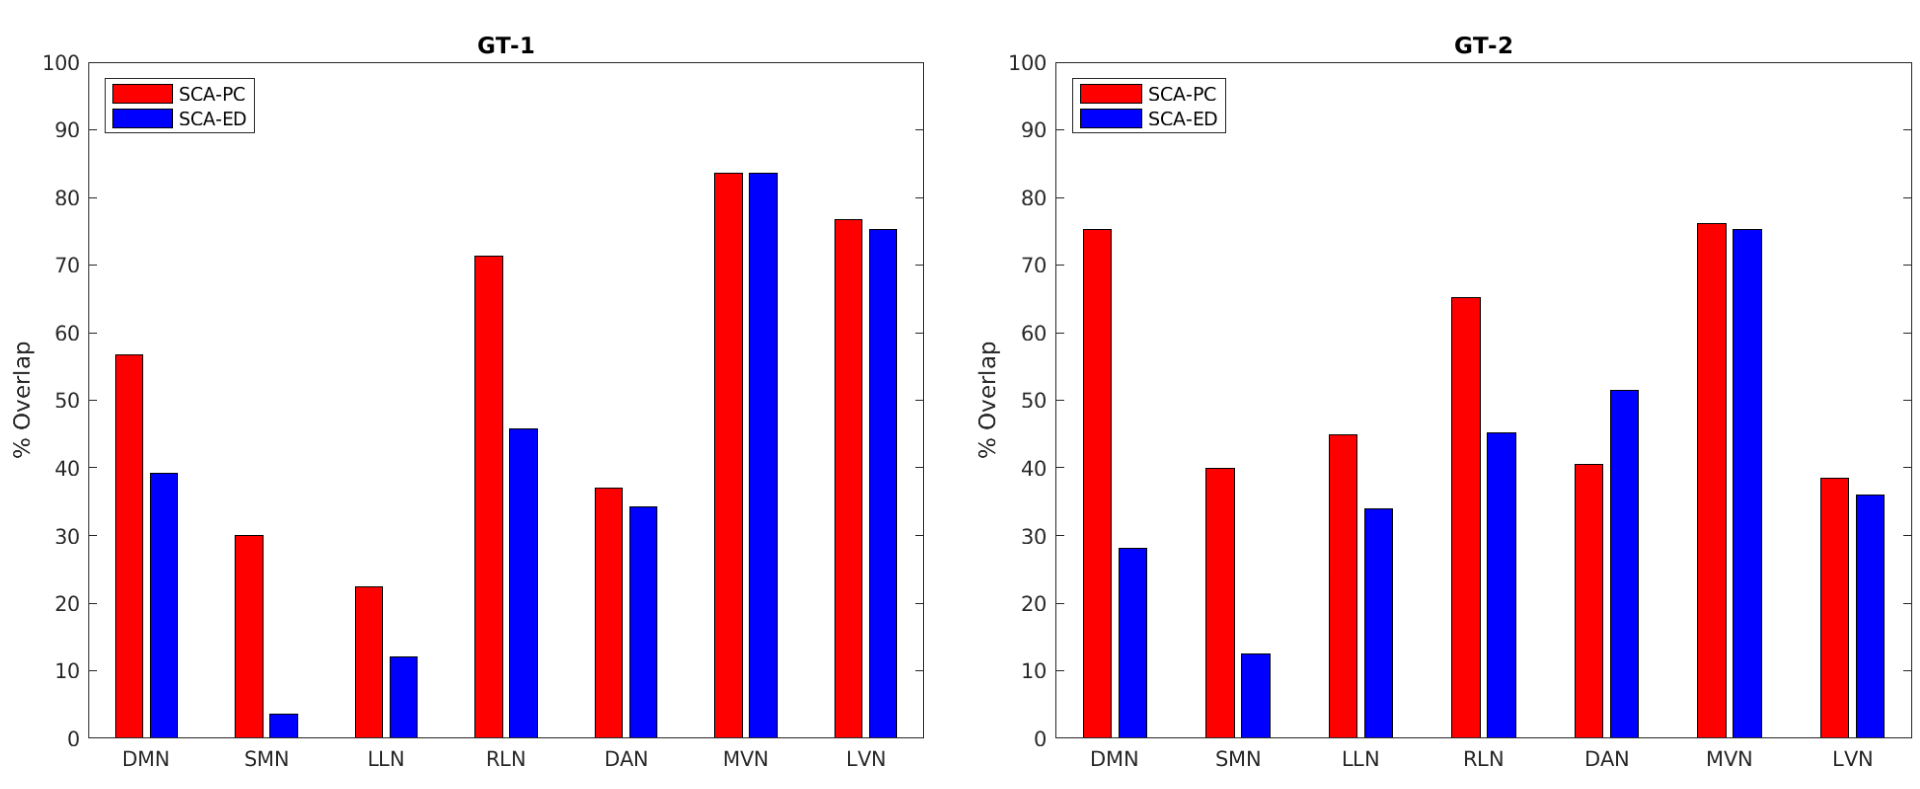
For ASL, K = 15 was chosen to achieve the optimal performance in deriving the brain networks. Visual (Fig. 1) and quantitative results in the form of ground-truth overlap percentages (Fig. 2) were generated. SCA-ED failed to retrieve the left and right posterior lateral sections of the Default Mode network that were successfully obtained by SCA-PC (Fig 1). SCA-PC also retrieved the Sensory Motor Network, which SCA-ED did not recover. The network chosen as the sensory motor for SCA-ED was determined quantitatively by selecting the network sharing the largest volume overlap with the corresponding network of GT-2. With GT-1 as the ground-truth, SCA-PC had better overlap percentages with the ground-truth networks than SCA-ED across all networks(53.98% ± 24.36% vs. 41.95% ± 25.65%, respectively). With GT-2 as the ground-truth, SCA-PC had better overlap percentages with the ground-truth networks than SCA-ED in all but one network (54.34% ± 17.22% vs. 40.32% ± 19.8%, respectively). Both sets of ground-truth networks showed a stronger agreement overall with SCA-PC than SCA-ED, indicating SCA-PC’s potential as a better spectral clustering algorithm for functional connectivity detection in resting-state ASL than SCA-ED.Acknowledgements
No acknowledgement found.References
1. Biswal B, Yetkin FZ, Haughton VM, and Hyde JS, Functional connectivity in the motor cortex of resting human brain using echo-planar MRI. Magn Reson Med, 1995;34(4):537-41.
2. Beckmann CF and Smith SM, Probabilistic independent component analysis for functional magnetic resonance imaging. IEEE Trans Med Imaging, 2004;23(2):137-52.
3. Chung F, Spectral Graph Theory. CBMS Conference Board of the Mathematical Sciences, 1997;92.
4. Shirer WR, Ryali S, Rykhlevskaia E, Menon V, and Greicius MD, Decoding subject-driven cognitive states with whole-brain connectivity patterns. Cereb Cortex, 2011, 22(1):158-65.
5. Smith SM, Fox PT, Miller KL, Glahn DC, Fox PM, Mackay CE, Filippini N, Watkins KE, Toro R, Laird AR, and Beckmann CF. Correspondence of the brain's functional architecture during activation and rest. Proc Natl Acad Sci USA (PNAS), 2009, 106(31):13040-45.
6 Laird AR, Fox PM, Eickhoff SB, Turner JA, Ray KL, McKay DR, Glahn DC, Beckmann CF, Smith SM, and Fox PT. Behavioral interpretations of intrinsic connectivity networks. Journal of Cognitive Neuroscience, 2011, 23(12): 4022-37.
7. Barrett J, Meng H, Zhang Z, Chen S, Zhao L, Alsop D, Qiao X, and Dai W. Resting-state Brain Networks using Spectral Clustering Analysis. Proc. Intl. Soc. Mag. Reson. Med. 2018.
8. Ng A, Jordan M, and Weiss Y, On spectral clustering: Analysis and an algorithm, Adv. Neural Inf. Process. Syst, 2002;14.
9. Bro R, Acar E, and Kolda TG, Resolving the sign ambiguity in the singular value decomposition., Journal of Chemometrics, 2008;22(2):135-40.
10. Dai W, Garcia D, de Bazelaire C, and Alsop DC, Continuous flow-driven inversion for arterial spin labeling using pulsed radio frequency and gradient fields. Magn Reson Med, 2008;60(6):1488-97.
11. Dai W, Varma G, Scheidegger R, and Alsop DC, Quantifying fluctuations of resting state networks using arterial spin labeling perfusion MRI. J Cereb Blood Flow Metab, 2016;36(3):463-73.
12. Song X, Panych LP, and Chen NK, Data-driven and predefined roi-based quantifi-cation of long-term resting-state fmri reproducibility, Brain Connectivity, 2016; 6(2):136–51.
13. Androulakis XM, Krebs K, Peterlin BL, Zhang T, Maleki N, Sen S, Rorden C,and Herath P, Modulation of intrinsic resting-state fmri networks in women withchronic migraine, Neurology, vol. 89, no. 2, pp. 163–169, 2017.
14. Adriaanse S, Binnewijzend M, Ossenkoppele R, Tijms B, Flier WVD, Wink AM, Scheltens P, Berckel BV, and Barkhof F, Widespread disruption of functional brainorganization in early-onset alzheimers disease patients, Alzheimers & Dementia, 9(4), 2013.
Figures