2910
Combined Parkinson’s Disease Related Patterns using ASL MRI and FDG PET1College of Biomedical Engineering & Instrument Science, Zhejiang University, Zhejiang, China, 2PET Center & National Center for Neurological Disorders & National Clinical Research Center for Aging and Medicine, Huashan Hospital, Fudan University, Shanghai, China, 3Department of Computer Science, State University of New York at Binghamton, Binghamton, NY, United States, 4GE Healthcare, Shanghai, China, 5Radiology, Beth Israel Deaconess Medical Center and Harvard Medical school,, Bostom, MA, United States
Synopsis
Keywords: Data Analysis, Parkinson's Disease, Parkinson's disease-related pattern (PDRP), multimodality
Parkinson's disease-related patterns (PDRPs) of metabolism and perfusion have been reported to reflect brain abnormalities in Parkinson’s disease (PD). However, differences between the glucose metabolism PDRP derived using FDG-PET and the perfusion PDRP derived using ASL have not been compared directly in the same patient cohort. In this work, PDRPs were compared using PET and ASL images of 43 PD patients and 28 health controls using Scaled Subprofile Model analysis. In addition, a new method was proposed to build a multi-modality pattern. Our primary results showed that combined metabolism-perfusion PDRP resulted in superior accuracy than ASL- and PET-derived PDRP alone.Introduction
Parkinson's disease (PD) involves dopaminergic neuron loss 1, which results in abnormal brain perfusion and metabolism 2. [18F]-fluorodeoxyglucose positron emission tomography (FDG-PET) has confirmed the brain metabolic-related pattern of PD 3. Because of the radioactive tracer and the high cost of FDG-PET, arterial spin labeling (ASL), a non-invasive and safe MRI perfusion imaging method, has been used as an alternative to investigate the PD-related perfusion pattern 4, 5. However, the differences between ASL- and PET-derived patterns and their sensitivities have not yet been directly compared. In this work, we sought to investigate Parkinson's disease related patterns of metabolism, perfusion, and combined metabolism-perfusion.Methods
ASL and FDG-PET images were collected in 43 PD (59.9 ± 6.5 years old, 42.9% male) and 28 age- and sex-matched HC (61.8 ± 7.4 years old, 65.1% male).MR images were acquired on a 3T GE Discovery MR750 scanner. Cerebral blood flow (CBF) was measured by pseudo-continuous ASL imaging (labeling duration = 1450 ms, postlabeling delay = 2025 ms, TE = 10.5 ms, TR = 4844 ms, field of view = 250 mm, slice thickness = 4 mm). Brain metabolic images were acquired by PET imaging using a Siemens Biograph 64 HD PET/CT (Inject dose = 150 - 200 MBq, Time duration = 45 - 55 min, voxel size = 2.036 × 2.036 × 1.5).
CBF maps were calculated using the Buxton model 6, 7 from ASL images. The gray matter image was segmented from the T1-weighted MRI image and it was coregistered with the CBF map using SPM12. The registrated CBF map was transferred to the standard MNI space. The PET image was transferred to the MNI space seperately. A gray matter mask was built by thresholding ASL and PET images at a level of 35% maximum signal on 10 PD and 10 HC subjects. All subjects' data were log-transformed and double-centered.
For individual pattern of metabolism and perfusion, principal components of imaging data were selected to represent PDRP using the Scaled Subprofile Model (SSM) method 3, respectively. For the combined metabolism-perfusion pattern, the principal components which are significantly different (p < 0.05) between PD and HC groups were selected based on PET and ASL images, separately. The selected components of PET and ASL were combined in a linear model and optimal weights were decided by the logistic regression with the lowest Akaike information criterion (AIC). The score of each subject was calculated by the above model and then z-transformed.
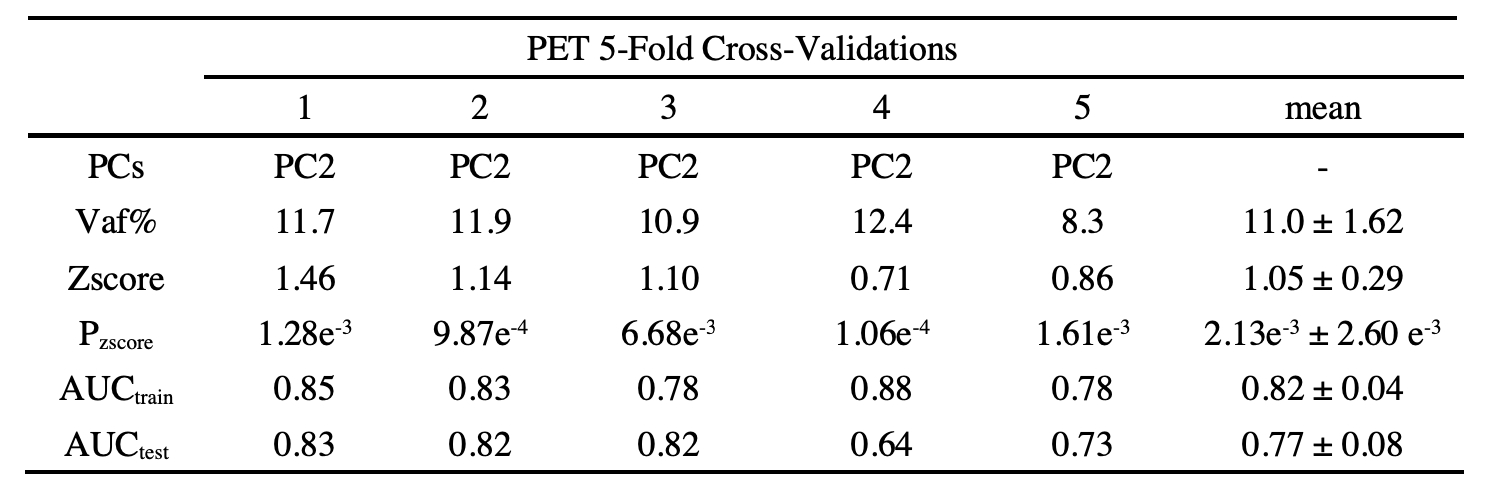
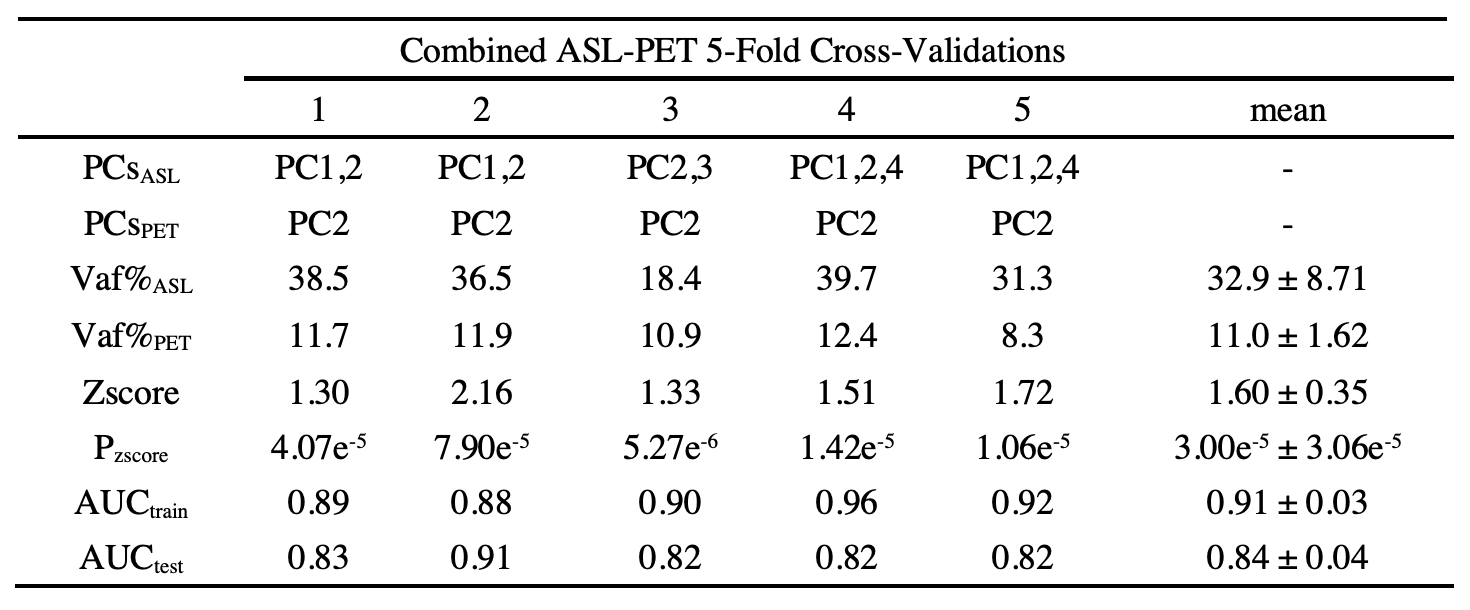
Five-fold cross-validations were performed to test the performance of each pattern. A final pattern and model were provided by including all the data.
Results
There were no significant differences in age (p = 0.104) and gender (p = 0.276) between the PD and HC. The perfusion PDRP based on ASL images is shown in Fig.1a. The PDRP network consisted of a linear combination of PC1 (vaf = 19.8%, β = 1.06, p = 0.003), PC2 (vaf = 12.7%, β = 1.09, p = 0.002) and PC4 (vaf = 4.8%, β = 1.28, p = 0.017). The metabolic PDRP based on FDG-PET images is shown in Fig. 1b, in which PC2 (vaf = 11.0%, β = 1.43, p = 0.001) and PC3 (vaf = 6.5%, β = 1.13, p = 0.011) were selected.The PC1 (vaf = 19.8%, β = 0.83, p = 0.009), PC2 (vaf = 12.7%, β = 0.80, p = 0.017), and PC4 (vaf = 4.8%, β = 1.31, p = 0.009) selected in ASL data and PC2 (vaf=11.0%, β = 1.32, p = 0.023) selected in FDG-PET data were combined to form the metabolism-perfusion fusion PDRP Fig. 1c.
The PET-derived pattern and ASL-derived pattern were consistent with previous work 3, 4. Both PDRPs showed the patterns with increased CBF/metabolism (red) in the deep grey matter and with decreased CBF/metabolism (blue) in the occipital regions. However, FDG-PET PDRP had a more symmetric pattern for the occipital and deep gray matter regions and higher metabolism in the cerebellum region, compared to the ASL PDRP.
The performance of each pattern is listed in Table 1, 2 and 3. In addition, the means of z-scores between HC and PD were more distinguishable in combined PDRP (HC = -2.62e-16 ± 1.00, PD = 3.58 ± 2.61, p = 2.83e-09), followed by ASL-derived PDRP (HC = -1.53e-16 ± 0.99, PD = 2.80 ± 2.16, p = 2.22e-08) and PET-derived PDRP (HC = -2.71e-16 ± 1.00, PD = 2.39 ± 2.40, p = 5.64e-06). These results were confirmed further by the AUC in Fig. 2 (combined PDRP = 0.93, ASL PRDP = 0.89, PET PDRP = 0.86) and the average AUC in the five-fold cross-validations (combined PDRP = 0.839, ASL-derived PDRP = 0.732, PET-derived PDRP = 0.767).
Discussion
In this study, ASL- and PET-based PDRPs were compared and a novel combined pattern was proposed. The multimodal metabolism-perfusion PDRP resulted in higher AUCs and AUCs in the 5-fold cross-validations with lower p-values. The combined pattern may be related to the severe regions affected by both CBF and metabolism in PD and therefore it resulted in a higher accuracy, which may help with the PD diagnosis and the understanding of its pathology.Acknowledgements
This work is supported in part by the Alzheimer's Association through AARF-18-566347, the MOE Frontier Science Center for Brain Science & Brain-Machine Integration, Zhejiang University, Zhejiang Provincial Natural Science Foundation of China under Grant No. LGJ22H180004 , 2020R01003, and 2022C03057, Alibaba Cloud, PET Center & National Center for Neurological Disorders & National Clinical Research Center for Aging and Medicine, Huashan Hospital, Fudan University.References
[1] Tolosa, E., Wenning, G., Poewe, W.. Lancet Neurol. 5, 75–86, 2006.
[2] Vander Borght T, Minoshima S, Giordani B,et al. J Nucl Med 1997; 38:797–802.
[3] Phoebe G. Spetsieris, Yilong Ma, Vijay Dhawan, David Eidelberg. NeuroImage,2009; 45:1241-1252.
[4] Melzer TR, Watts R, MacAskill MR, et al. Brain, 2011;134:845-55.
[5] Ma Y, Huang C, Dyke J P, et al. Journal of Cerebral Blood Flow & Metabolism, 2010, 30(3): 505-509.
[6] Buxton R B, Frank L R, Wong E C, et al. Magnetic resonance in medicine, 1998; 40: 383-396.
[7] Alsop D C, Detre J A, Golay X, et al. Magnetic resonance in medicine, 2015, 73(1): 102-116.
Figures
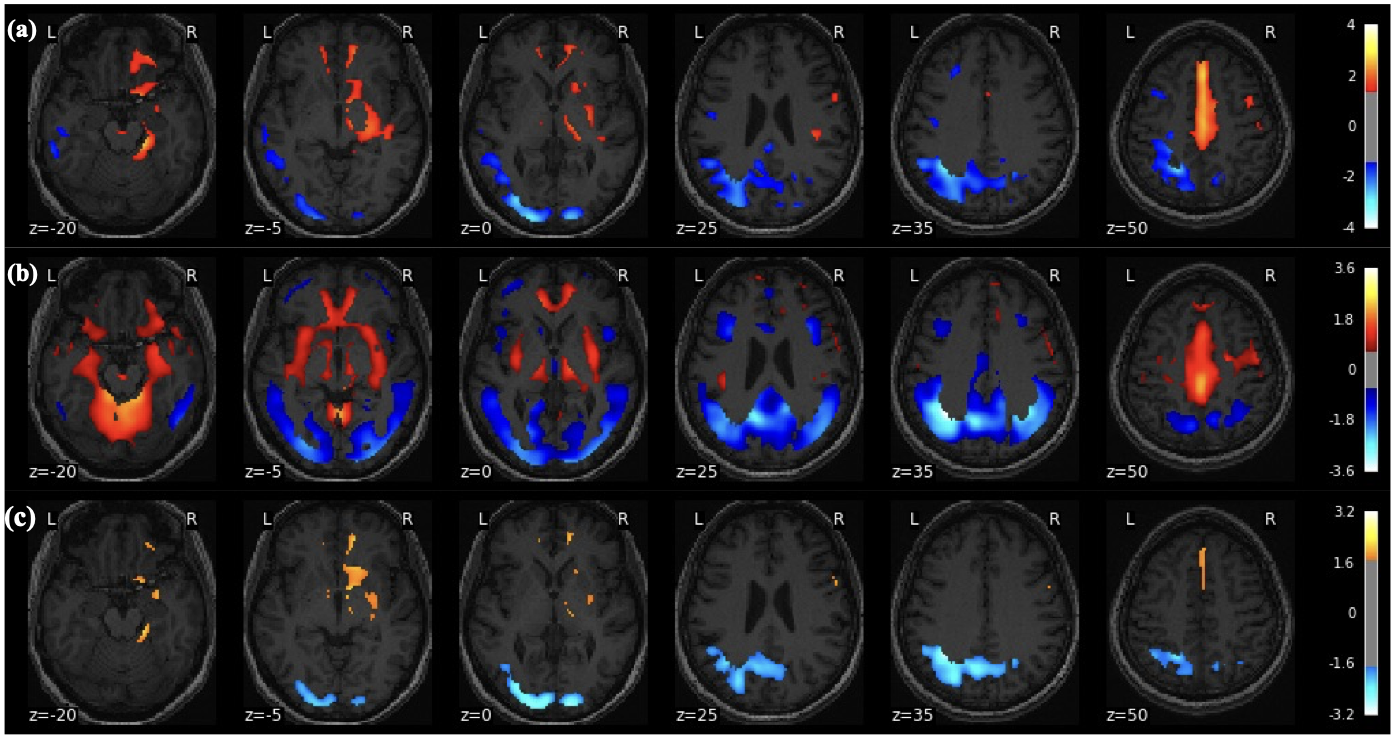
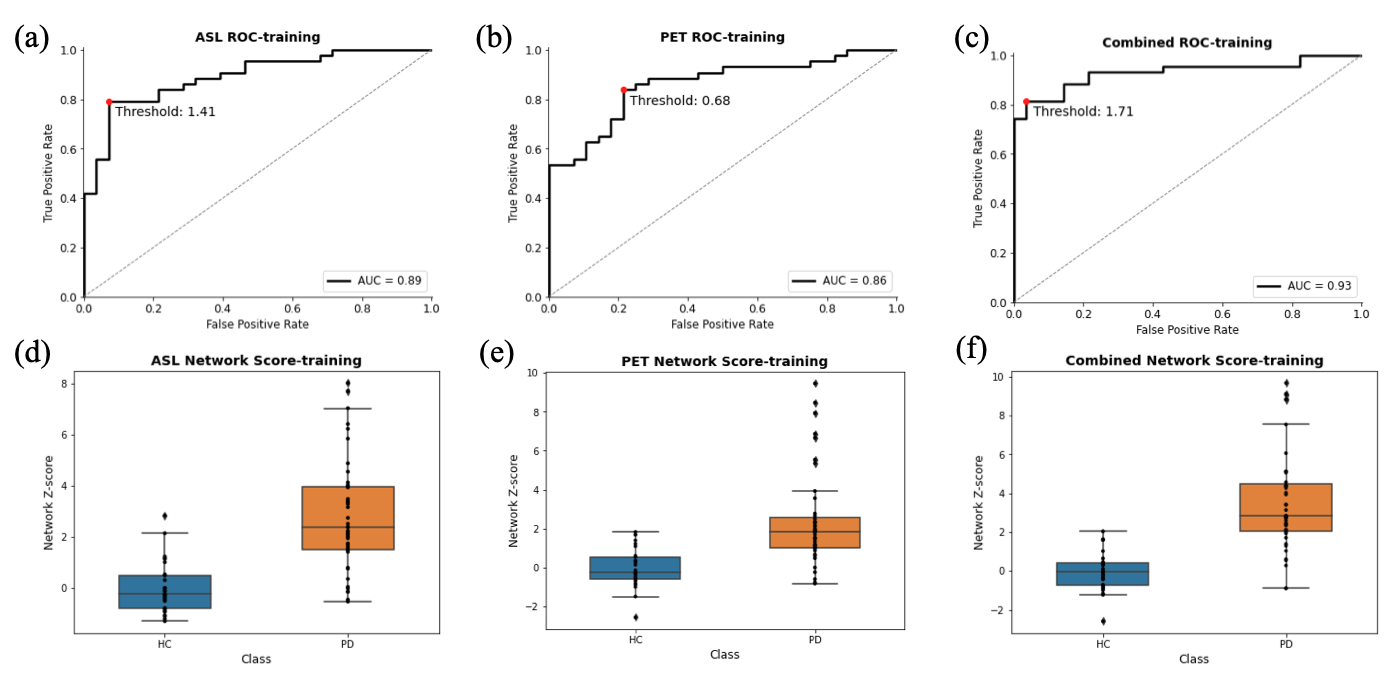
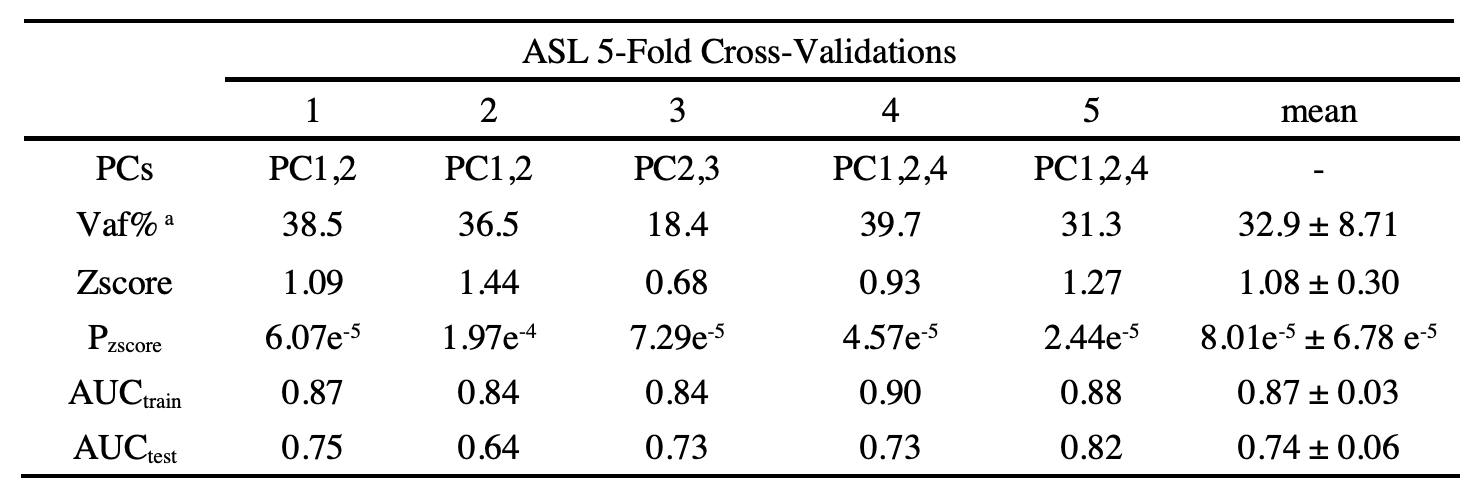
Table 1. ASL 5-Fold Cross-Validations Results
a Total explained variance of selected PCs