2909
A novel Fourier-based perspective to analyze and compensate for corruption in arterial spin labeling MRI1Department of Bio and Brain Engineering, Korea Advanced Institute of Science and Technology, Daejeon, Korea, Republic of
Synopsis
Keywords: Data Processing, Arterial spin labelling
A new perspective in Fourier domain to understand the ASL signal and compensate for corruption artifacts is proposed. The averaged perfusion-subtraction image corresponds to a single frequency component and the other frequency components could be interpreted as non-perfusion signals. In this viewpoint, the multiple corruptions could be compensated by finding the optimal perfusion frequency component to minimize the zigzag amplitude in the non-perfusion signals. The proposed compensation reduced the corruption without eliminating any measured data, preserving SNR. This new perspective would open up the possibility of processing the ASL signal in the Fourier domain rather than the time domain.INTRODUCTION
Arterial spin labeling (ASL)1 is a non-invasive perfusion imaging technique, which constructs the perfusion-weighted images by subtraction between control and label images. The inflowing blood acts as endogenous tracer after magnetic RF labeling. Because of the low SNR, multiple pairs of label and control images are required for averaging. Therefore, some artifacts such as corruption can be induced in the multiple measurements. Since the subtraction cannot eliminate contributions of these abrupt changes, the outlier measurements have been discriminated and eliminated2,3, leading to degradation of SNR, especially when there are multiple corruptions. Therefore, this abstract proposes a corruption compensation method without eliminating the measurements in a new viewpoint of Fourier analysis.THEORY
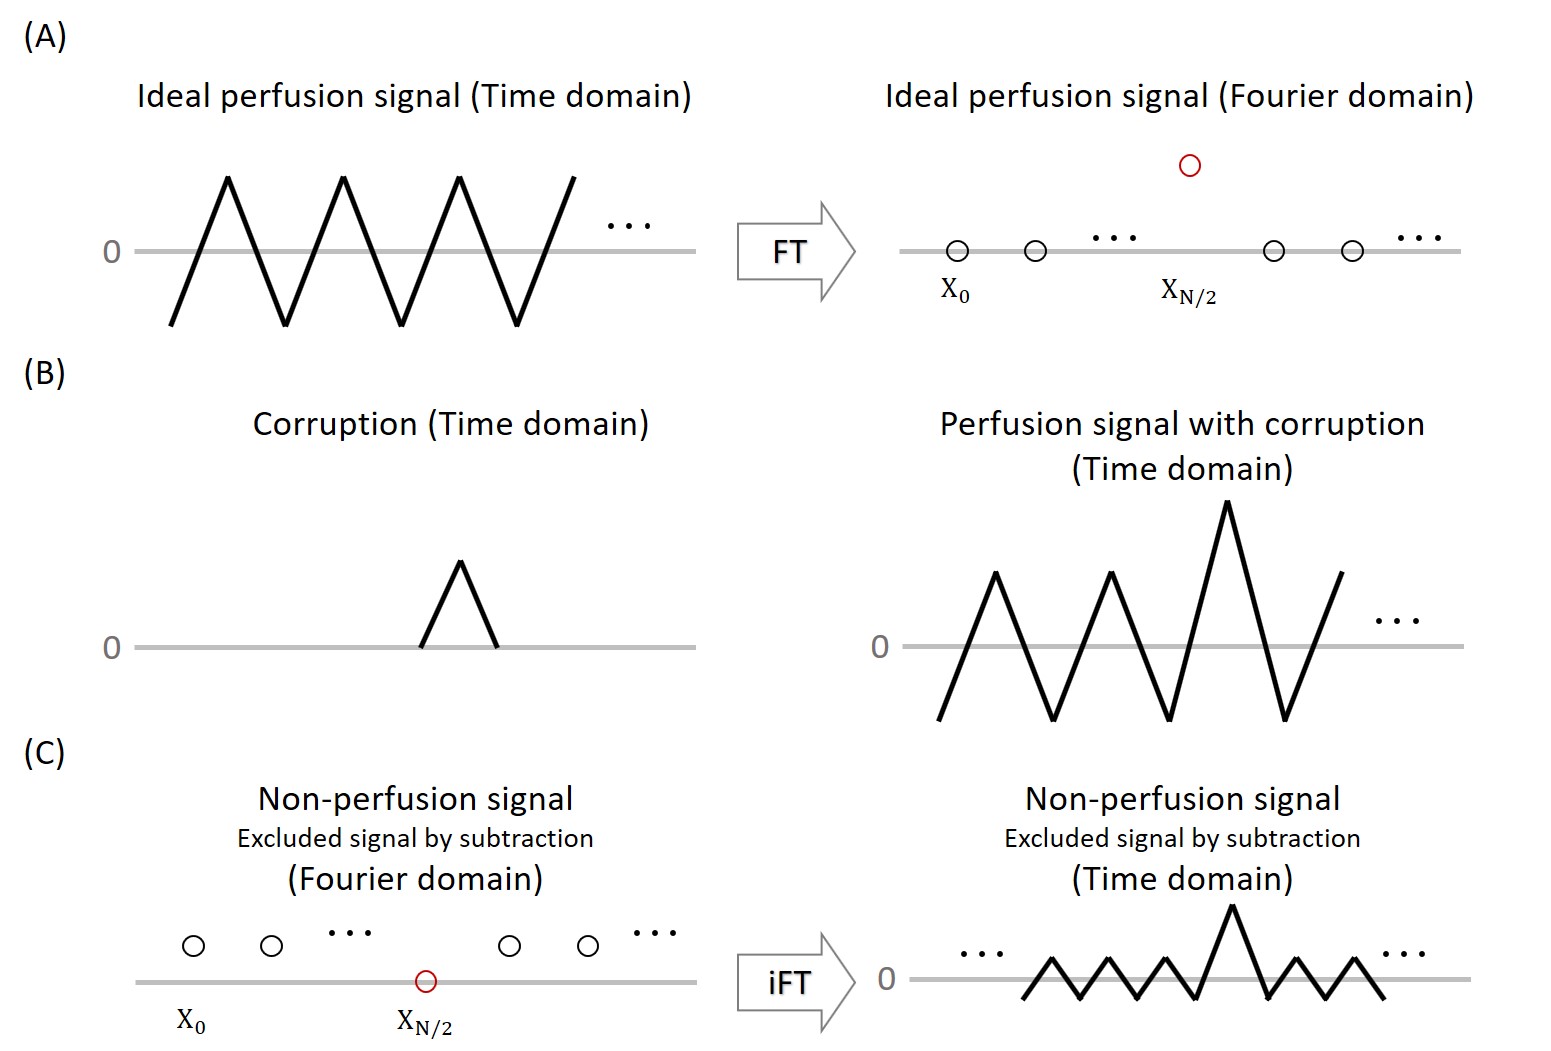
(Interpretation of ASL signal in Fourier domain) In the time series of ASL, a zigzag pattern can be found due to alternating label/control scans, and the quantitative perfusion value is determined by the amplitude of the zigzag pattern, which can be interpreted in the Fourier domain by the following equation.$$X_k=\sum_{n=0}^{N-1}{x_n\cdot e^{-\frac{2\pi i}{N}\cdot k n}}$$ $$X_{N/2}=\sum_{n=0}^{N-1}{x_n\cdot e^{-n\pi i}}=\sum_{n=0}^{N-1}{x_n\cos(\pi n)}=\sum_{n=0}^{\frac{N}{2}-1}\left(x_{2n}-x_{2n+1}\right)$$ $$Perfusion\ signal=\frac{X_{N/2}}{(N/2)}$$ where $$$X_k$$$ is the discrete Fourier transform of the perfusion time series ($$$x_n$$$), $$$N$$$ is the total number of measurements (which is always an even number), $$$x_{2n}$$$ and $$$x_{2n+1}$$$ indicate control and label images, respectively. From these equations, it is clear that perfusion subtraction signal can be interpreted as the scaled magnitude of $$$X_{N/2}$$$. (Figure 1.(A))
(Interpretation of subtraction in Fourier domain) The subtraction to have only the perfusion signal is identical to discarding all the other frequency components including DC component and slow fluctuation in Fourier domain. Therefore, these kinds of non-perfusion signals would not affect the perfusion frequency component ($$$X_{N/2}$$$) in general. However, the abrupt change such as delta corruption (Figure 1.(B)) cannot be eliminated by the simple subtraction (remember that $$$\delta(t)\; {\buildrel FT\over\Leftrightarrow} \;1$$$), resulting in drift on the Fourier domain. Since the perfusion signal corresponds to $$$X_{N/2}$$$, the non-perfusion signals could be acquired at first by setting the signal with $$$X_{N/2}=0$$$, as shown in the Figure 1.(C). Although $$$X_{N/2}$$$, which indicates zigzag characteristics, is zero, the inverse Fourier transform of the non-perfusion signals still showed the zigzag pattern. Therefore, to separate the corruption accurately, the $$$X_{N/2}$$$ value should be determined as a non-zero value.
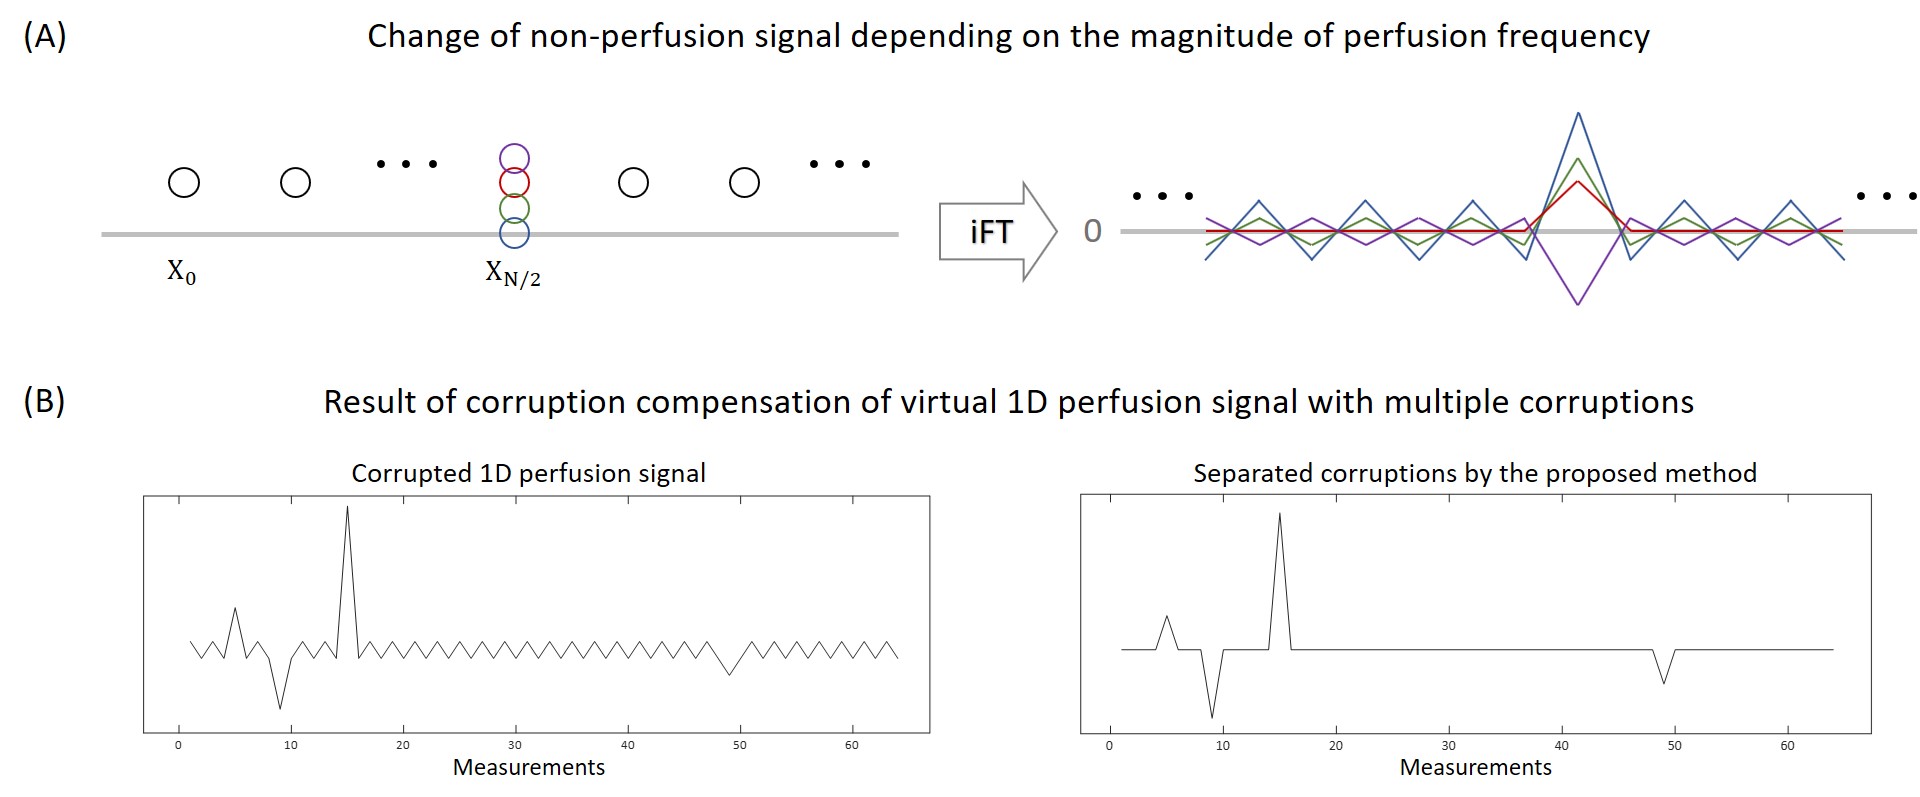
(Corruption compensation in Fourier domain) Based on the assumption that the zigzag pattern in time series indicates the perfusion signal, the non-perfusion signal should not contain any zigzag pattern. Accordingly, the actual corruption could be discriminated by finding the nonzero $$$X_{N/2}$$$ value that minimized the zigzag amplitude of the non-perfusion signals. (Figure 2.(A)) Here, the zigzag amplitude is defined as the sum of the absolute difference between the adjacent time points.
METHODS
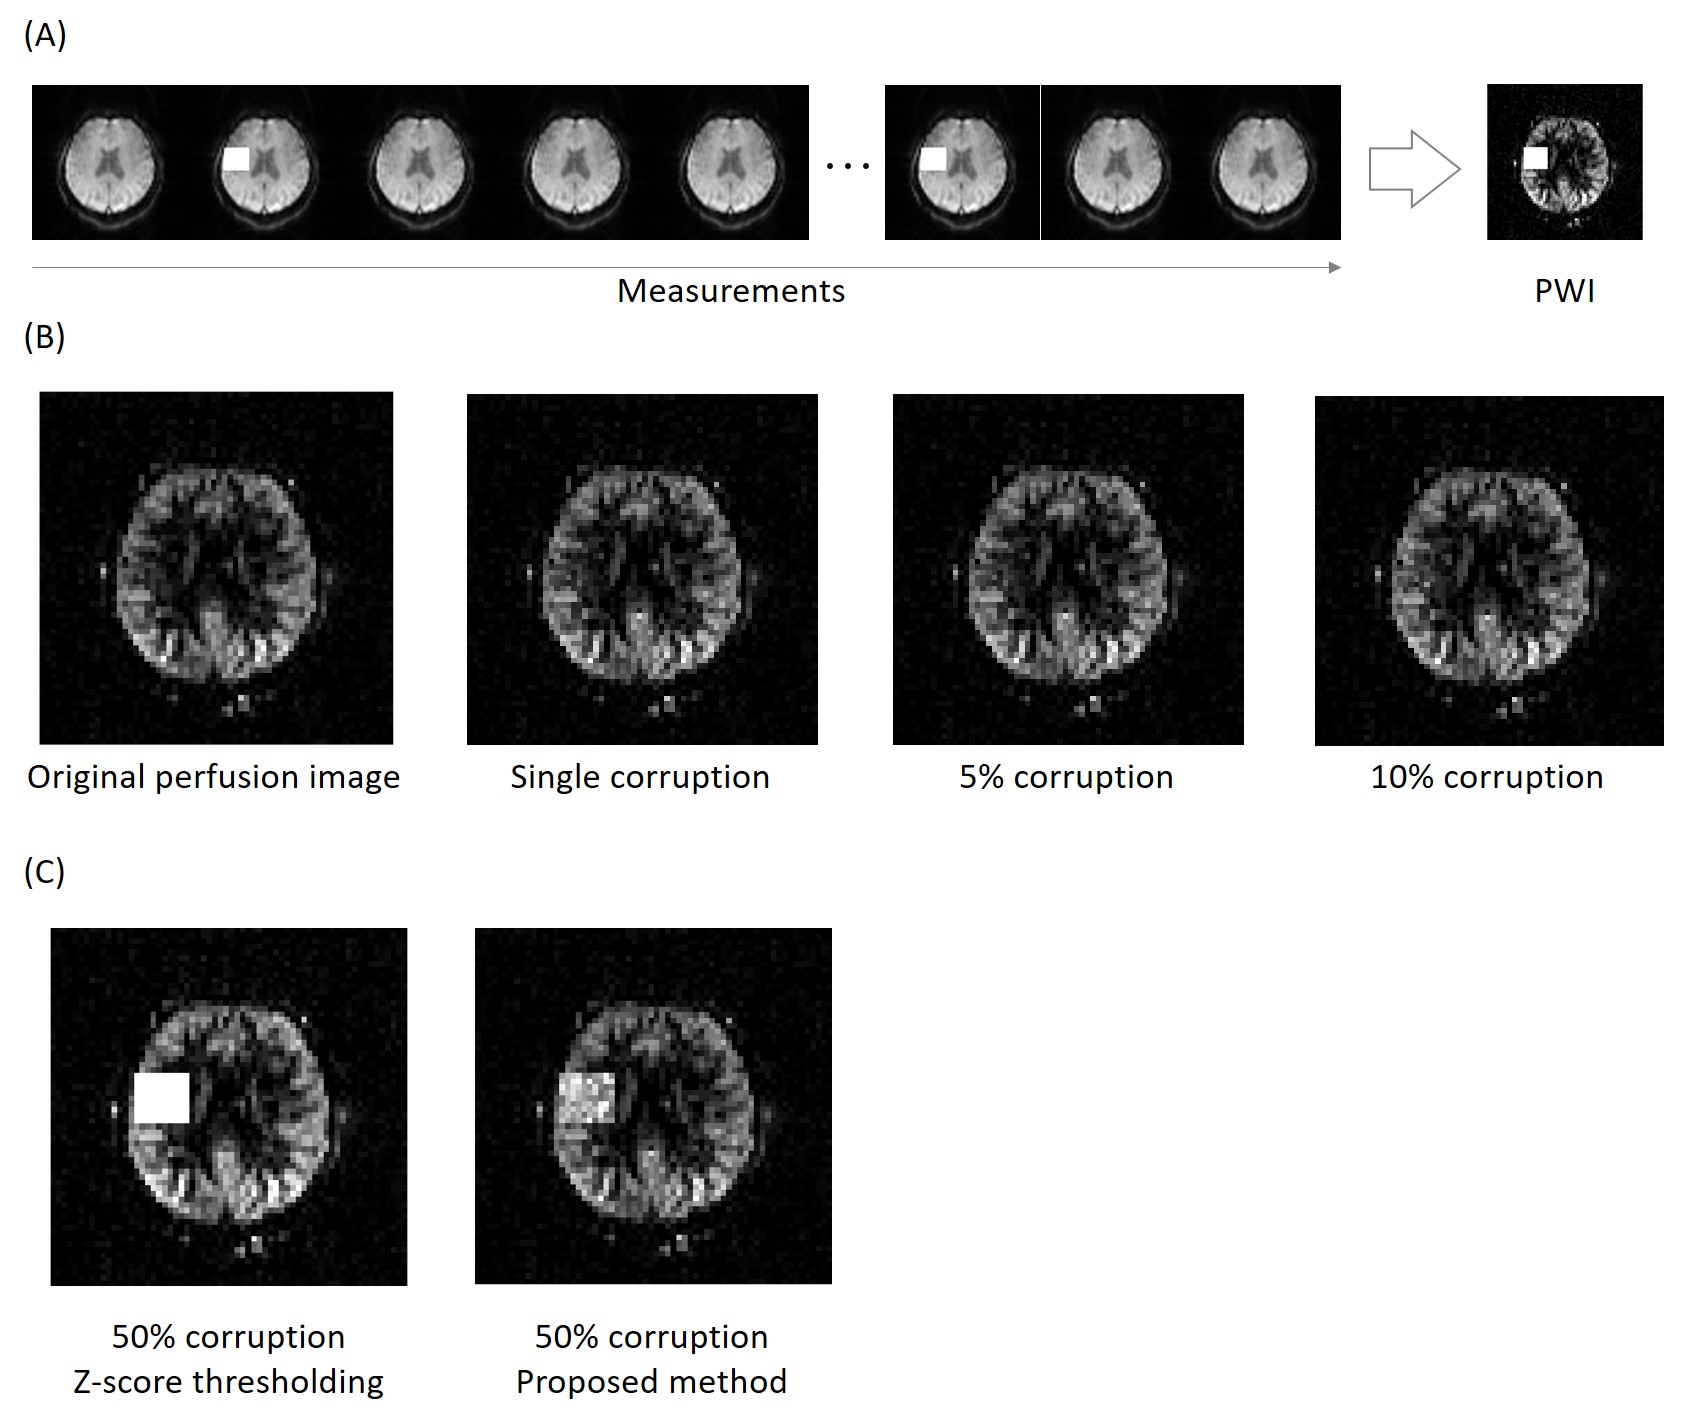
(1D simulation) To validate the proposed method for corruption compensation, 1D simulated perfusion signal with multiple corruptions was generated and processed by the proposed corruption compensation. (Figure 2.(B))(Data acquisition) The perfusion-weighted image (PWI) was obtained in five subjects by the 3D EPI pseudo-continuous ASL at 3T MRI.4 The number of measurements was 68. A single slice was selected from the 3D PWI and the artificial corruptions were inserted in random timepoints with 50 times higher magnitude compared to the perfusion signal. (Figure 3.(A)) The number of inserted corruptions was varied from 3% (one) to 50% of the number of control images.
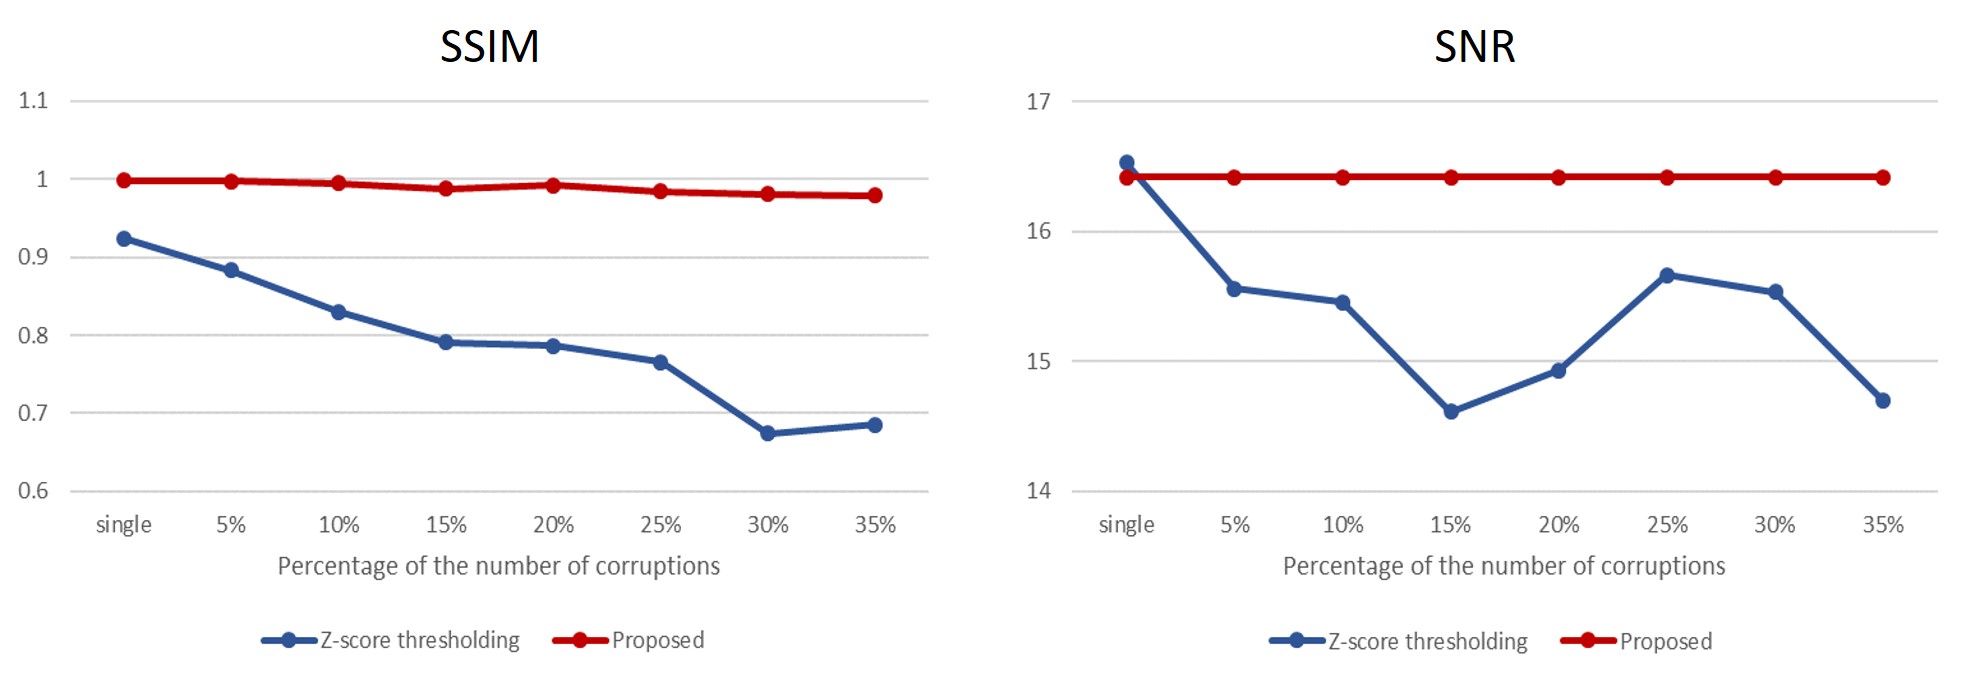
(Comparison with Z-score thresholding and quantitative analyses) The conventional outlier cleaning method, Z-score thresholding2, was also conducted for comparison. For the quantitative validation, structural similarity metric (SSIM)5 and perfusion SNR values were calculated for each corruption case. The perfusion SNR was defined as the ratio of the average gray matter perfusion signal to the standard deviation of the background. To prevent abnormal SNR increases by the corruptions, the SNR was measured in the half of the brain where the corruptions were not located.
RESULTS
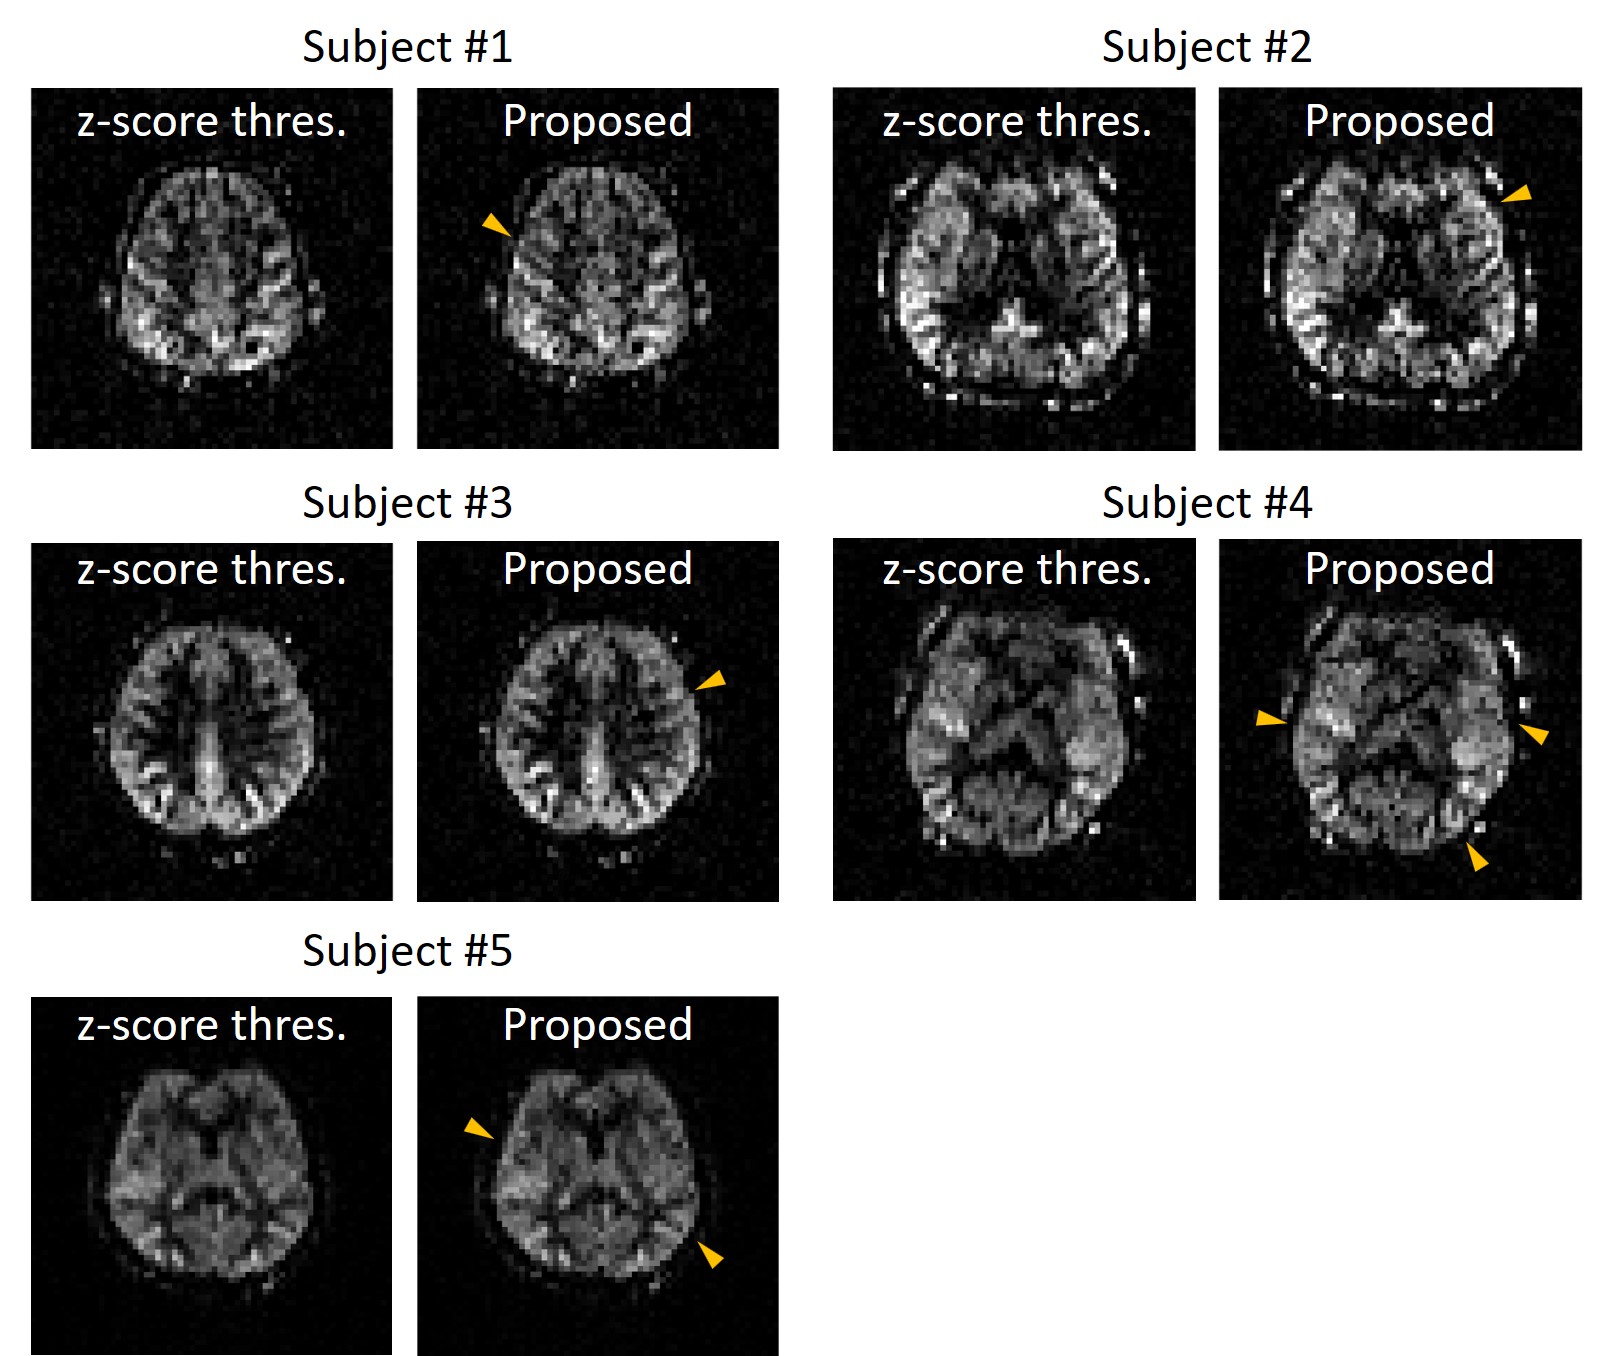
The multiple corruptions were separated perfectly in the 1D simulation, indicating feasibility of the proposed corruption separation. (Figure 2.(B)) The corrupted in vivo images were also recovered to the original PWI without eliminating any measurement. Also, the proposed strategy worked better in the extreme 50% corruption case (Figure 3), while Z-score thresholding could not distinguish outliers due to increasing mean and standard deviation.6 Furthermore, the quantitative comparison indicates robustness of the proposed method to the number of corruptions. (Figure 4) The SNR values remained the same because every measurement was preserved. In addition, the Figure 5 showed that applying the proposed compensation to the image (without insertion of artificial corruptions) reduced blurring to some degree, as indicated by arrows.DISCUSSION AND CONCLUSION
The novel perspective in Fourier domain was proposed to interpret ASL signal and compensate for the corruptions. It showed that the perfusion signal is restricted to a single frequency component. Also, the perfusion frequency component spoiled by the corruptions could be recovered by finding the non-perfusion signals and then minimizing their zigzag amplitude. Although non-perfusion signals may include meaningful information in some applications such as perfusion fMRI, the relevant frequency component can be compensated by a similar approach, which is beyond the scope of the current study. Therefore, it is meaningful perspective in that additional applications of ASL can be opened by features in Fourier domain.Acknowledgements
No acknowledgement found.References
1. Alsop DC, Detre JA, Golay X, et al. Recommended implementation of arterial spin‐labeled perfusion MRI for clinical applications: a consensus of the ISMRM perfusion study group and the European consortium for ASL in dementia. Magnetic resonance in medicine. 2015;73(1):102-116.
2. Tan H, Maldjian JA, Pollock JM, et al. A fast, effective filtering method for improving clinical pulsed arterial spin labeling MRI. Journal of Magnetic Resonance Imaging: An Official Journal of the International Society for Magnetic Resonance in Medicine. 2009;29(5):1134-1139.
3. Fazlollahi A, Bourgeat P, Liang X, et al. Reproducibility of multiphase pseudo-continuous arterial spin labeling and the effect of post-processing analysis methods. NeuroImage. 2015;117:191-201.
4. Hwang S-H, Lee HS, Choi SH, Park SH. Top-up algorithm for single k-space from single-shot EPI. 2022 ISMRM & SMRTANNUAL MEETING & EXHIBITION; 2022; London, UK.
5. Wang Z, Bovik AC, Sheikh HR, Simoncelli EP. Image quality assessment: from error visibility to structural similarity. IEEE transactions on image processing. 2004;13(4):600-612.
6. Maumet C, Maurel P, Ferré J-C, Barillot C. Robust cerebral blood flow map estimation in arterial spin labeling. Paper presented at: International Workshop on Multimodal Brain Image Analysis2012.
Figures