2906
Comparison of velocity-selective-inversion arterial spin labeling schemes
Ke Zhang1, Simon M.F. Triphan1, Oliver Sedlaczek1,2, Christian Ziener2, Hans-Ulrich Kauczor1, Heinz-Peter Schlemmer2, and Felix T. Kurz2
1Department of Diagnostic and Interventional Radiology, Heidelberg University Hospital, Heidelberg, Germany, 2Department of Radiology, German Cancer Research Center, Heidelberg, Germany
1Department of Diagnostic and Interventional Radiology, Heidelberg University Hospital, Heidelberg, Germany, 2Department of Radiology, German Cancer Research Center, Heidelberg, Germany
Synopsis
Keywords: Pulse Sequence Design, Arterial spin labelling
Velocity-selective pulses include VS saturation pulses (VSS) and VS Inversion (VSI) pulses. Previous study (1) concluded that both dual-sBIR8-VSS and sinc-VSI achieved the highest SNR efficiency among the VS labeling schemes. Overall, the dual-sBIR8-VSS pulse was the most robust against field imperfections, whereas sinc-modulated VSI pulse showed greater tSNR and was the best among the VSI methods. In this study, VSI sequence with rectangular small flip-angle RF pulses (rect-VSI), sinc-VSI with and without VS gradients during the control condition are compared. Bloch simulation and in vivo experiments for their robustness against B1, B0 variation and eddy current (EC) are investigated.PURPOSE
To compare three different vessel-selective inversion (VSI) pulses for noninvasive arterial spin labeling (ASL) measurement of perfusion in human brain.METHODS
Numerical simulations using the Bloch equations based on matrix rotation were performed to assess the properties of the Fourier transform based velocity-selective inversion (FT-VSI) pulse trains with three different settings using Matlab (MathWorks, Inc., Natick, MA, USA). The Mz profile in the presence of B1 (0.6 to 1.4 of the nominal value, step size 0.57) and B0 (-200 to 200 Hz, step size 40 Hz) variations, with arterial T1 (1932 ms) and T2 (275 ms) relaxation were simulated. To investigate the sensitivity to the eddy current (EC) effects, Bloch simulations were performed for these different VS pulses with EC amplitude of 0.25% and time constants of 0.1 to 1000 ms. Measurements were performed using a 20-channel head/neck receiver coil on a 3T scanner (Prisma, Siemens Healthineers AG, Erlangen, Germany). Pulse sequence diagrams for VSI-ASL with 3D acquisition are same as demonstrated in previous study (2). It includes five blocks within each repetition: slab-selective saturation, label/control modules using FT-VSI pulse trains, background suppression (BGS), flow-dephasing for suppressing large-vessel signal, and 3D GRASE readout (2). Three FT-VSI pulse trains are compared: 1) traditional VSI sequence with rectangular small flip-angle RF pulses (rect-VSI); 2) sinc-modulated FT-VSI pulse (sinc-VSI) with VS gradients during control condition, for sinc-VSI the amplitude of the nth pulse is given by sinc(n/5), where n = -4:1:4). The flip angles of these 9 rectangular pulses add up to 180°; 3) sinc-modulated FT-VSI pulse (sinc-VSI) without VS gradients during control condition. The design of pulse trains are compared in Figure 1. Sequence parameters were as follows: TE =17.2 ms, FOV=220×220 mm3, FA=120°, slice and in-plane partial Fourier = 6/8, segments=2, matrix size=64×64×24, slice oversample = 16.7%, resolution=3.4×3.4×5 mm3, bandwidth = 2298 Hz, labeling/control duration = 64 ms, cutoff velocity =2.8 cm/s, delay between the pre-saturation and the labeling modules = 2 s, post-labeling delay (PLD) =1200 ms, TR = 4000 ms, timing for BGS = 0.52, 0.91 and 1.08 s; control-labeling pairs = 20, TA = 5.2 min. Each pulse scheme was tested in three healthy subjects.RESULTS
The simulated Mz-velocity responses are shown in Figure 2. Both rect-VSI and sinc-VSI based pulses were capable of labeling spins in a narrow velocity band with reasonable robustness against field inhomogeneities. The sinc-VSI pulse produced much smoother response in the “unperturbed” velocity bands. The control profile of sinc-VSI without VS gradients during control condition showed the best performance despite B0/B1+ inhomogeneities. Figure 3 shows the simulated magnetization of the static tissue (V = 0) under the label condition showing EC sensitivity of VSI pulses to EC components with different time constants (ranging from 0.1 ms to 1000 ms) at different distances to the iso-center of the magnet. The sinc-VSI without VS gradients during control condition demonstrated good resistance to EC effects. Normalized perfusion signal equal to the averaged subtraction of label/control pairs (∆S) divided by S0,tissue, (∆S/S0,tissue), was calculated as an indicator of perfusion signal level (Figure 4). In the in vivo experiment, the sinc-VSI without VS gradients gave the highest ASL signals at the gray matter but lower ASL signals at the region of basilar arteries.DISCUSSION
The reason for this phenomenon is likely due to the unbalanced selection of moving spins with different flow direction. In the third scheme all moving spin with all flow directions were inverted in control condition. However, only the moving spins along z direction were selected in label condition. After applying VS gradients along all three directions during labeling, the signal at the region of basilar arteries was restored, as shown in Figure 5.CONCLUSION
This study compared three FT-VSI ASL schemes. In simulation, the sinc-VSI without VS gradients during the control condition demonstrated the best performance against B0/B1+ inhomogeneity and EC effects. The in vivo experiment showed that the sinc-VSI without VS gradients gives the highest ASL signals. However, in the in vivo experiment this scheme showed ASL signal voids at the level of basilar arteries. To avoid this, a VS gradient along x and y may need to be added in the labeling section.Acknowledgements
This work was supported by the Deutsche Forschungsgemeinschaft (DFG, German Research Foundation), 507778062.References
1. Guo J, Das S, Hernandez-Garcia L. Comparison of velocity-selective arterial spin labeling schemes. Magn Reson Med 2021;85(4):2027-2039.
2. Liu D, Xu F, Li W, van Zijl PC, Lin DD, Qin Q. Improved velocity-selective-inversion arterial spin labeling for cerebral blood flow mapping with 3D acquisition. Magn Reson Med 2020;84(5):2512-2522.
Figures
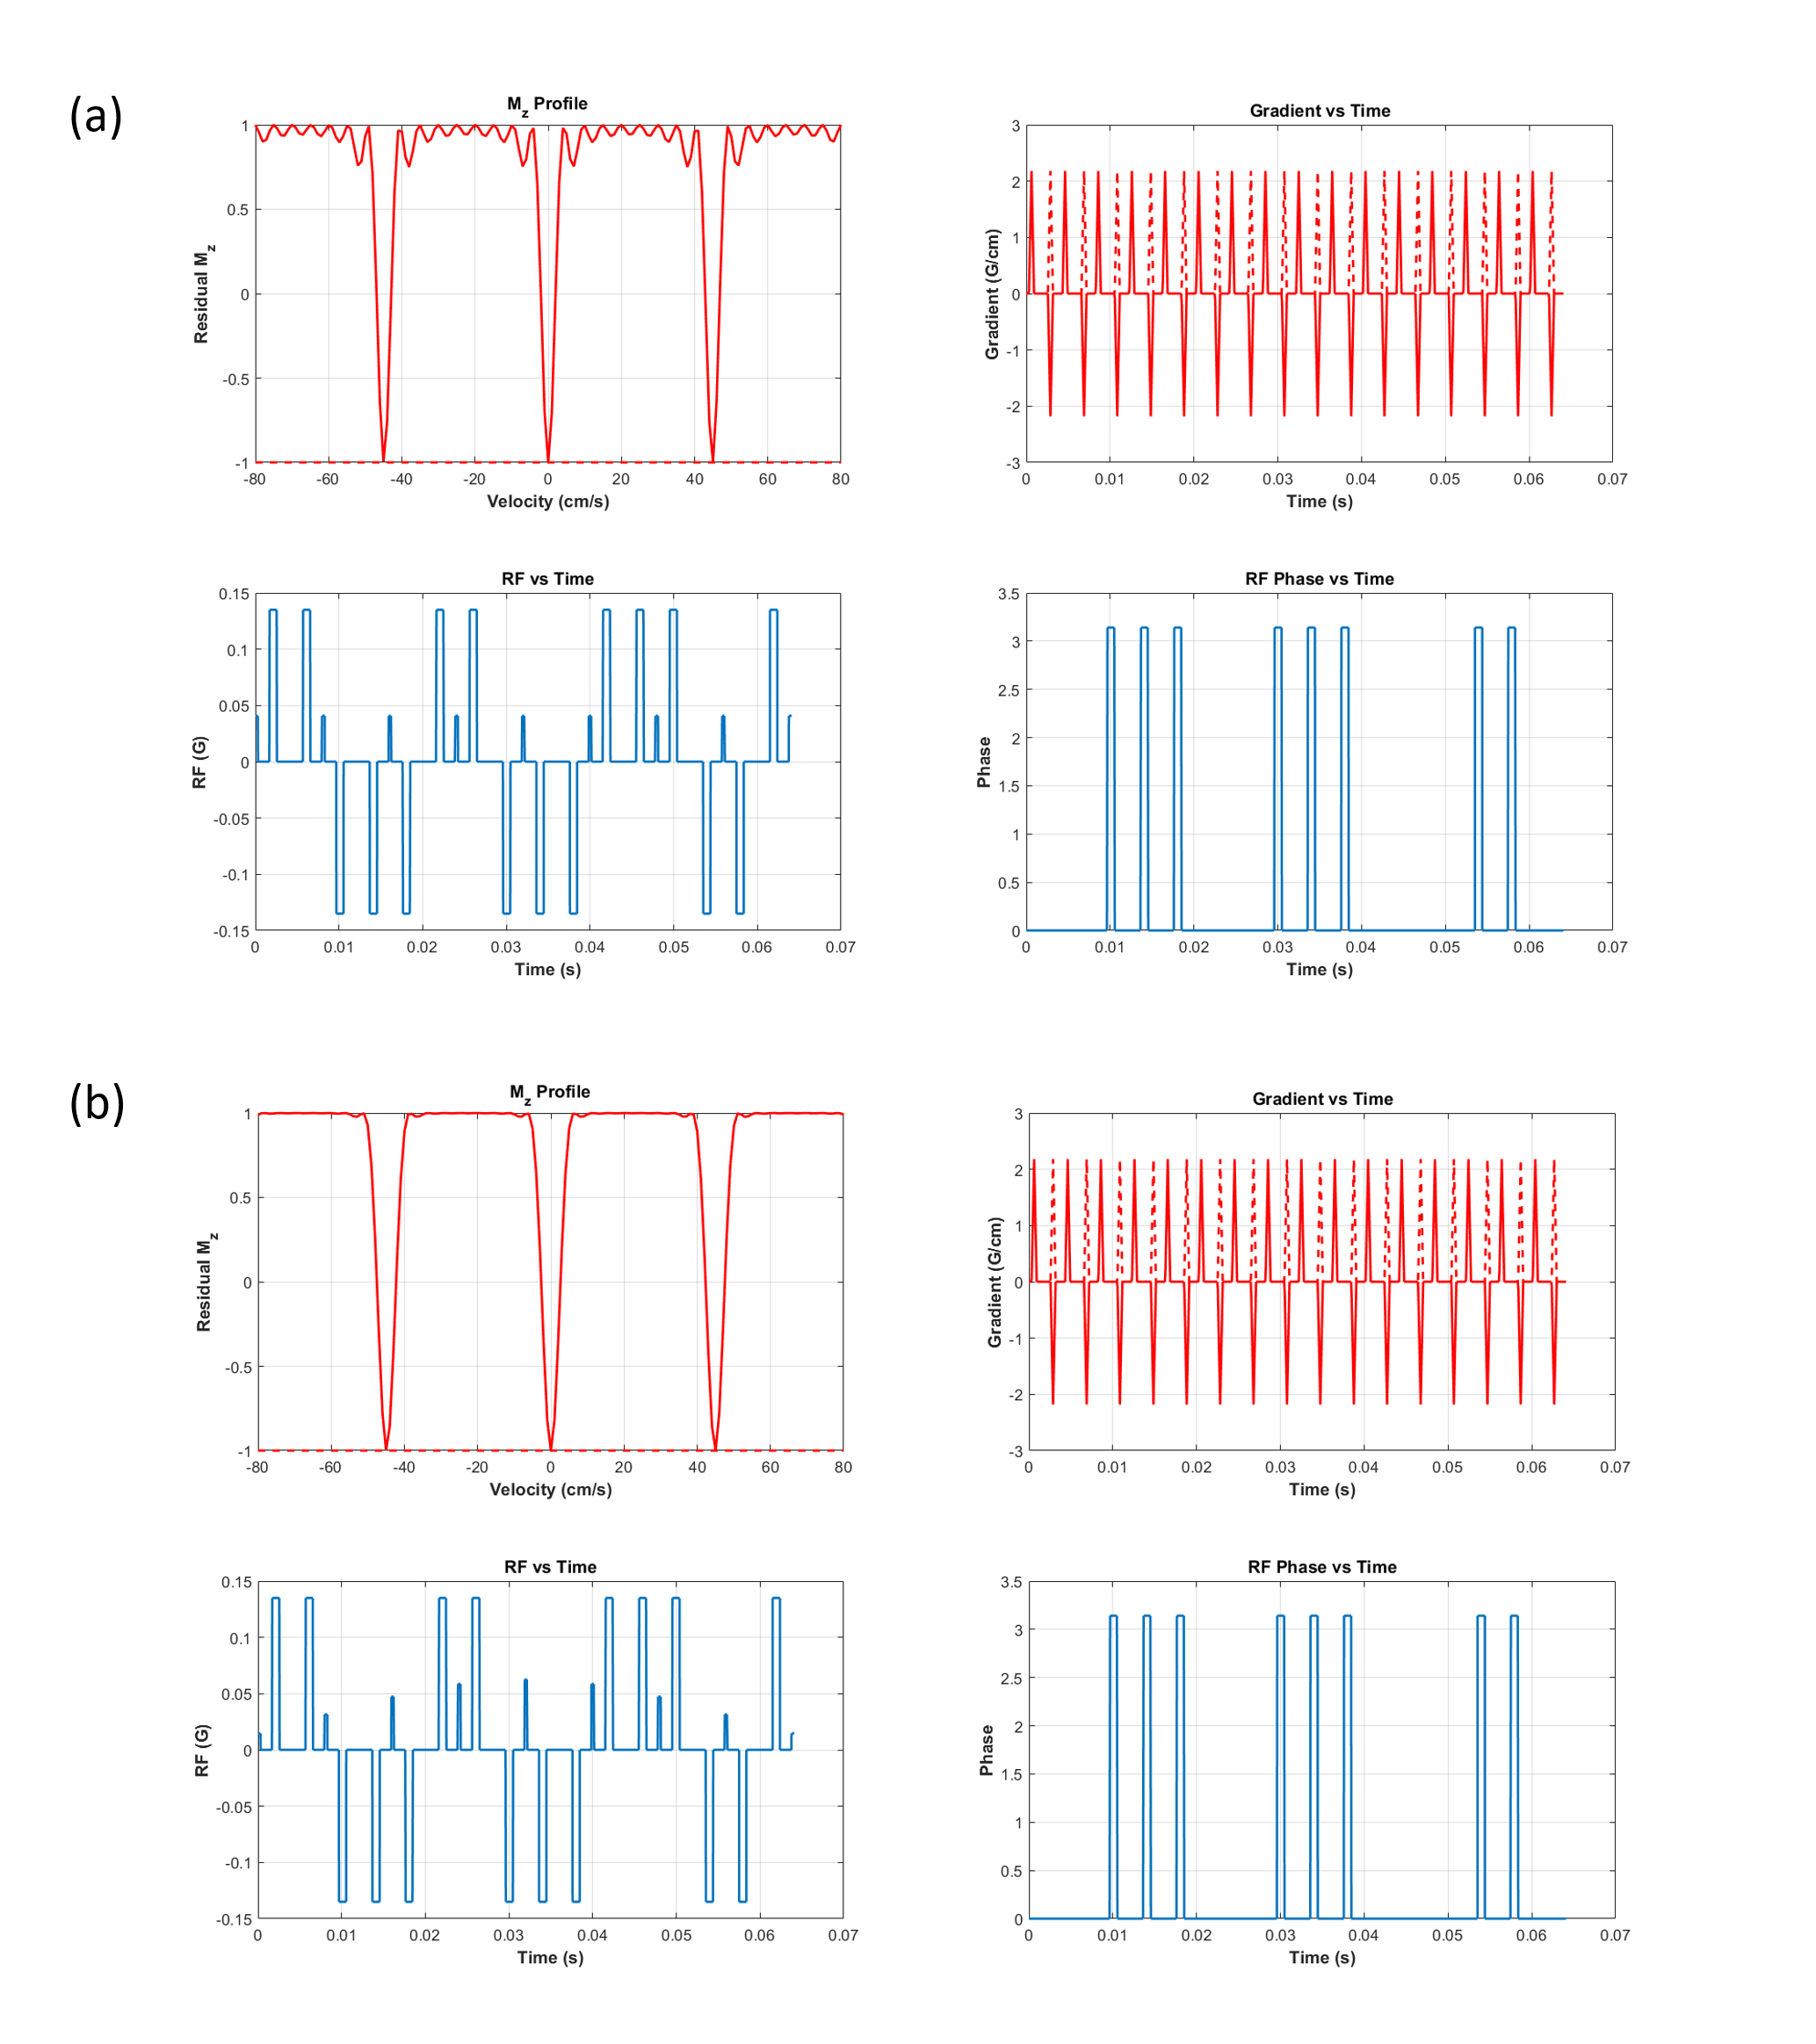
Fig 1. Simulated velocity response of rect-VSI (a) and sinc-VSI (b) under the
label (solid red curves) and the control (dashed red curves) conditions. The RF
pulse, phase of RF pulse and gradient for the FT-VSI labeling (solid) and
control (dashed) are plotted. The third scheme we are comparing is sinc-VSI
without VS gradients in the control condition. No B1 or B0
inhomogeneity were considered for these simulations.
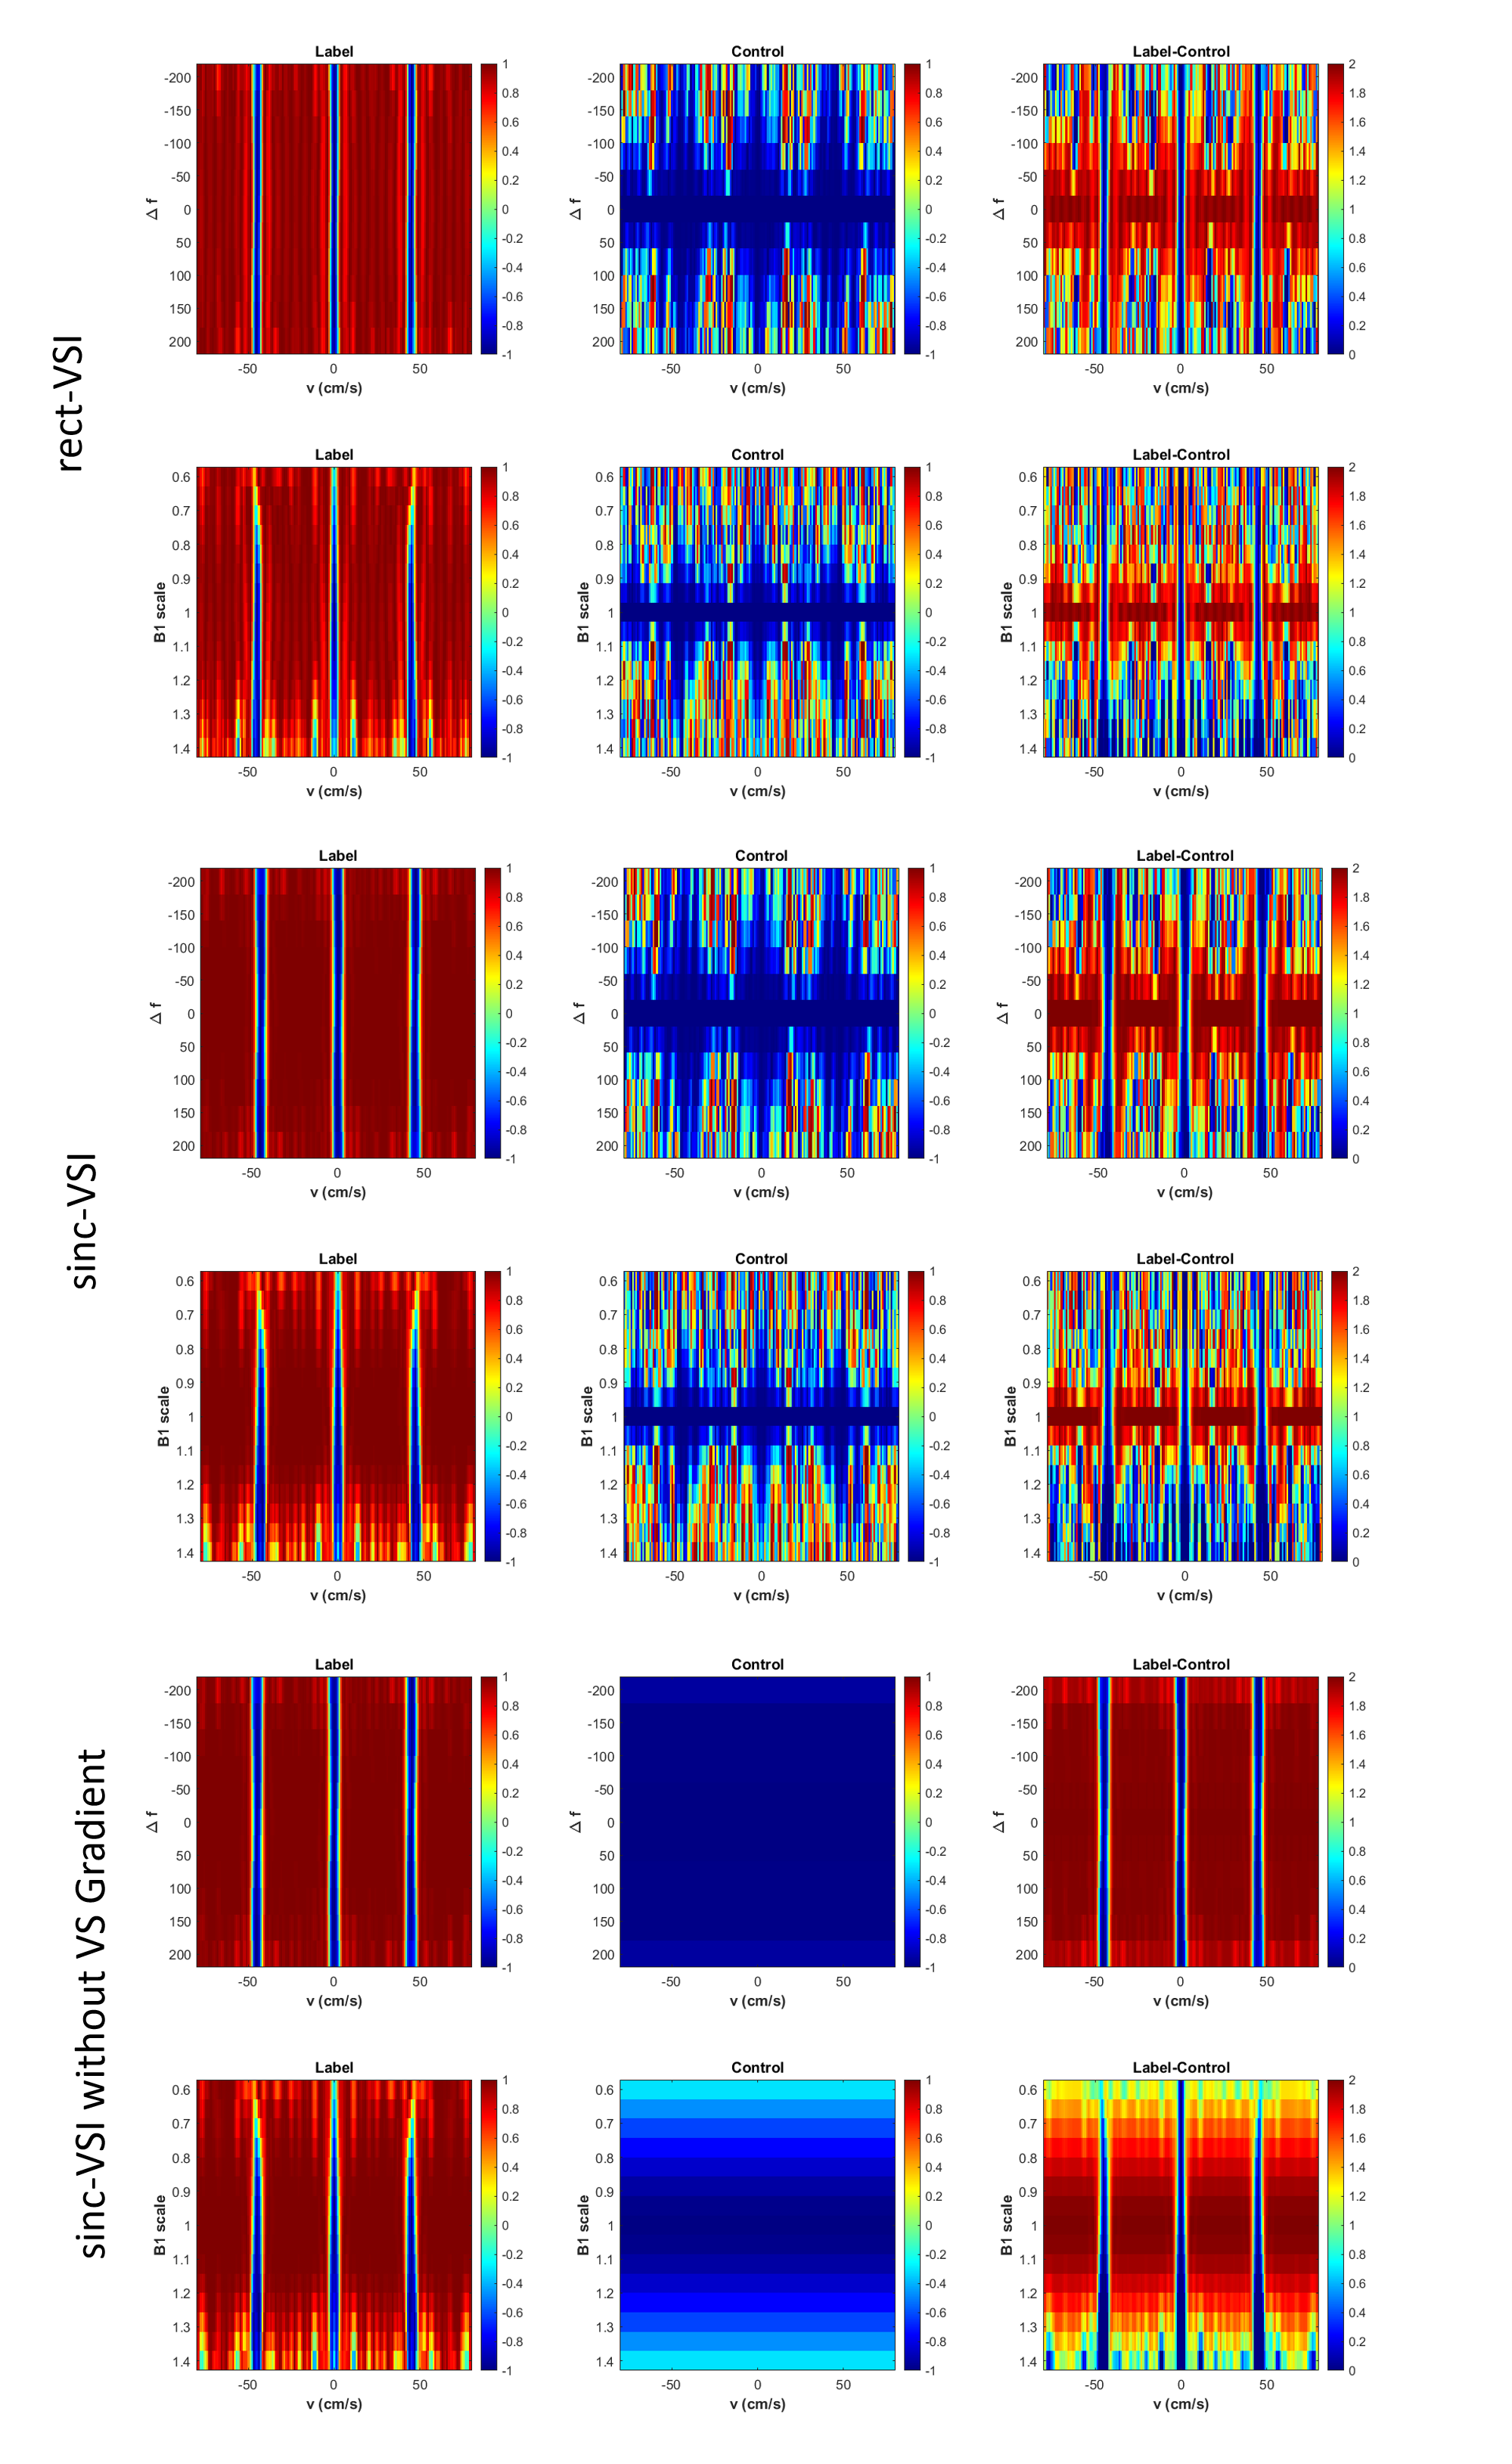
Fig 2. The simulation results showing the performance of the FT-VSI labeling
pulses: (top row) magnetization versus mean velocity response under the
labeling, control and label-control conditions showing the sensitivity to B0
variation (ranging from −200 Hz to 200 Hz) when B1 = 1; (down
row)magnetization versus mean velocity response under the labeling, control and
label-control conditions showing the sensitivity to B1 variation
(ranging from 0.6 to 1.4 of the nominal value) without off-resonance.
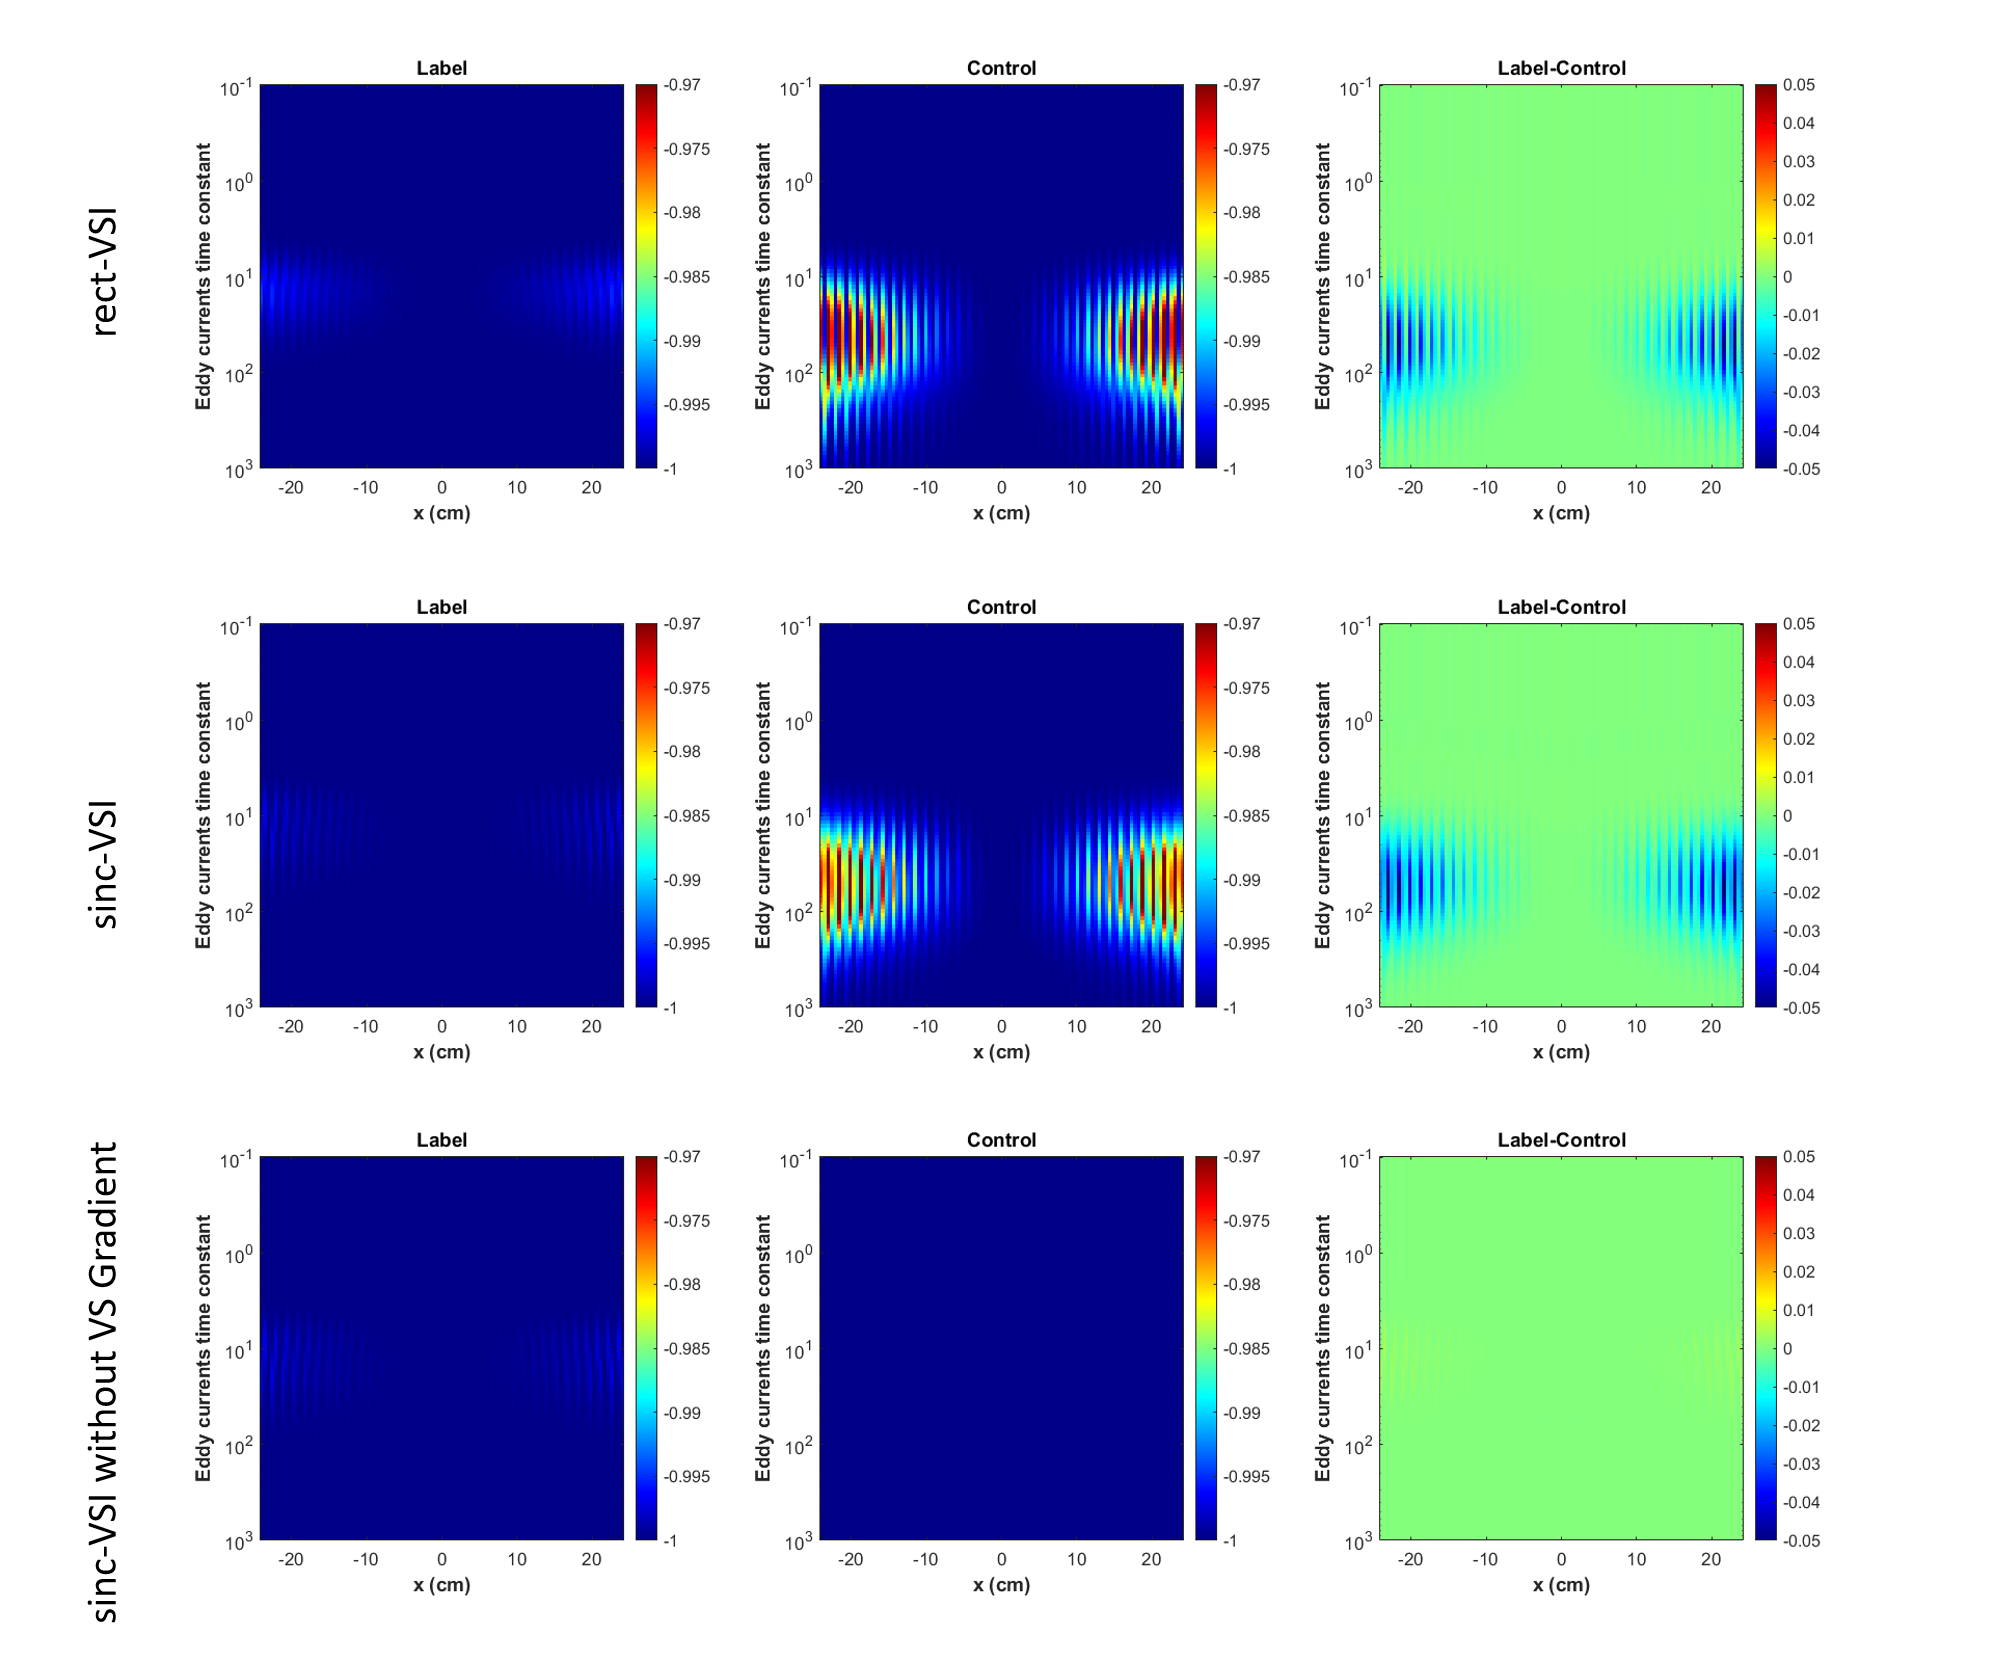
Fig 3. The simulation results showing the performance of the VS labeling
pulses: magnetization of the static tissue (V = 0) under the label condition
showing EC sensitivity of the VSS and VSI pulses to EC components with
different time constants (ranging from 0.1 ms to 1000 ms) at different distance
to the iso-center of the magnet.
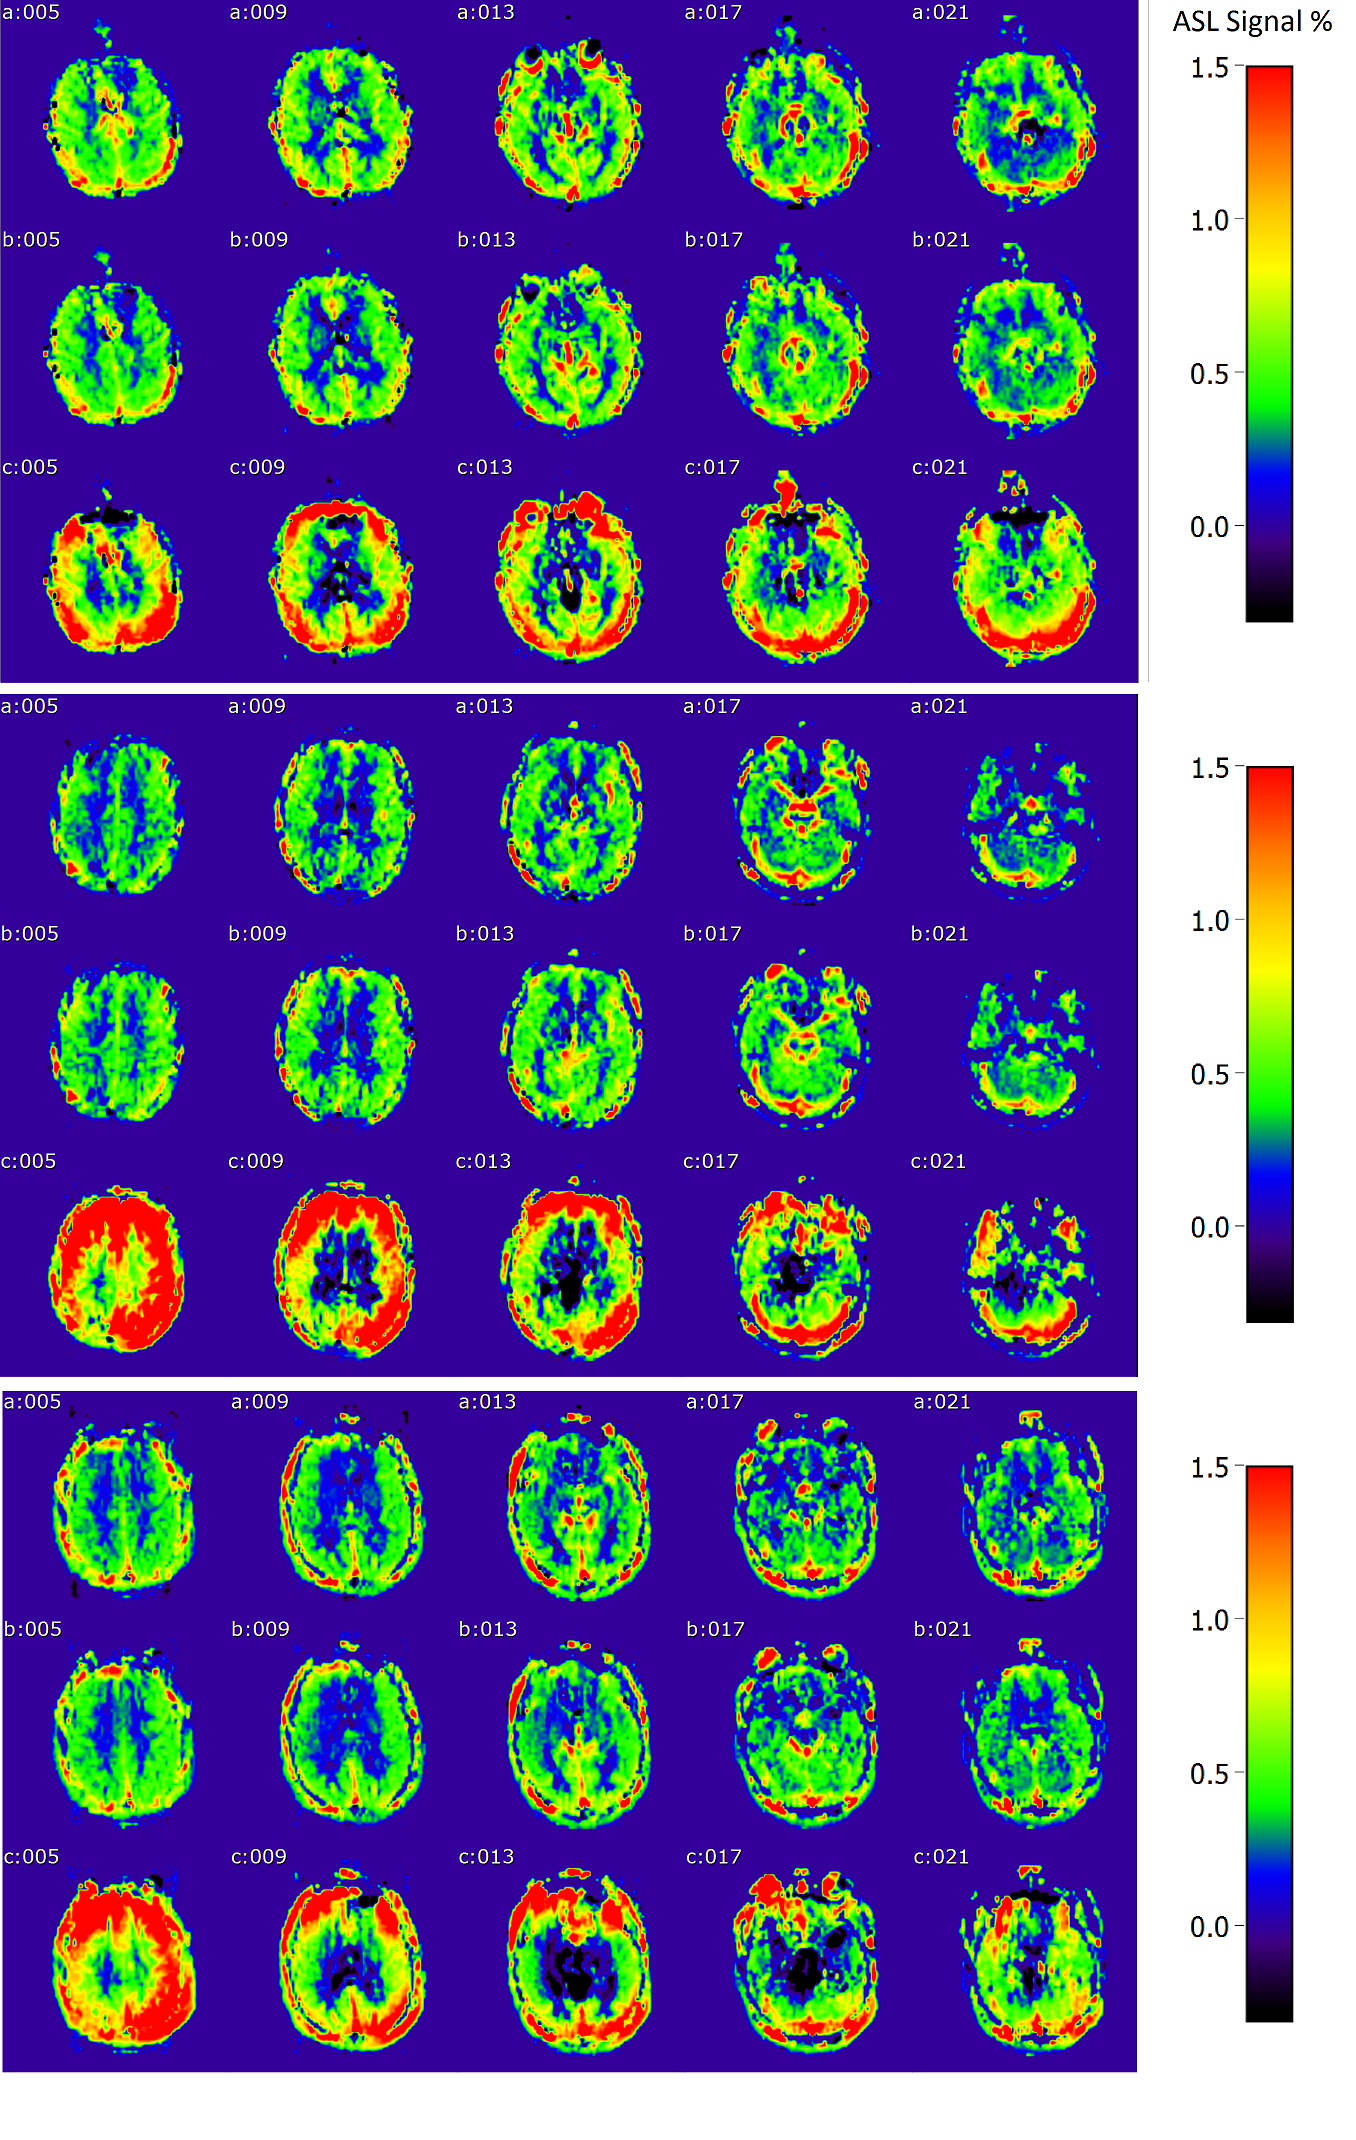
Fig 4. Comparison between labeling schemes on 5 slices from three represent
subjects (top-down) showing the relative signal change due to three schemes
(normalized to the spin density image): a) rect-VSI; b) sinc-VSI; c) sinc-VSI
without VS gradient during control condition.
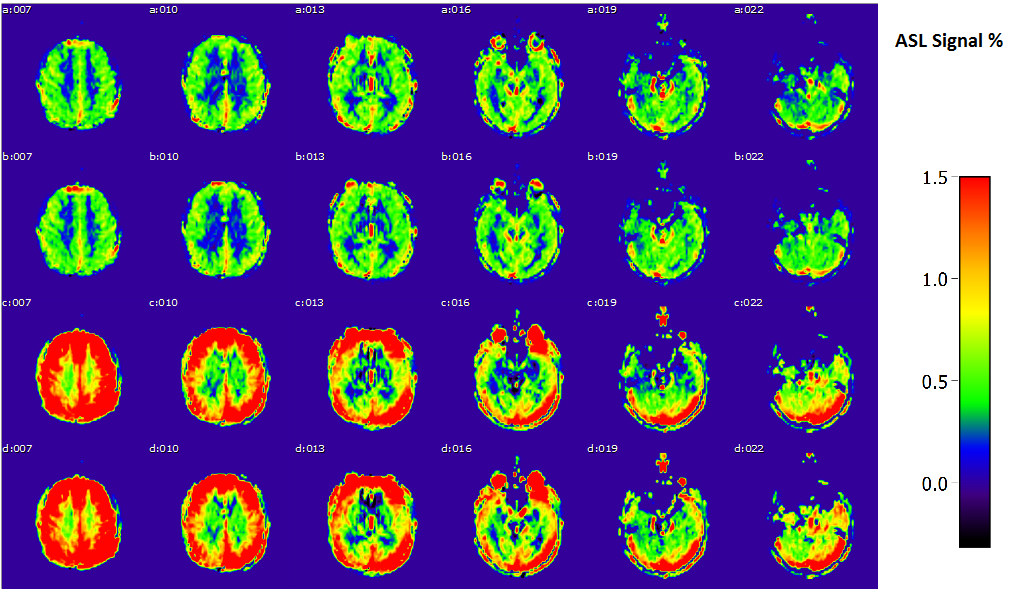
Fig 5. After applying VS gradients along all three directions the ASL signal at
the region of basilar arteries are restored. a) rect-VSI; b) sinc-VSI; c)
sinc-VSI without VS gradient during control condition, d) sinc-VSI without VS
gradient during control condition but with VS gradients along x, y and z during
labeling condition.
DOI: https://doi.org/10.58530/2023/2906