2903
Deep Learning-denoised Isotropic 2mm Whole Brain pseudo-Continuous Arterial Spin Labeling at 7T1Mark & Mary Stevens Neuroimaging and Informatics Institute, Keck School of Medicine, University of Southern California, Los Angeles, CA, United States, 2Department of Neurology, Keck School of Medicine, University of Southern California, Los Angeles, CA, United States
Synopsis
Keywords: Machine Learning/Artificial Intelligence, Arterial spin labelling, Noise reduction
Optimized pseudo-Continuous Arterial Spin Labeling has been implemented at 7T. To achieve whole brain high-resolution (2mm isotropic) perfusion imaging at 7T, however, requires prolonged scan time with an increased number of segments. A deep learning (DL) model was trained to boost the signal-to-noise ratio (SNR) for a scan with fewer repetitions and thus a shorter scan time. The analysis of SNR and temporal SNR suggests that at least 3 repetitions are needed to make a high-SNR prediction comparable to the full scan without compromising quantification accuracy. With DL denoising, the original 12 mins scan can be finished in 4 min.Background
Optimized pseudo-Continuous Arterial Spin Labeling (pCASL) has been implemented at 7T. To achieve whole brain high resolution (isotropic 2mm) perfusion imaging at 7T, however, requires prolonged scan time with an increased number of segments resulting in increased sensitivity to motion. Acquiring fewer repetitions is desirable for improving the clinical utility but raises the concern of low signal-to-noise ratio (SNR) for high resolution pCASL. Deep learning (DL) has been applied for ASL denoising1,2. In this study, a DL denoising model was trained for achieving whole brain isotropic 2mm pCASL at 7T with high SNR in a short acquisition time, and its influence on cerebral blood flow (CBF) quantification was evaluated.Methods
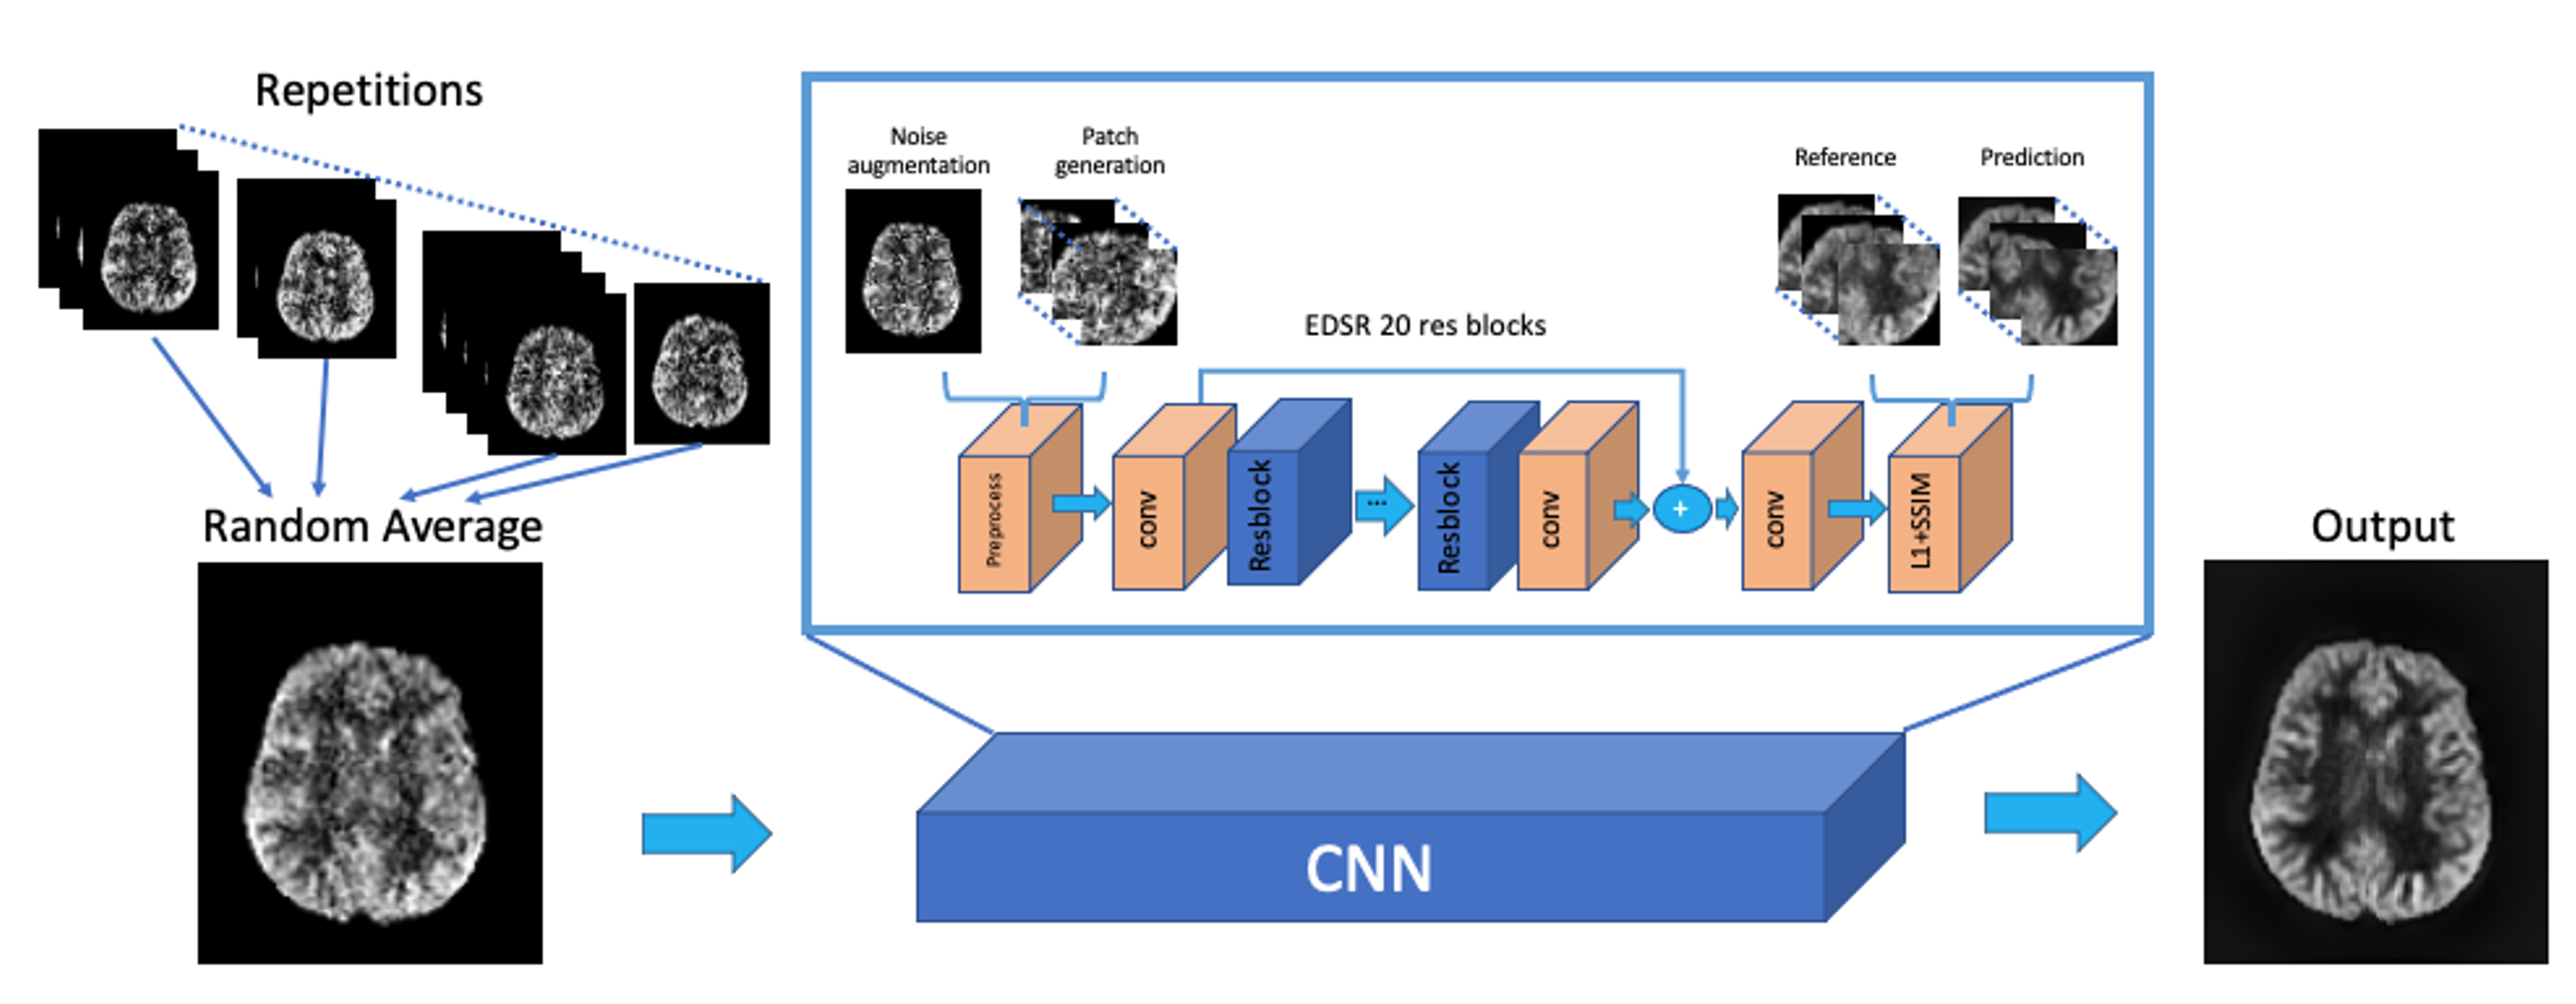
As shown in Fig.1, the DL model was trained based on Enhanced Deep Super-resolution network (EDSR)3 which learns an end-to-end mapping between a low-quality perfusion weighted image (PWI) and a reference PWI averaged across all available repetitions. Data augmentations, including random averaging across repetitions and Gaussian noise addition in k-space, were performed to increase the size of training dataset and improve the adaptability of different SNR conditions. 2D patches with size of 48x48 were further geometrically transformed and fed into the network. A joint loss of L1 and structural similarity index measure (SSIM) within the brain was implemented to optimize image similarity while preventing blurring.The training dataset contained 264 2D PWI slices acquired from 11 healthy subjects (5 females, 25.3±2.5 y/o). Imaging parameters of the pCASL sequence were: labeling duration=1sec, post labeling delay=2sec, FOV=224×192×96mm, matrix size=112×96×24, resolution=2×2×4mm, TR=4ms, TE=1.55ms, 2 segments, 2 background suppression (BS), flip angle (FA)=8°, 2 M0 images and 24 PWIs acquired in 11min40sec. The trained network was applied to two testing data acquired from a 29 y/o male and a 25 y/o female subject, respectively, with modified sequence parameters, including matrix size=112×96×48, resolution=2x2x2mm3, 4 segments, FA=12°, 2 M0 images and 12 PWIs acquired in 12min10sec. All scans were performed under IRB on the investigational pTX part of a Siemens 7T MAGNETOM Terra (Siemens Healthcare, Erlangen, Germany) with an investigational Nova 8Tx/32Rx head coil.
The network performance in SNR improvement and CBF quantification was evaluated for the two testing subjects. SNR was calculated by dividing the mean from GM by the standard deviation (SD) within a hand-drawn uniform region-of-interest (ROI) in WM. Temporal SNR (tSNR) was measured as the ratio between the mean and SD of PWI signal across repetitions. CBF maps were generated according to the kinetic model4 where the labeling efficiency and inversion efficiency of BS were assumed to be 0.75 and 0.92, respectively. Correlation and Bland-Altman plots were drawn to analyze the consistency of CBF values between the reference and DL denoised PWI.
Results and discussion
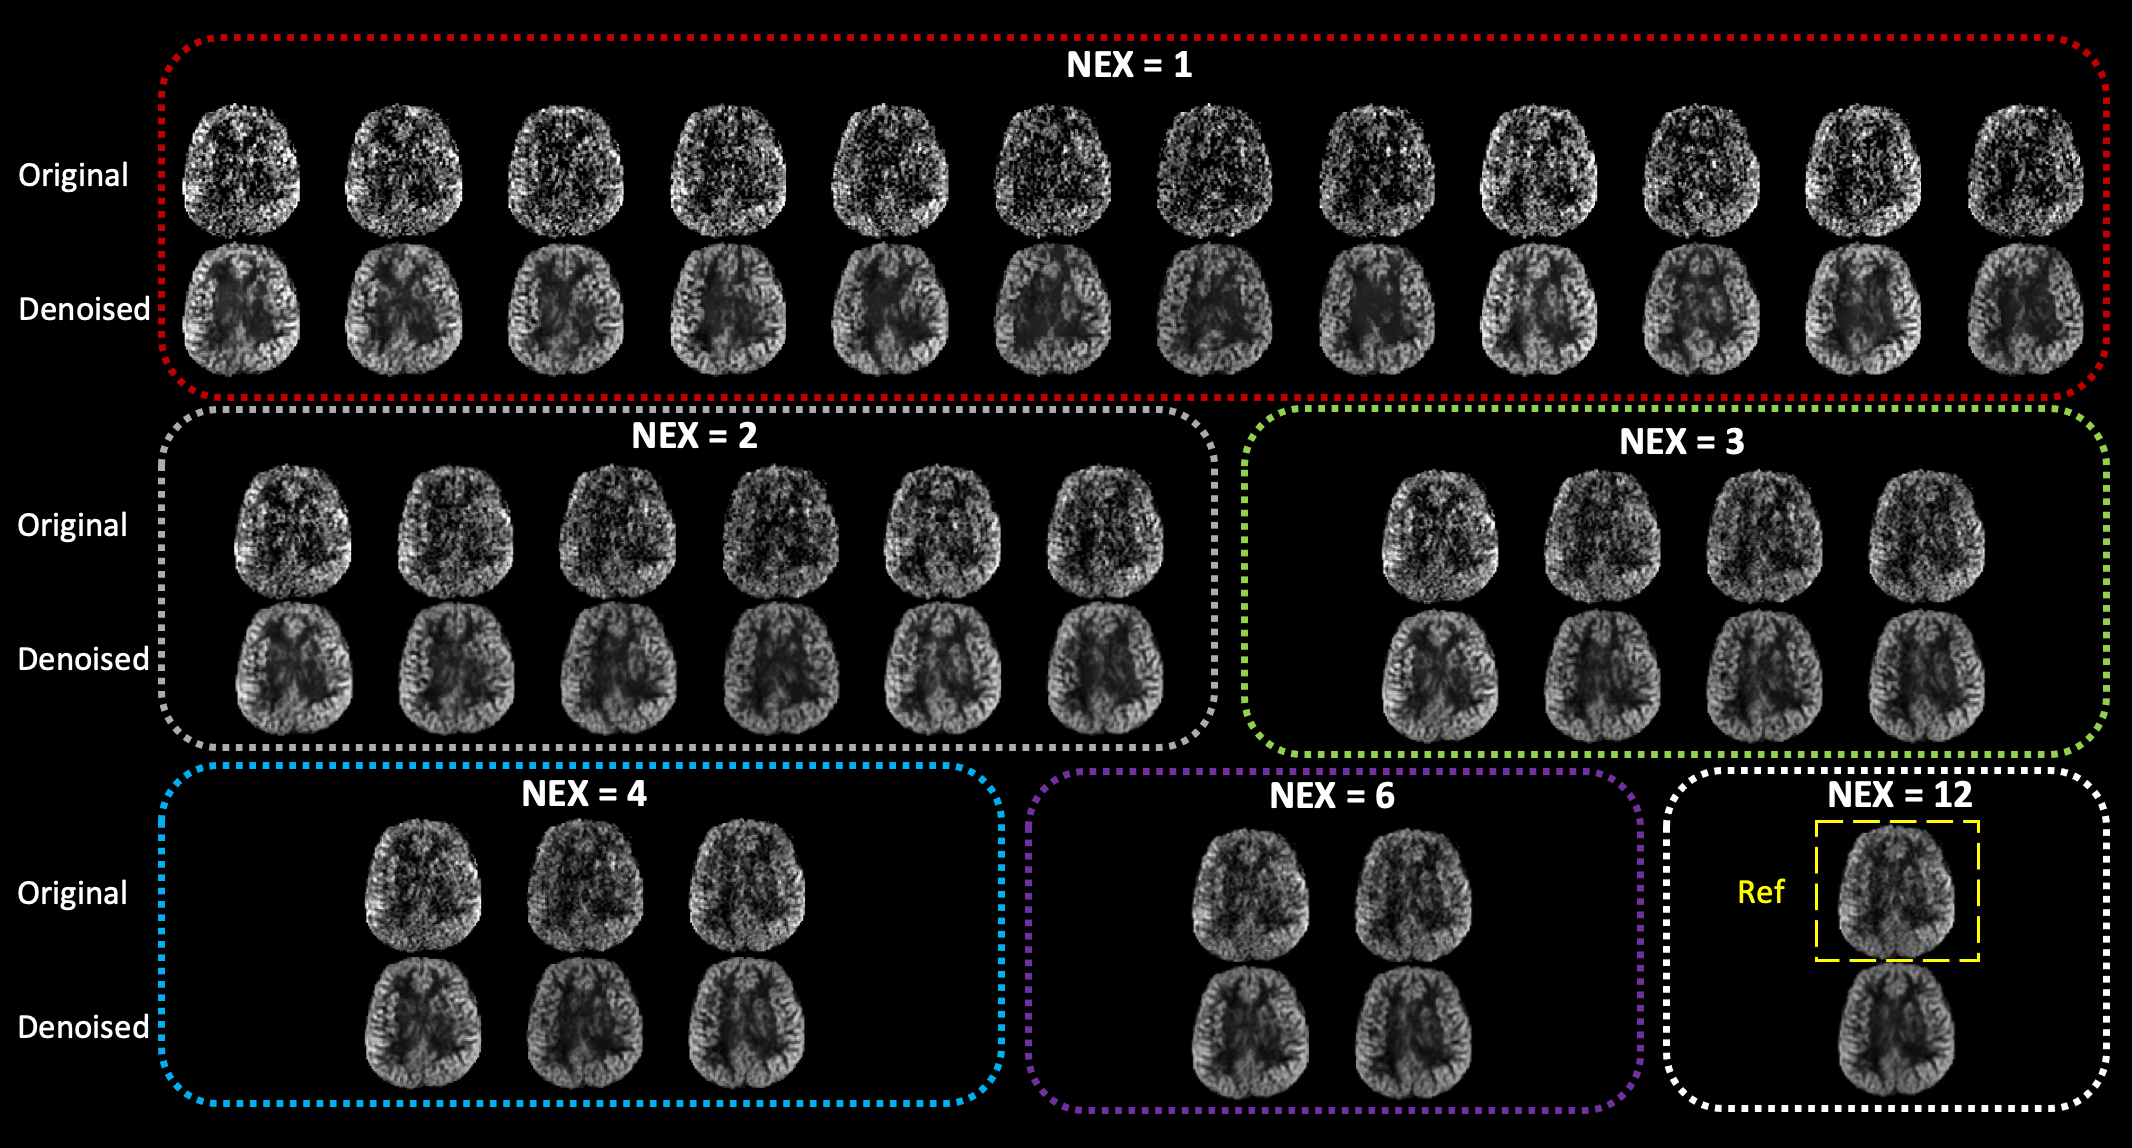
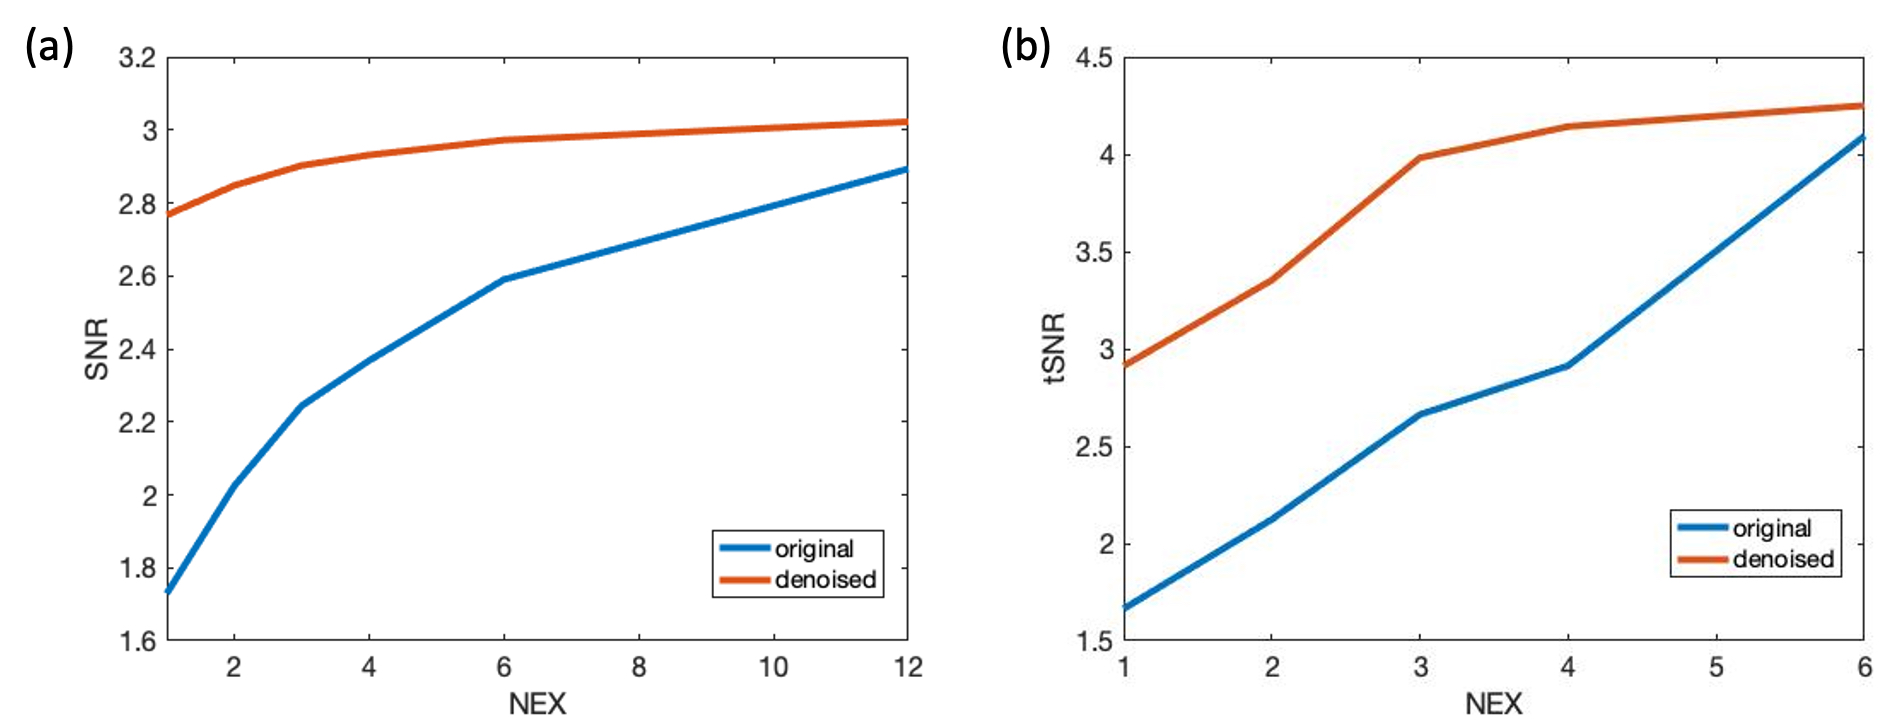
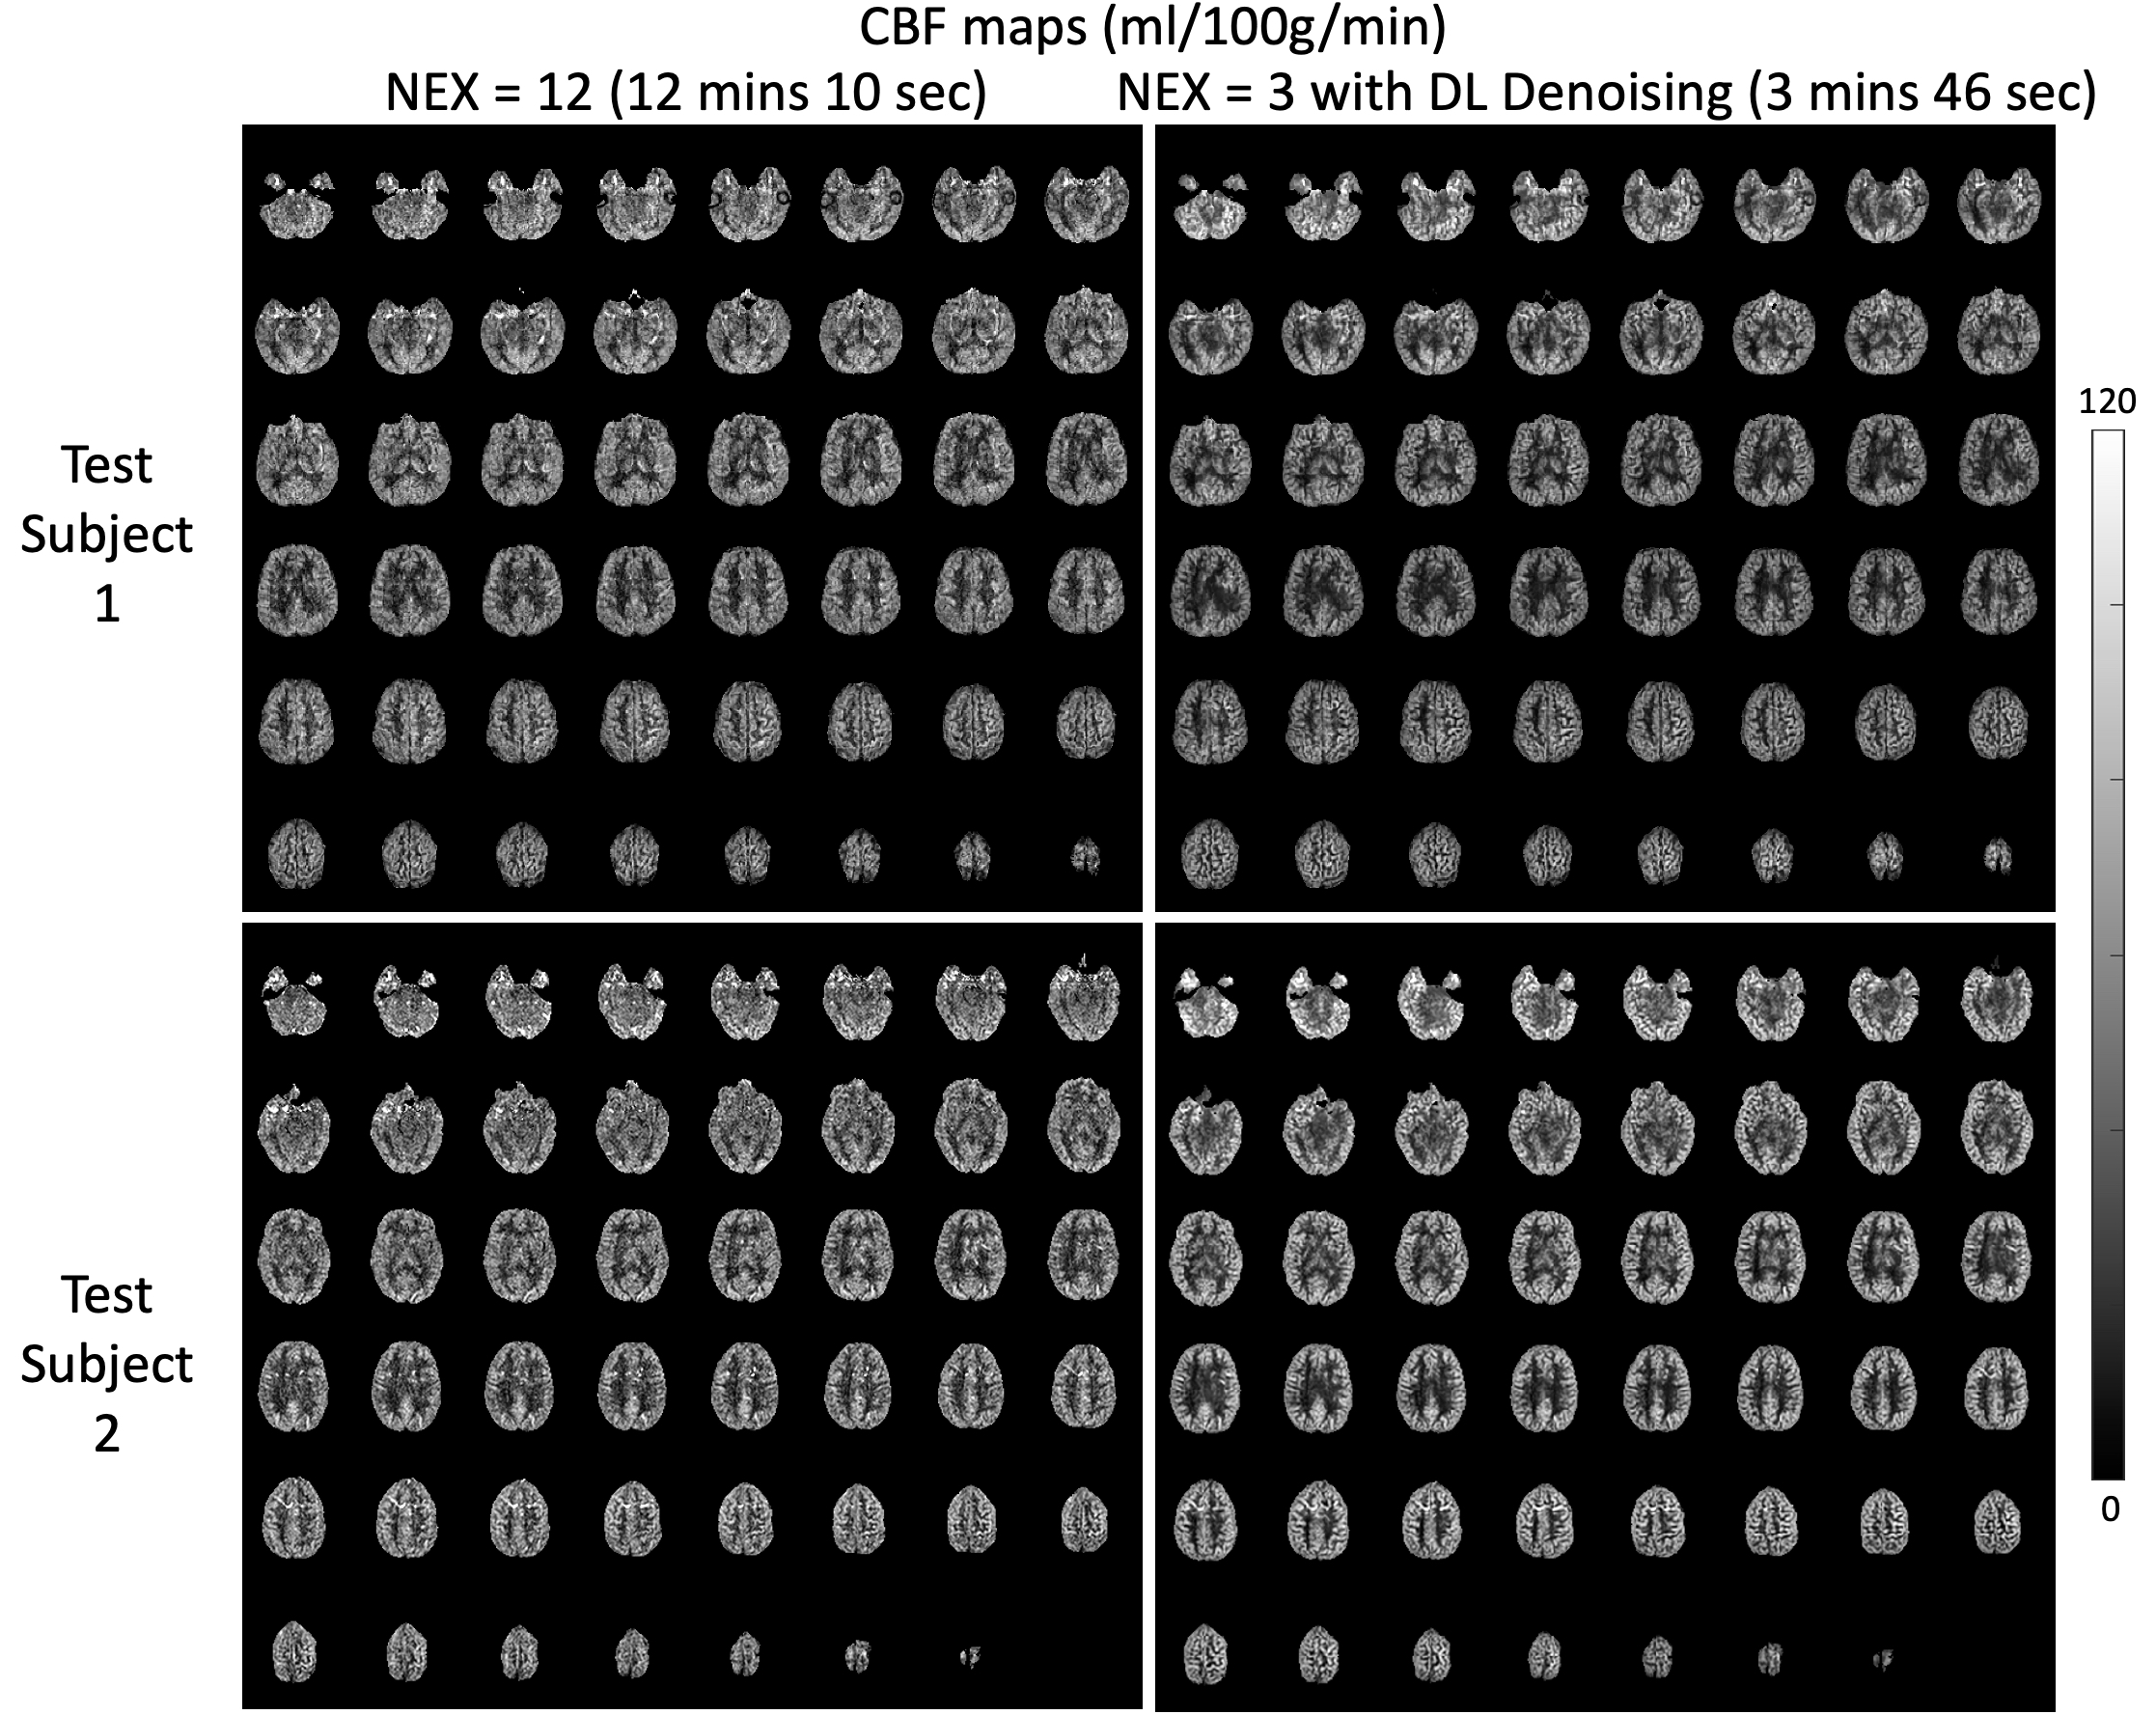
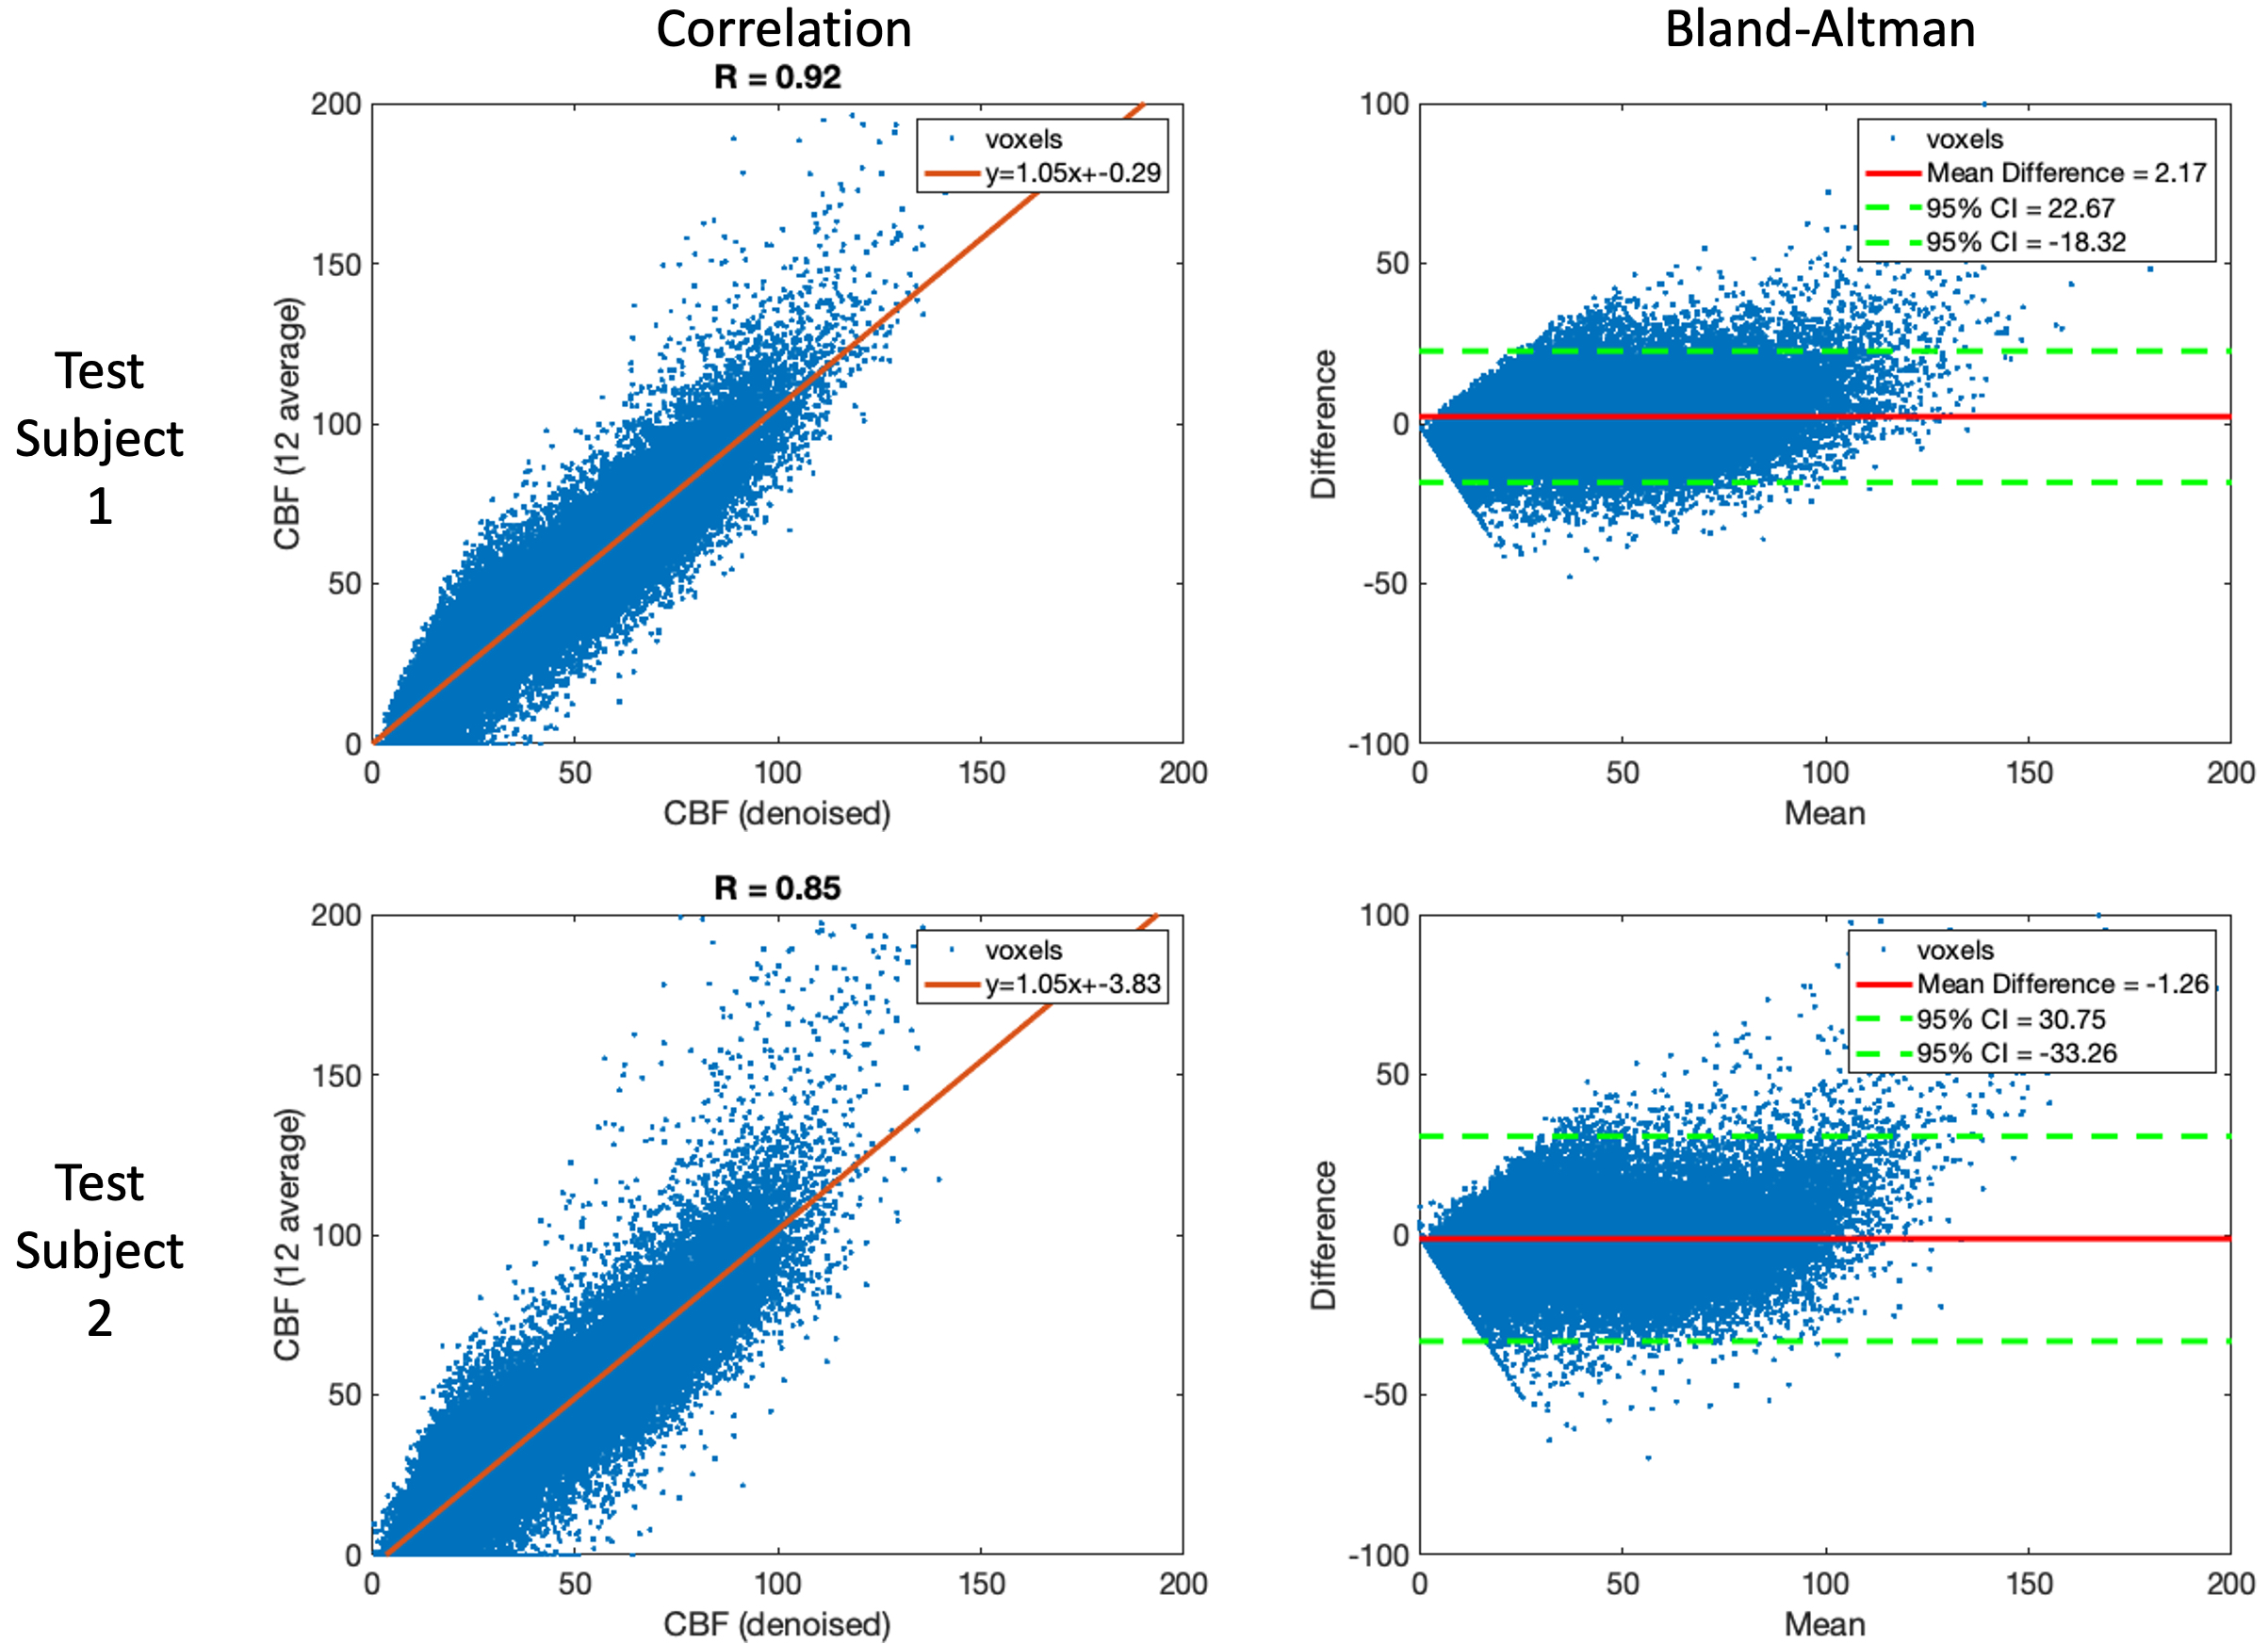
A representative slice of the testing PWI before and after DL denoising are shown in Fig.2, where the performance of DL on the single repetition (NEX=1) and the average of multiple repetitions with NEX=2, 3, 4, 6, and 12 can be appreciated. DL dramatically improved SNR of NEX=1 to the level comparable to that of the reference (NEX=12). However, due to the physiological fluctuation across repetitions, averaging of a few repetitions may be desired for DL to minimize the temporal variation. These observations were consistent with the tSNR and SNR measurements averaged across the two subjects shown in Fig.3. DL increased SNR of the PWI with NEX=1 from 1.7 to 2.8 which is only 0.1 lower than that of the PWI with NEX=12. However, DL provided a moderate increase of SNR from 2.8 to 3.0 with the increase of NEX from 2 to 12. On the other hand, a NEX≥3 was needed for DL to converge tSNR to ~4. The result suggests DL may reduce the required number of PWIs and scan time to 3 and 3 min 46 sec, respectively.Figure 4 shows the CBF maps of the reference and DL denoised PWI with NEX=3. Compared to the former, the latter shows a comparable SNR and image sharpness. Anatomical details without distortion throughout the whole brain, such as orbitofrontal cortex, choroid plexus, cerebellum, and gyri, that can be seen in the reference were well-preserved after DL denoising. The measured mean CBF values of the two subjects were 48.9 and 47.0 ml/100g/min for the reference respectively, and 46.7 and 48.3 ml/100g/min for the DL denoised PWIs respectively. The voxel-wise correlation plots in Fig.5 show a strong correlation R of 0.92 and 0.85 for the two subjects, respectively. The voxel-wise Bland-Altman plots in Fig.5 show a negligible average discrepancy of -1.26 and 2.17 ml/100g/min for the two subjects, respectively, between the two CBF maps and relatively narrow limits of agreement considering the low SNR nature of ASL.
Conclusion
We have developed a DL model for the denoising of ASL. The DL model significantly improved the SNR of the averaged PWI of 3 repetitions to the comparable level of the averaged PWI of 12 repetitions without compromising image sharpness and the loss of anatomical details. The comparison of CBF maps suggested a minimal discrepancy was introduced in quantification by DL. Therefore, with the proposed denoising method, it is possible to acquire a high quality isotropic 2mm whole brain pCASL at 7T in 4 mins.Acknowledgements
This work is supported by National Institute of Health (NIH) grant R01-EB032169 and R01-EB028297.References
1. Xie, Danfeng, et al. "Denoising arterial spin labeling perfusion MRI with deep machine learning." Magnetic resonance imaging 68 (2020): 95-105.
2. Gong, Enhao, et al. "Deep learning and multi-contrast-based denoising for low-SNR Arterial Spin Labeling (ASL) MRI." Medical Imaging 2020: Image Processing. Vol. 11313. SPIE, 2020
3. Lim, Bee, et al. "Enhanced deep residual networks for single image super-resolution." Proceedings of the IEEE conference on computer vision and pattern recognition workshops. 2017.
4. Alsop, David C., et al. "Recommended implementation of arterial spin‐labeled perfusion MRI for clinical applications: a consensus of the ISMRM perfusion study group and the European consortium for ASL in dementia." Magnetic resonance in medicine 73.1 (2015): 102-116.
Figures