2900
Denoising single and multi-delay 3D pCASL using SWIN Transformer1Laboratory of Functional MRI Technology (LOFT), Stevens Neuroimaging and Informatics Institute, University of Southern California, Los Angeles, CA, United States
Synopsis
Keywords: Machine Learning/Artificial Intelligence, Machine Learning/Artificial Intelligence
We developed a Transformer-based deep learning denoising model to improve the SNR for both single and multi-delay perfusion images acquired using 3D pseudo-continuous arterial spin labeling (pCASL). This method can significantly improve SNR (~2-fold) of the perfusion images without introducing bias for CBF and ATT quantification for both single-delay and multi-delay 3D pCASL. Further training and testing of this model on clinical datasets acquired on different vendor platforms is warranted.Introduction
Pseudo Continuous Arterial Spin Labeling (pCASL) is a promising imaging technique for quantification of cerebral blow flow (CBF) but suffers from low signal-to-noise ratio (SNR). Single delay pCASL has been widely applied with adequate repetitions to achieve sufficient SNR. Multi-delay ASL was proposed to achieve more accurate quantification of both CBF and arterial transit time (ATT)1. However, acquiring multiple-delay images will sacrifice the number of averages resulting in insufficient SNR. Previous studies have shown the feasibility of using deep learning (DL) to improve SNR for ASL images2. In this study, we developed a generalized DL denoising scheme for both single and multi-delay 3D pCASL to improve the image quality of CBF and ATT maps without compromising the quantification accuracy using a Transformer based neural network.Methods
Data and preprocessingFor training data, single delay pCASL images were acquired on a 3T Siemens Prisma scanner with the following parameters: 3D GRASE readout with spatial resolution of 2.5×2.5×2.5 mm3, matrix size 96×96×48, labeling duration of 1500ms and post labeling delay (PLD) of 2000ms, 7 control-label pairs were acquired3. The perfusion images were calculated by subtraction of control and label images following quality control procedures (images with large motion artifacts or intensity variation across time points were excluded). Each perfusion image was used as the training data and the average of the 7 perfusion images were served as the reference. The top and bottom 10% of the image slices were removed for the training due to the insufficient SNR. A total of 45 subjects with repeated MRI scans were included. There was a total of 14469 slices of images for training and 672 slices for validation from this cohort.
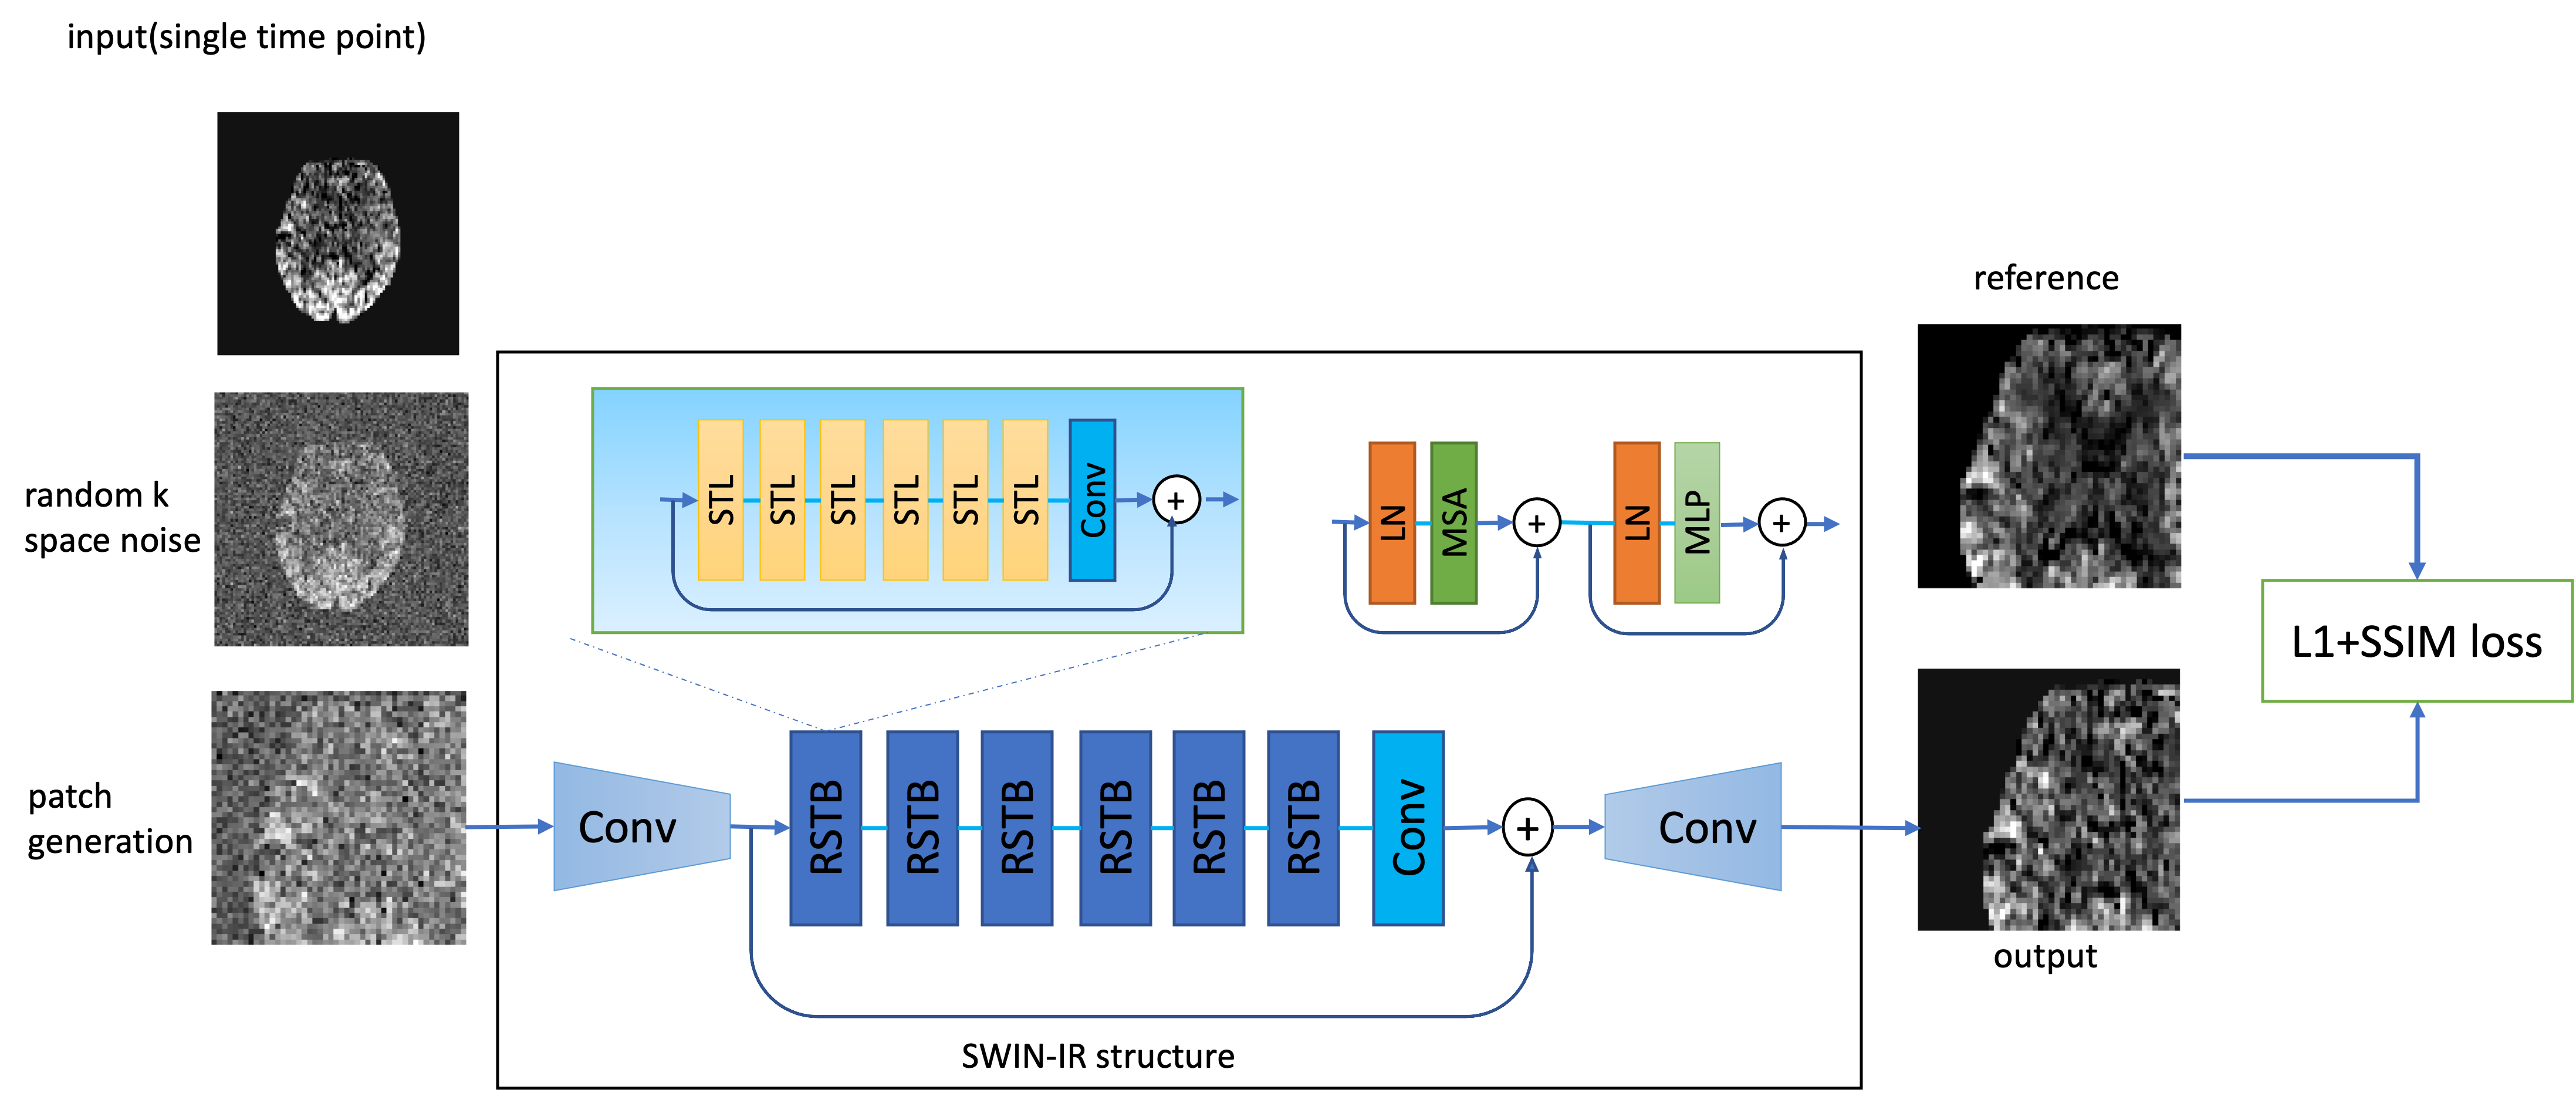
Network and training
The training framework is shown in Figure 1. We utilized a transformer-based network called SWIN-IR4, which uses shifted window to improve the performance of regular vision transformer and has shown to have superior performance than CNN-based networks5. Random k-space Gaussian white noise was added to simulate for different SNR conditions. A 48×48 paired patch was generated for each input image during each iteration. The loss function used for the training was L1+SSIM to preserve both whole image similarity and sharpness.
Evaluation
The model performance was evaluated on three different datasets. First was a separate test dataset with the identical imaging protocol as the training dataset (2 subjects with 672 slices). The second was acquired with a different protocol with a labeling duration of 1.8s, PLD of 2s and resolution of 2.5×2.5×3 mm3 (20 subjects with test-retest scans and a total of 1610 slices). The third was a multi-delay dataset with a labeling duration of 1.8s and 5 PLDs (0.5, 1, 1.5, 2, 2.5s) (same subjects as the second dataset). The latter two datasets were also acquired on the 3T Siemens Prisma scanner. For the first two datasets, reference images were calculated by averaging all acquired time points, and similarity measurements (peak signal-to-noise ratio (PSNR) and structural similarity index (SSIM)) were calculated from the prediction and reference. Besides, spatial SNR was calculated within the gray matter according to the definition in6, and temporal SNR was calculated by mean perfusion signal divided by standard deviation across time points. For the multi-delay dataset, since no reference image can be used, we compared the visual quality of perfusion images of each PLD and compared the fitted CBF and ATT maps from both the input 5 PLDs and the predicted ones to see if there’s any systematic bias for model prediction.
Results
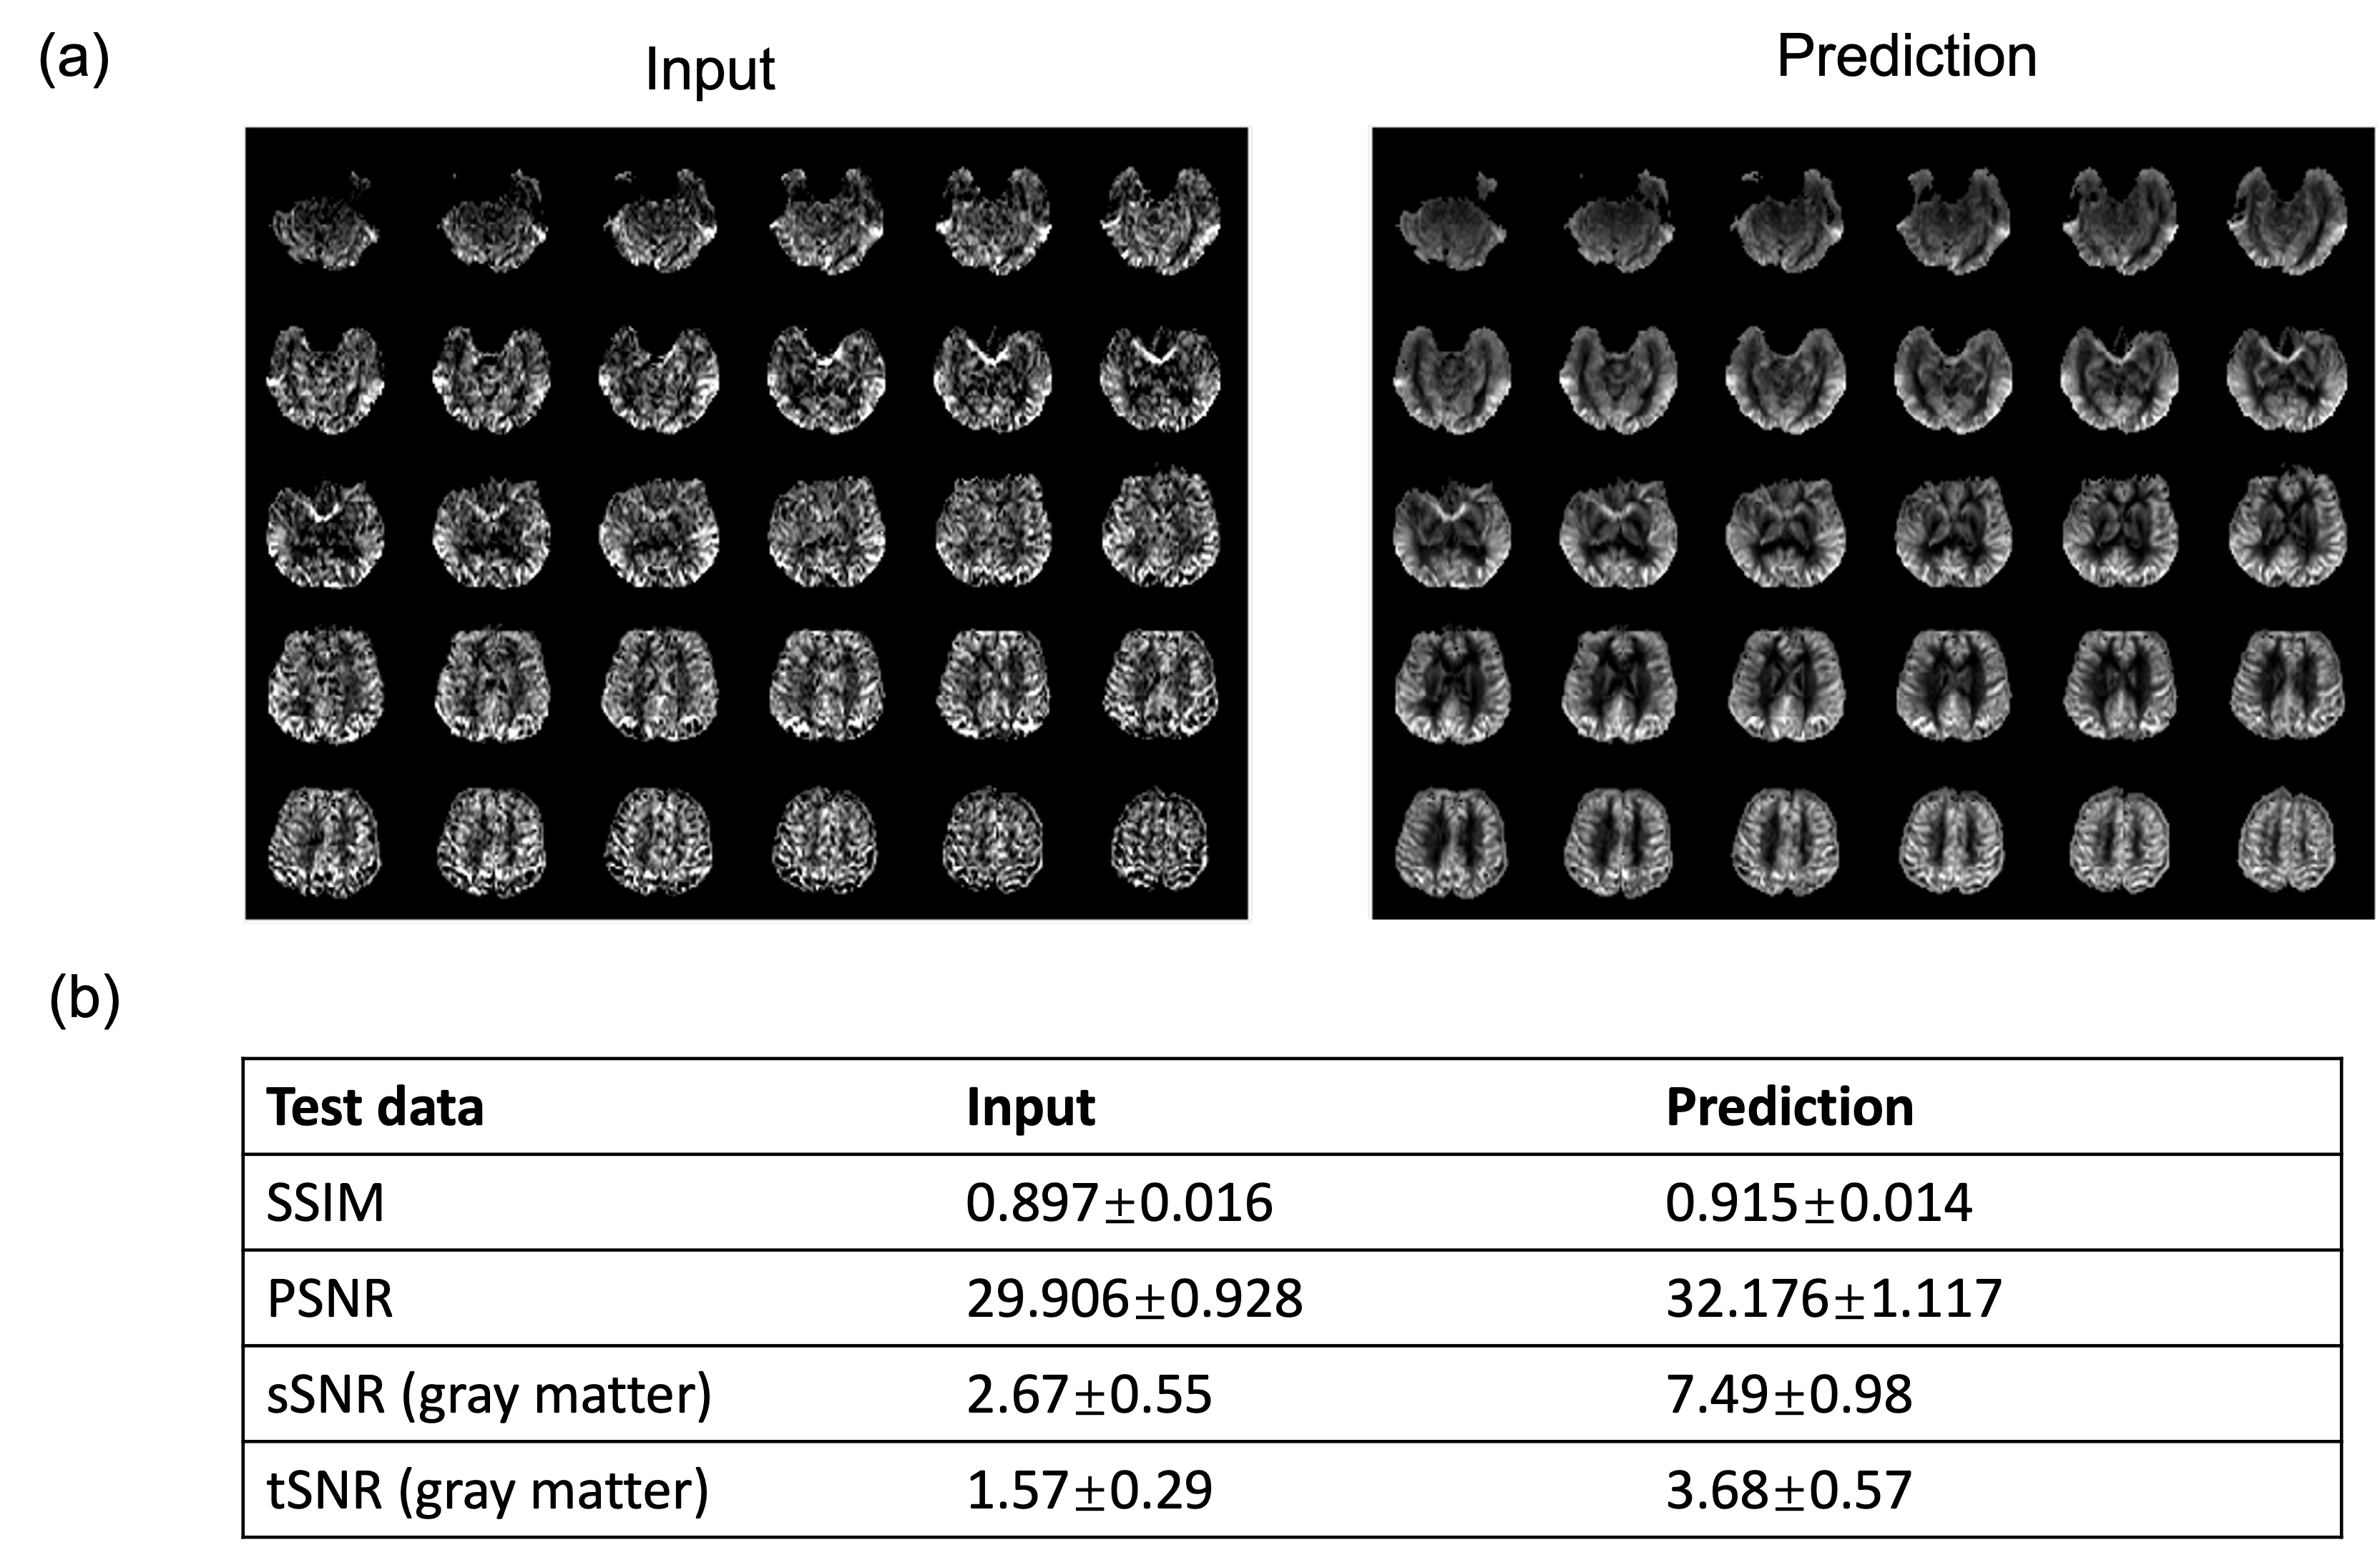
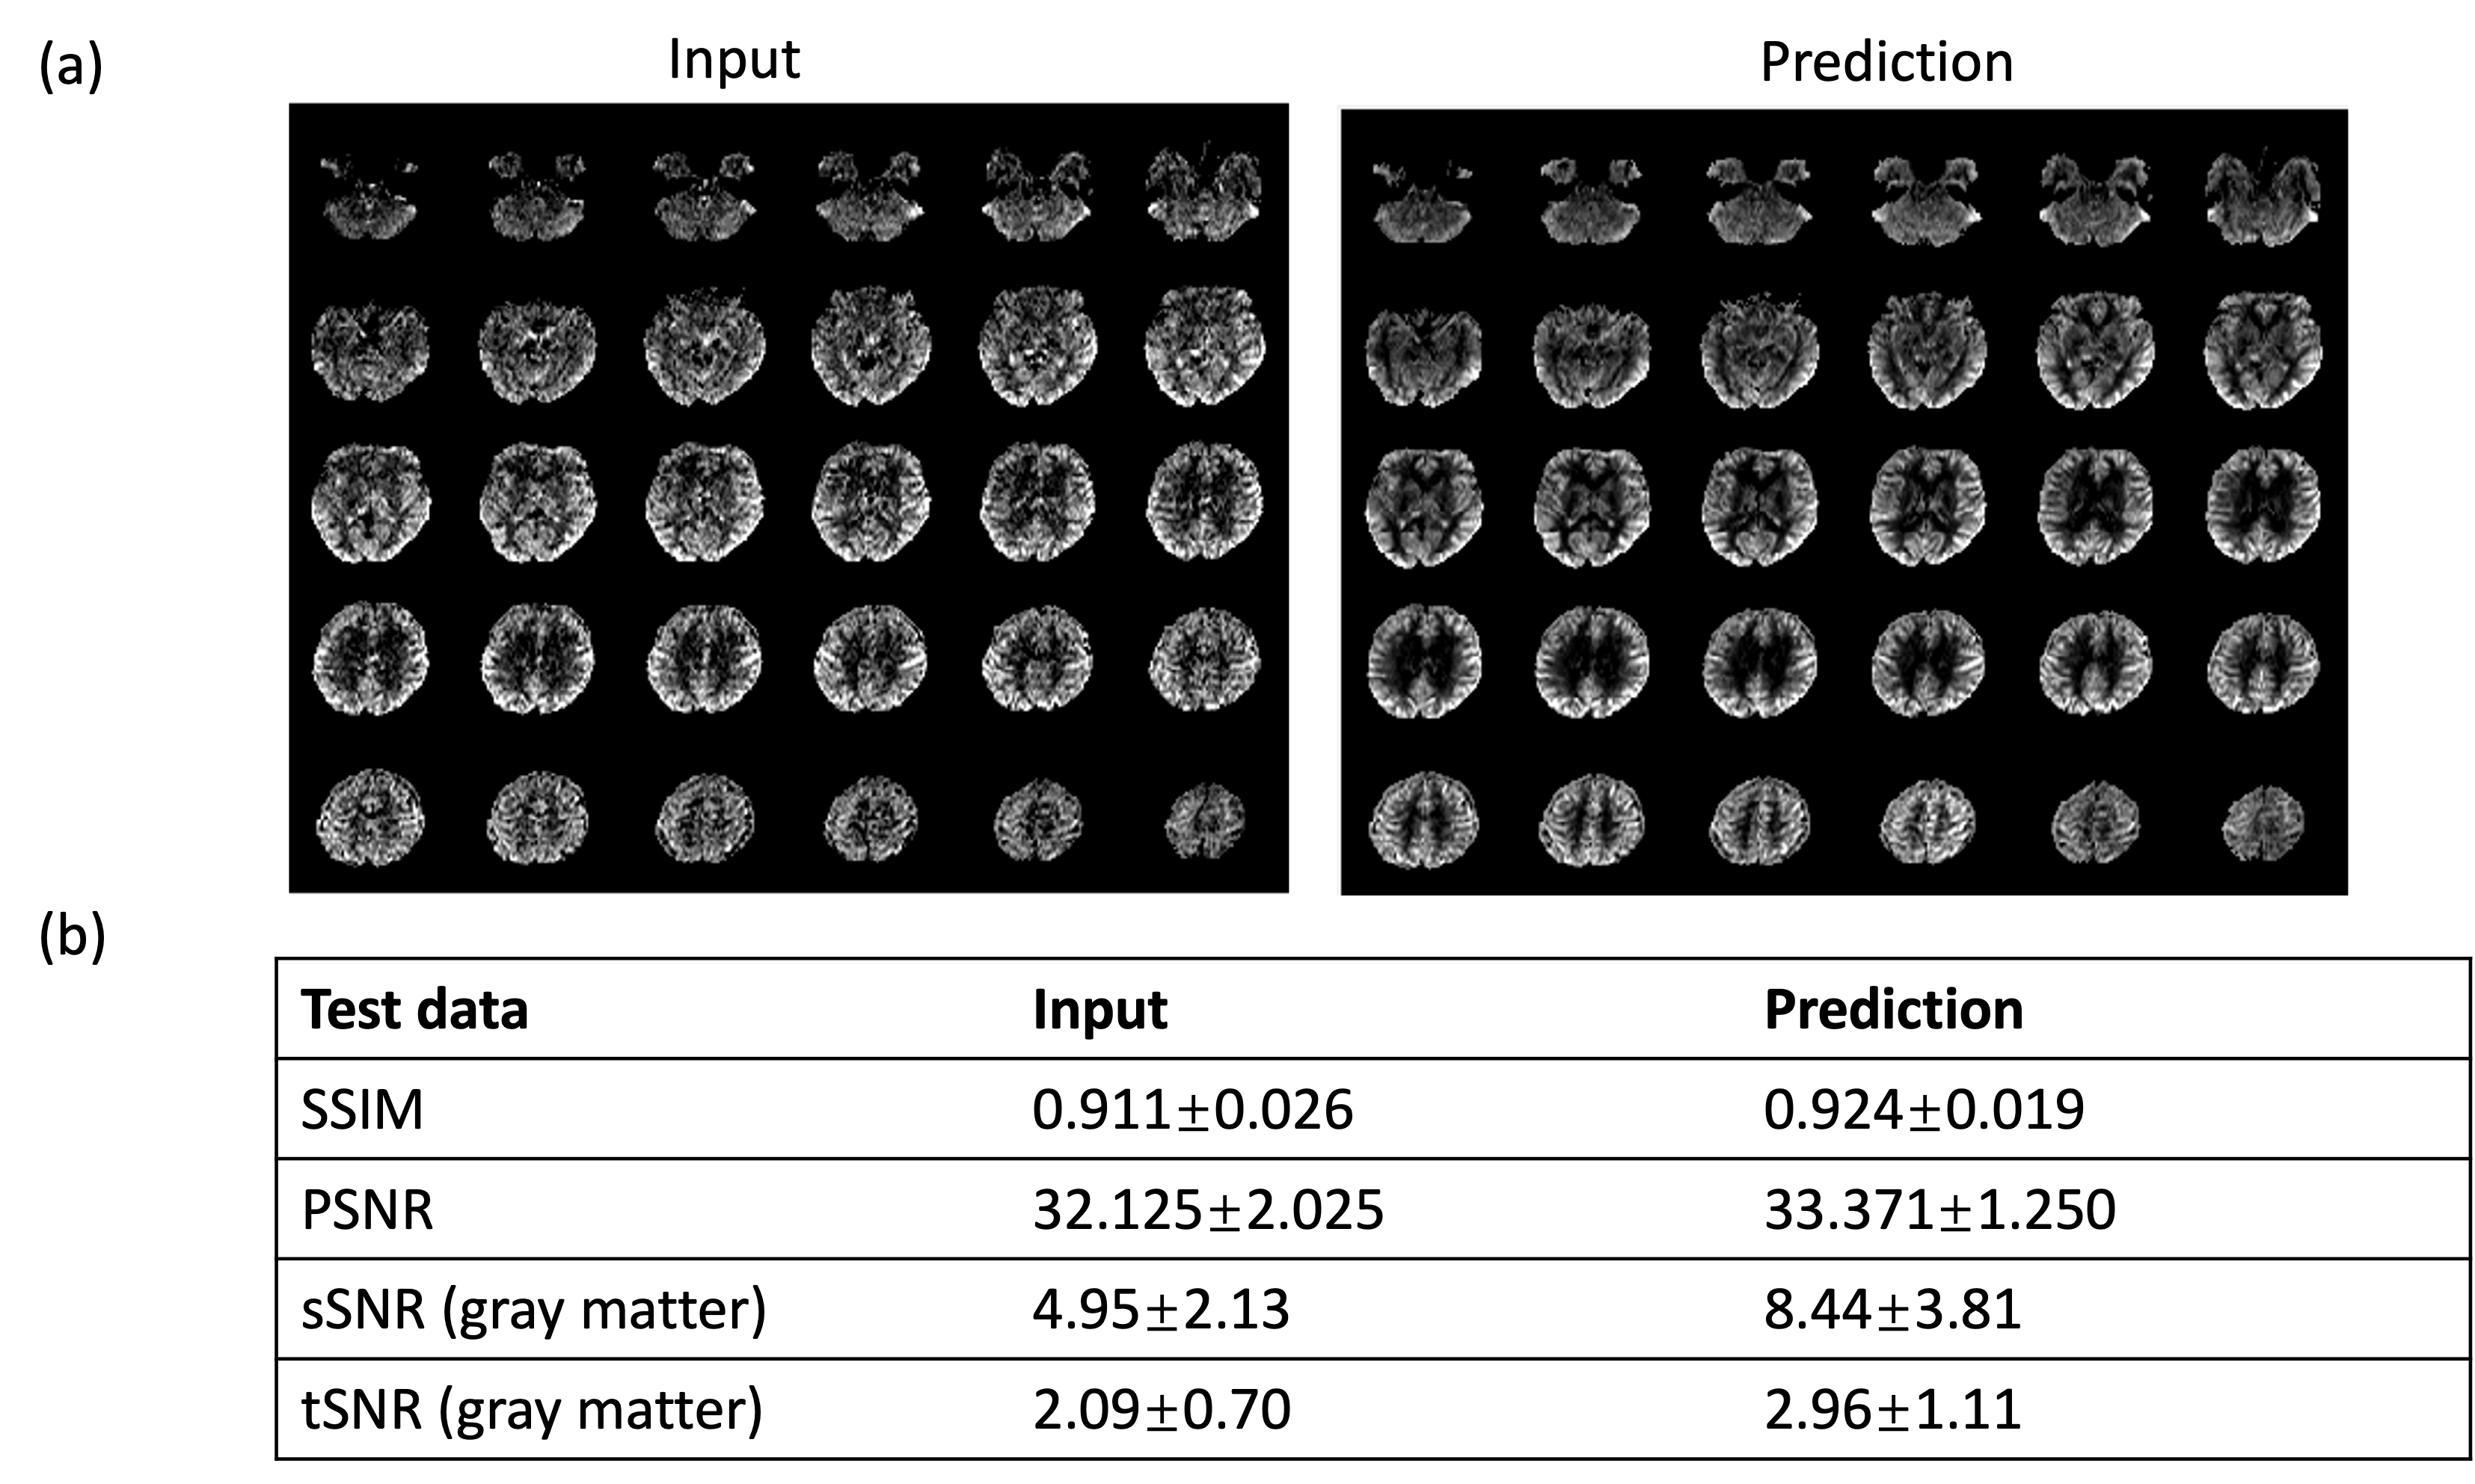
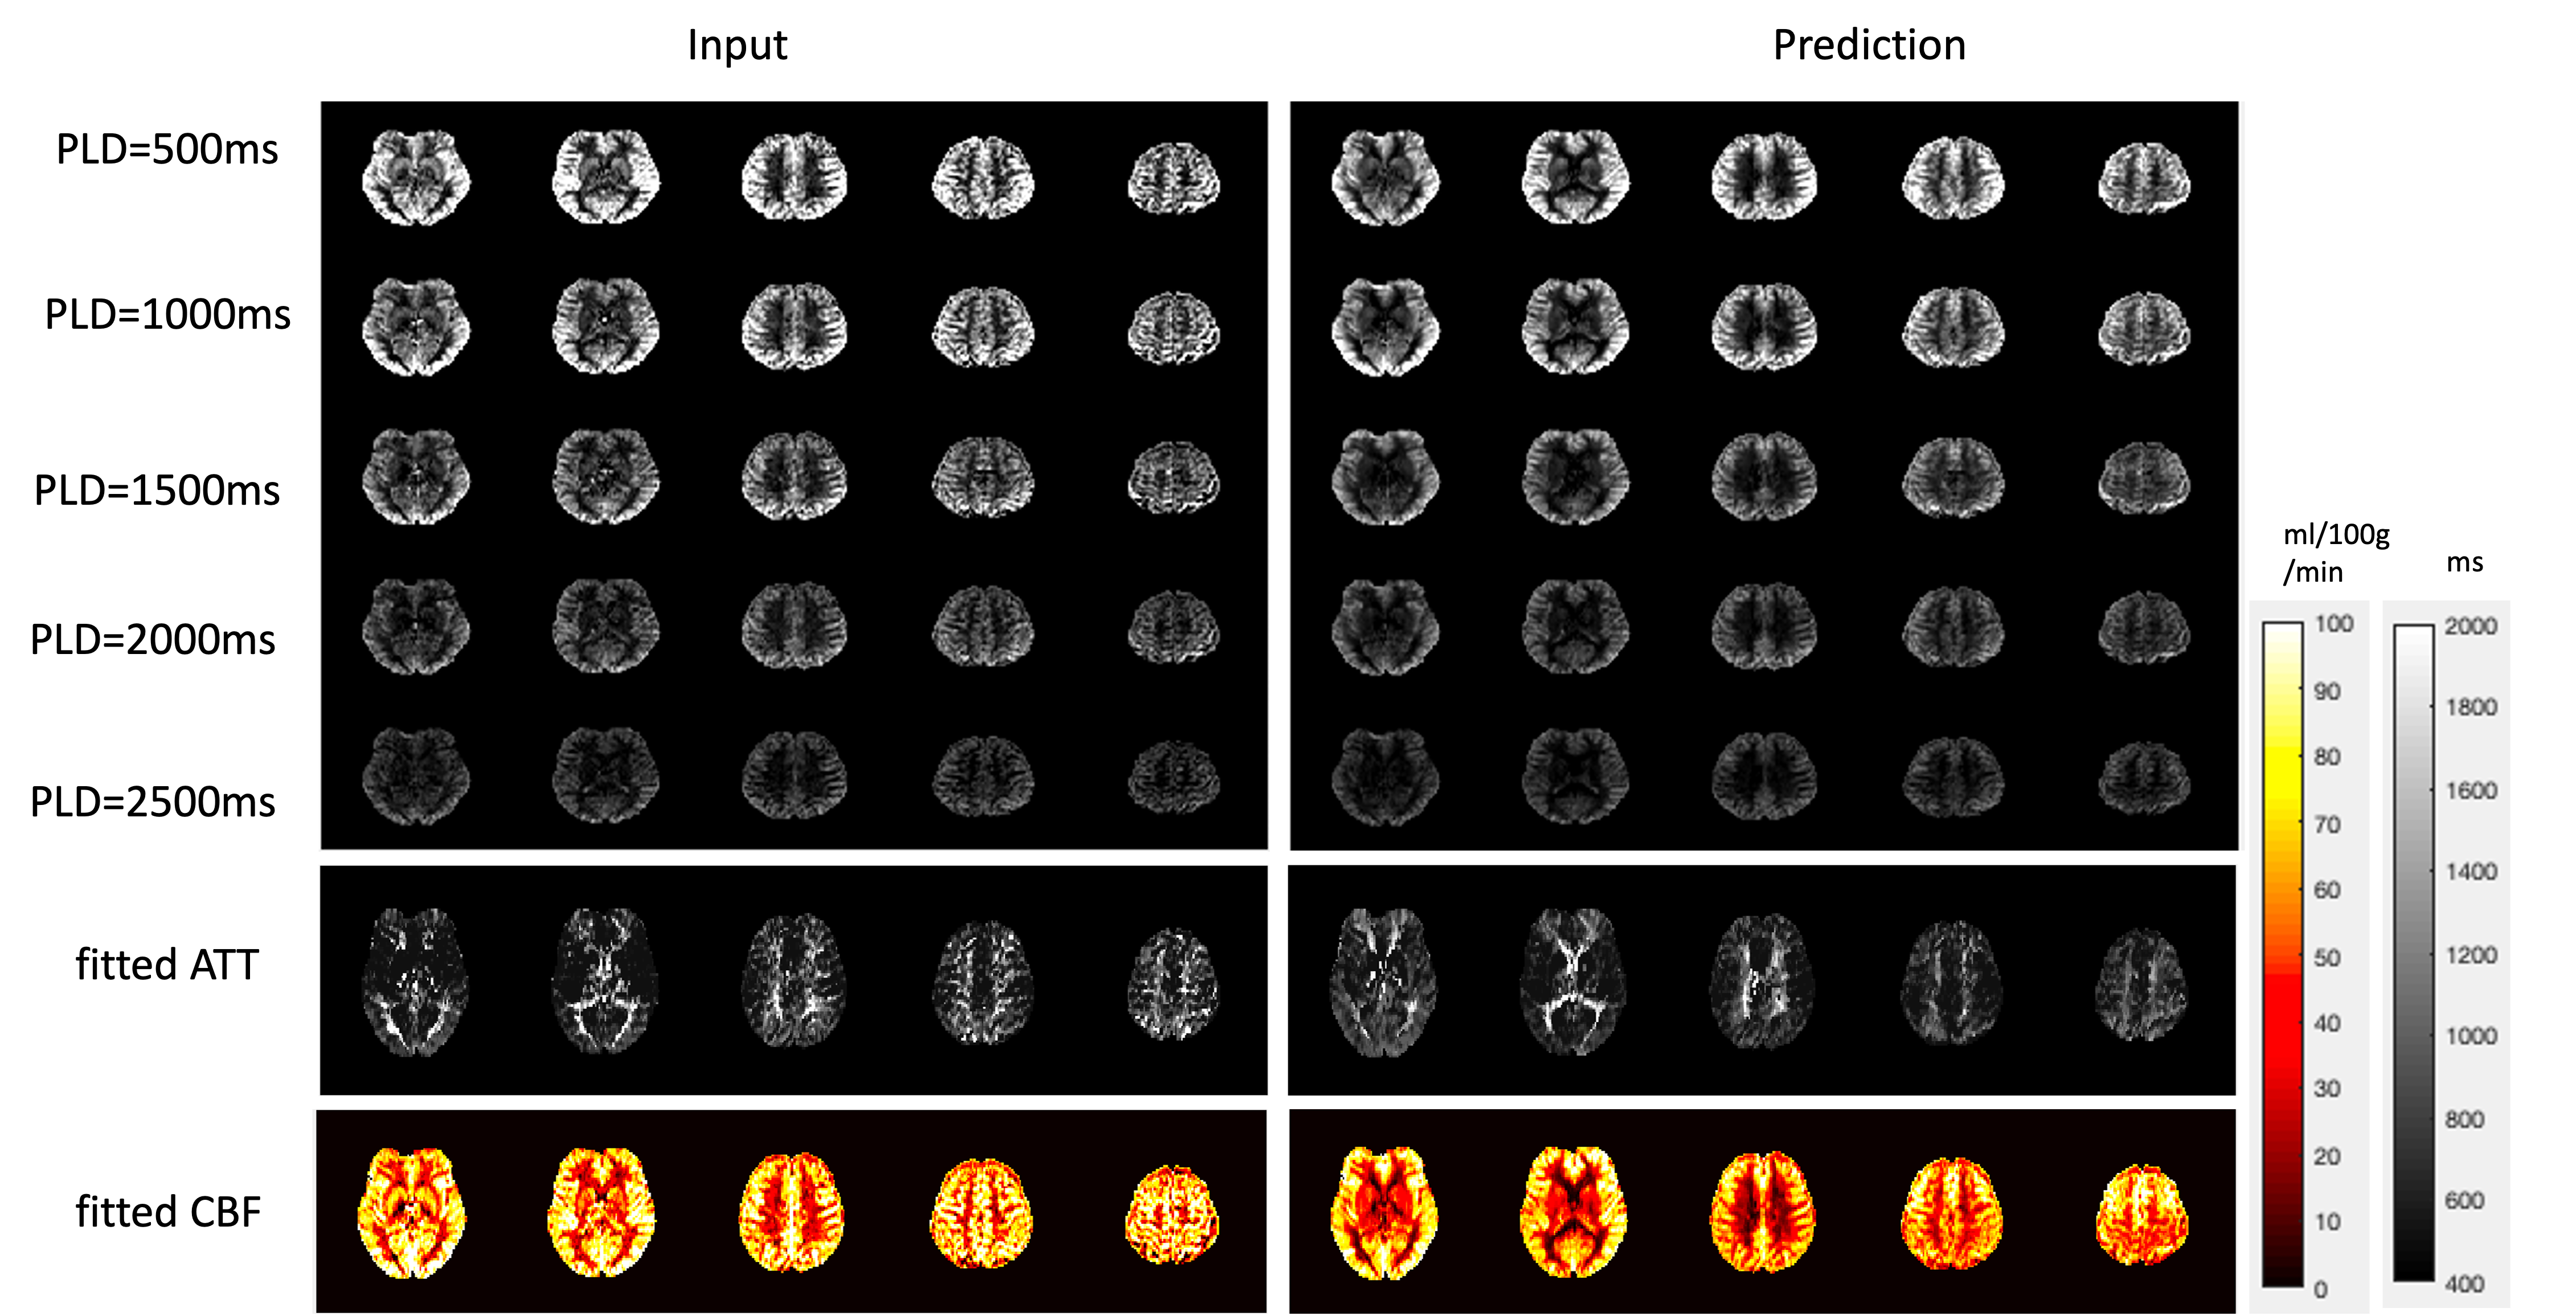
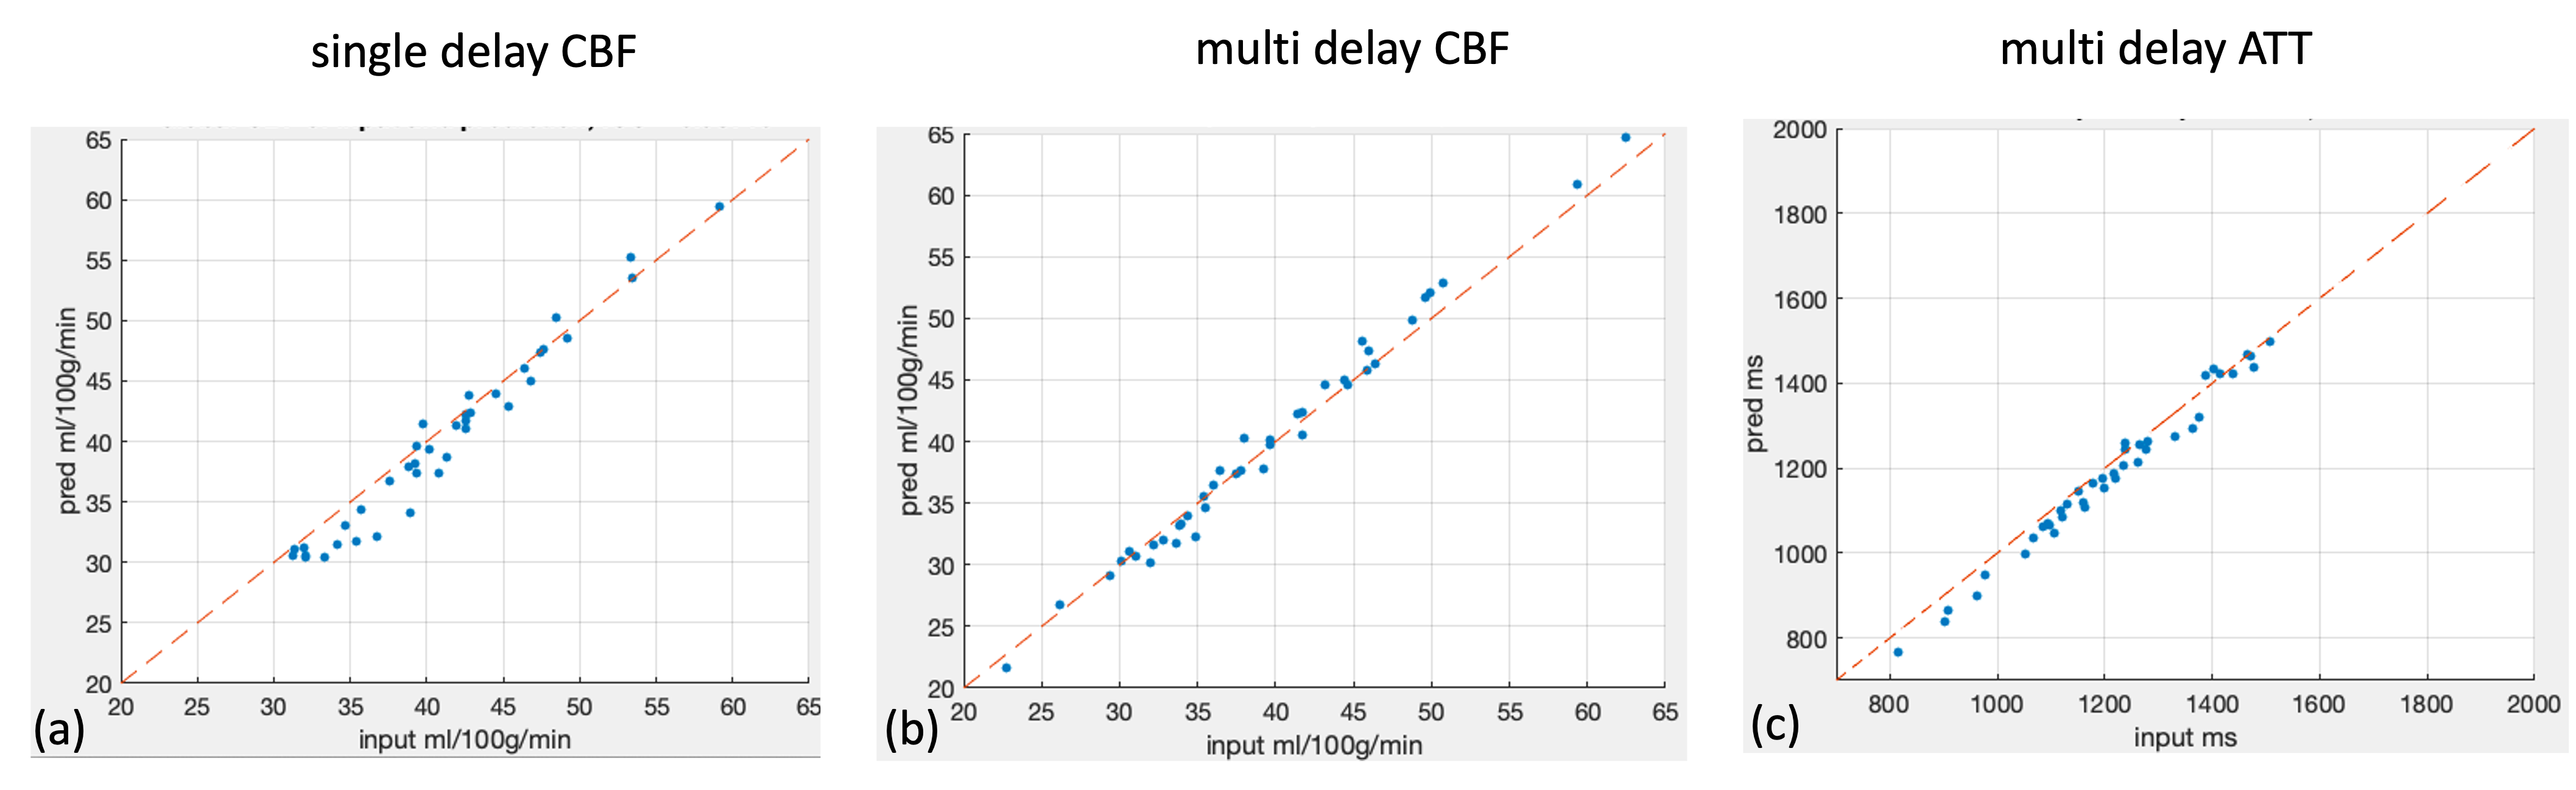
Figure 2 shows the results for the first test dataset, the image for the DL prediction has improved SNR compared to the input. The similarities metrics are also consistent with the visual quality, SSIM and PSNR after DL denoising were improved by 2% and 7.6%, while spatial and temporal SNR were improved by 181% and 134% respectively. Figure 3 shows the results for the second dataset, SSIM and PSNR were improved by 1.4% and 3.9%, while spatial and temporal SNR were improved by 71% and 42% respectively. Figure 4 shows the results for the multi-delay dataset. DL prediction has improved the SNR for perfusion images at each PLD, and improved SNR for the fitted CBF and ATT maps. Figure 5a shows that the global CBF values calculated from the DL prediction is highly consistent with those from the single-delay input images. Figure 5b and 5c show that the fitted CBF and ATT values from the DL predicted multi-delay perfusion images are also consistent with those fitted from the input images.Discussion and conclusion
The results from the prediction images show that the trained deep learning network has good capability to denoise ASL images and has a good generalizability to be applied to different imaging protocols with a range of PLDs. The quantitative results also show that the DL network can improve the quality of both perfusion images and the quantitative maps without introducing a systematic bias, making it possible for a wider application of multi-delay protocol instead of single delay to get more accurate CBF and ATT measurements. Further training and testing of this model on clinical datasets acquired on different vendor platforms is warranted.Acknowledgements
No acknowledgement found.References
[1] Wang, Danny JJ, et al. "Multi-delay multi-parametric arterial spin-labeled perfusion MRI in acute ischemic stroke—comparison with dynamic susceptibility contrast enhanced perfusion imaging." NeuroImage: Clinical 3 (2013): 1-7.
[2] Xie, Danfeng, et al. "Denoising arterial spin labeling perfusion MRI with deep machine learning." Magnetic resonance imaging 68 (2020): 95-105.
[3] Jann, Kay, et al. "Evaluation of cerebral blood flow measured by 3D PCASL as biomarker of vascular cognitive impairment and dementia (VCID) in a cohort of elderly latinx subjects at risk of small vessel disease." Frontiers in Neuroscience 15 (2021): 627627.
[4] Liang, Jingyun, et al. "Swinir: Image restoration using swin transformer." Proceedings of the IEEE/CVF International Conference on Computer Vision. 2021.
[5] Liu, Ze, et al. "Swin transformer: Hierarchical vision transformer using shifted windows." Proceedings of the IEEE/CVF International Conference on Computer Vision. 2021.
[6] Glover, Gary H., and Song Lai. "Self‐navigated spiral fMRI: interleaved versus single‐shot." Magnetic resonance in medicine 39.3 (1998): 361-368.
Figures