2899
Six-fold enhancement in spatial-resolution of Pseudo-Continuous Arterial Spin Labeling Perfusion Mapping using a Cryogenic Coil at 9.4T1Champalimaud Research, Champalimaud Foundation, Lisbon, Portugal, 2Institute for Systems and Robotics - Lisboa and Department of Bioengineering, Instituto Superior Técnico, Universidade de Lisboa, Lisbon, Portugal, 3C.J. Gorter MRI Center for High Field MRI, Department of Radiology, Leiden University Medical Center, Leiden, Netherlands, 4Inserm, Grenoble Institut des Neurosciences, Université Grenoble Alpes, Grenoble, France
Synopsis
Keywords: Data Acquisition, Arterial spin labelling, Preclinical
High resolution CBF mapping using ASL can benefit multitude applications, yet its spatiotemporal resolution is limited in pre-clinical settings and at higher fields. To address this issue, we explored the possibility of improving the resolution of pCASL by using a cryogenic coil at 9.4T in the rat brain. Compared to the current state-of-the-art measurements, we managed to enhance the resolution of pCASL images by a factor of at least 6. The interpulse phase optimizations applied at the labelling plane are crucial for higher and stable inversion efficiency.Introduction
Pseudo-continuous arterial spin labelling (pCASL) is the state-of-the-art method for perfusion imaging1. Compared with other ASL schemes, pCASL provides higher signal-to-noise ratio (SNR) than Pulsed ASL (PASL)2 and does not require a separate labelling coil for multi-slice acquisitions as opposed to Continuous ASL (CASL)3, while keeping a precisely-defined bolus duration. Increasing pCASL’s spatiotemporal resolution could benefit many applications. In preclinical MRI, pCASL perfusion measurements are particularly challenging due to specific brain geometry constrains, along with the higher fields that exacerbate B0 inhomogeneities at the labelling plane and off-resonance effects that affect the inversion efficiency (IE)2. Additionally, the reduced SNR of the acquisitions significantly limits the achievable spatial resolution4. To address this issue, we explore the possibility of dramatically improving the resolution of pCASL in preclinical settings by using a cryogenic coil at 9.4T 5,6 combined with a denoising method7.Methods
All animal experiments and care were conducted according to the European Directive 2010/63 and pre-approved by competent authorities.Animal Preparation: Three Long-Evans female rats, 6-8 weeks old, weight: 200-300g were used. Rats were sedated using $$$\sim$$$ 2.5% isoflurane and 35% oxygen in medical air, and their respiratory rate was kept at 40-60bpm.
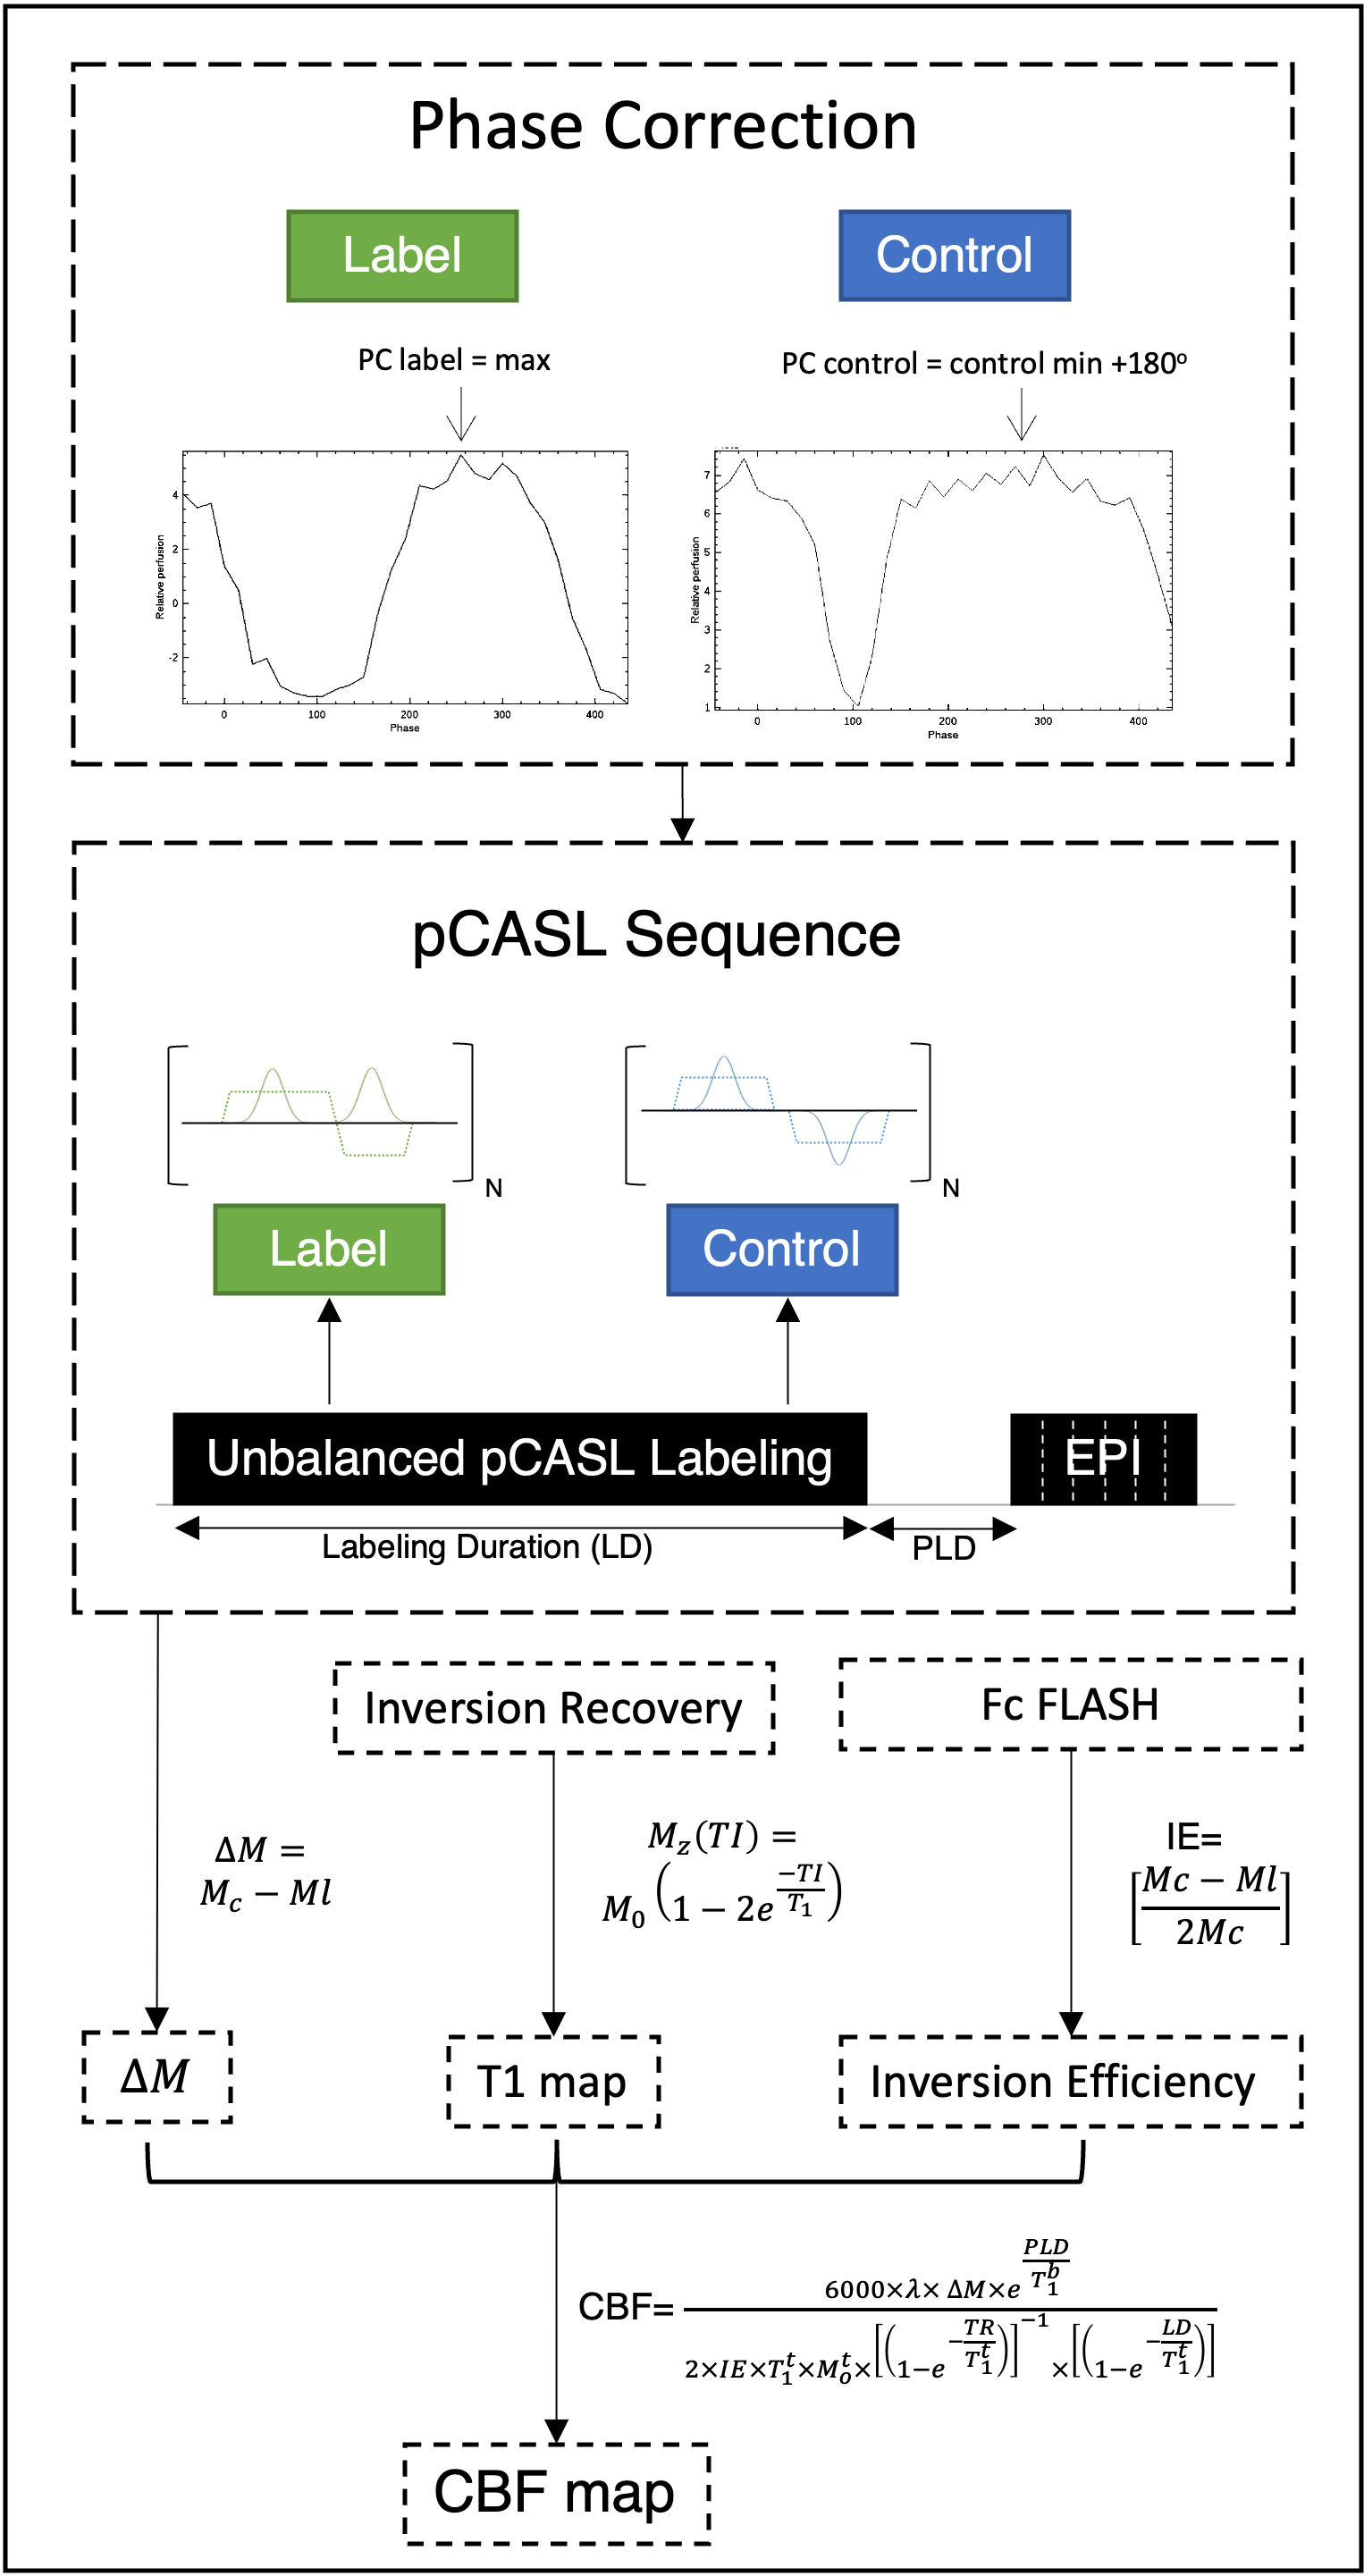
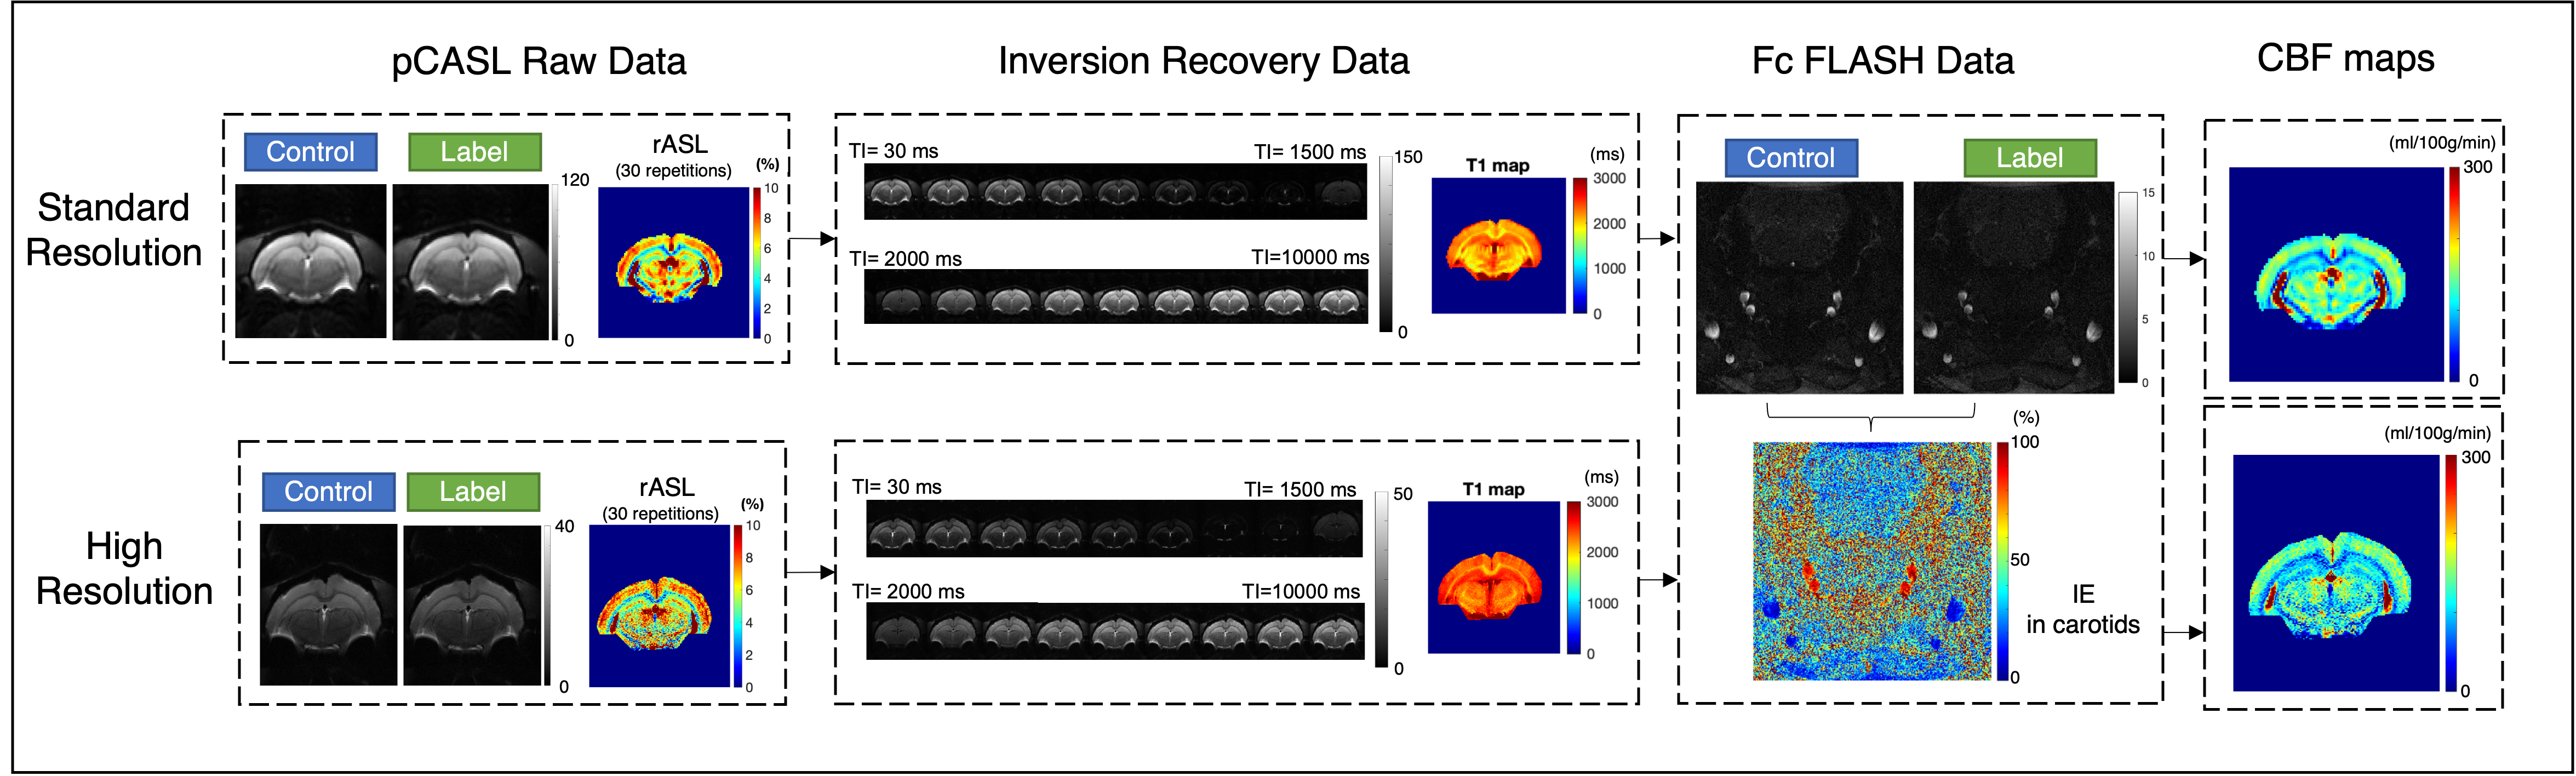
MRI experiments: Experiments were conducted on a 9.4T Bruker Biospec Scanner equipped with an 86mm volume coil for transmittance, a 4-element-array cryogenic coil for signal reception and a gradient system able to generate up to 660mT/m isotropically. An unbalanced pCASL8 sequence was used as described in Hirschler et al.9. The pCASL interpulse phase offsets were adjusted before the pCASL perfusion measurement using 2 pre-scans (label and control) to extract the optimal labelling phase9. For pCASL acquisitions, the labeling plane was positioned at the rat neck (~1.3cm below the isocenter), the labelling duration (LD) was set to 3s followed by a 300ms post-labeling delay (PLD), repetition time (TR)/echo time (TE)= 4000/40ms, 30 repetitions, 4 averages, duration = 16 minutes. The inversion was achieved through a train of Hanning window-shaped pulses: 400μs duration, 800μs pulse rate, B1 of 5μT, $$$G_{max}/G_{ave}$$$ of 45/5 mT/m, where $$$G_{max}$$$ is the gradient applied during the RF pulse. Standard pCASL acquisitions consisted of a single-shot EPI: FOV= 22x22mm2, slice thickness=1mm, matrix= 94x94 resulting in a spatial resolution of 234x234μm2. For 6x higher resolution pCASL, a single-shot EPI was implemented: FOV=19.2x22.0mm2, slice thickness= 0.75mm, matrix= 174x200 resulting in a spatial resolution of 110x110μm2. For cerebral blood flow (CBF) quantification, the required T1 map was obtained from an inversion recovery sequence9. In addition, a pCASL encoded FLASH was employed to estimate the inversion efficiency (IE) 5mm above the labelling plane (PLD of 0ms, LD of 200ms)9.
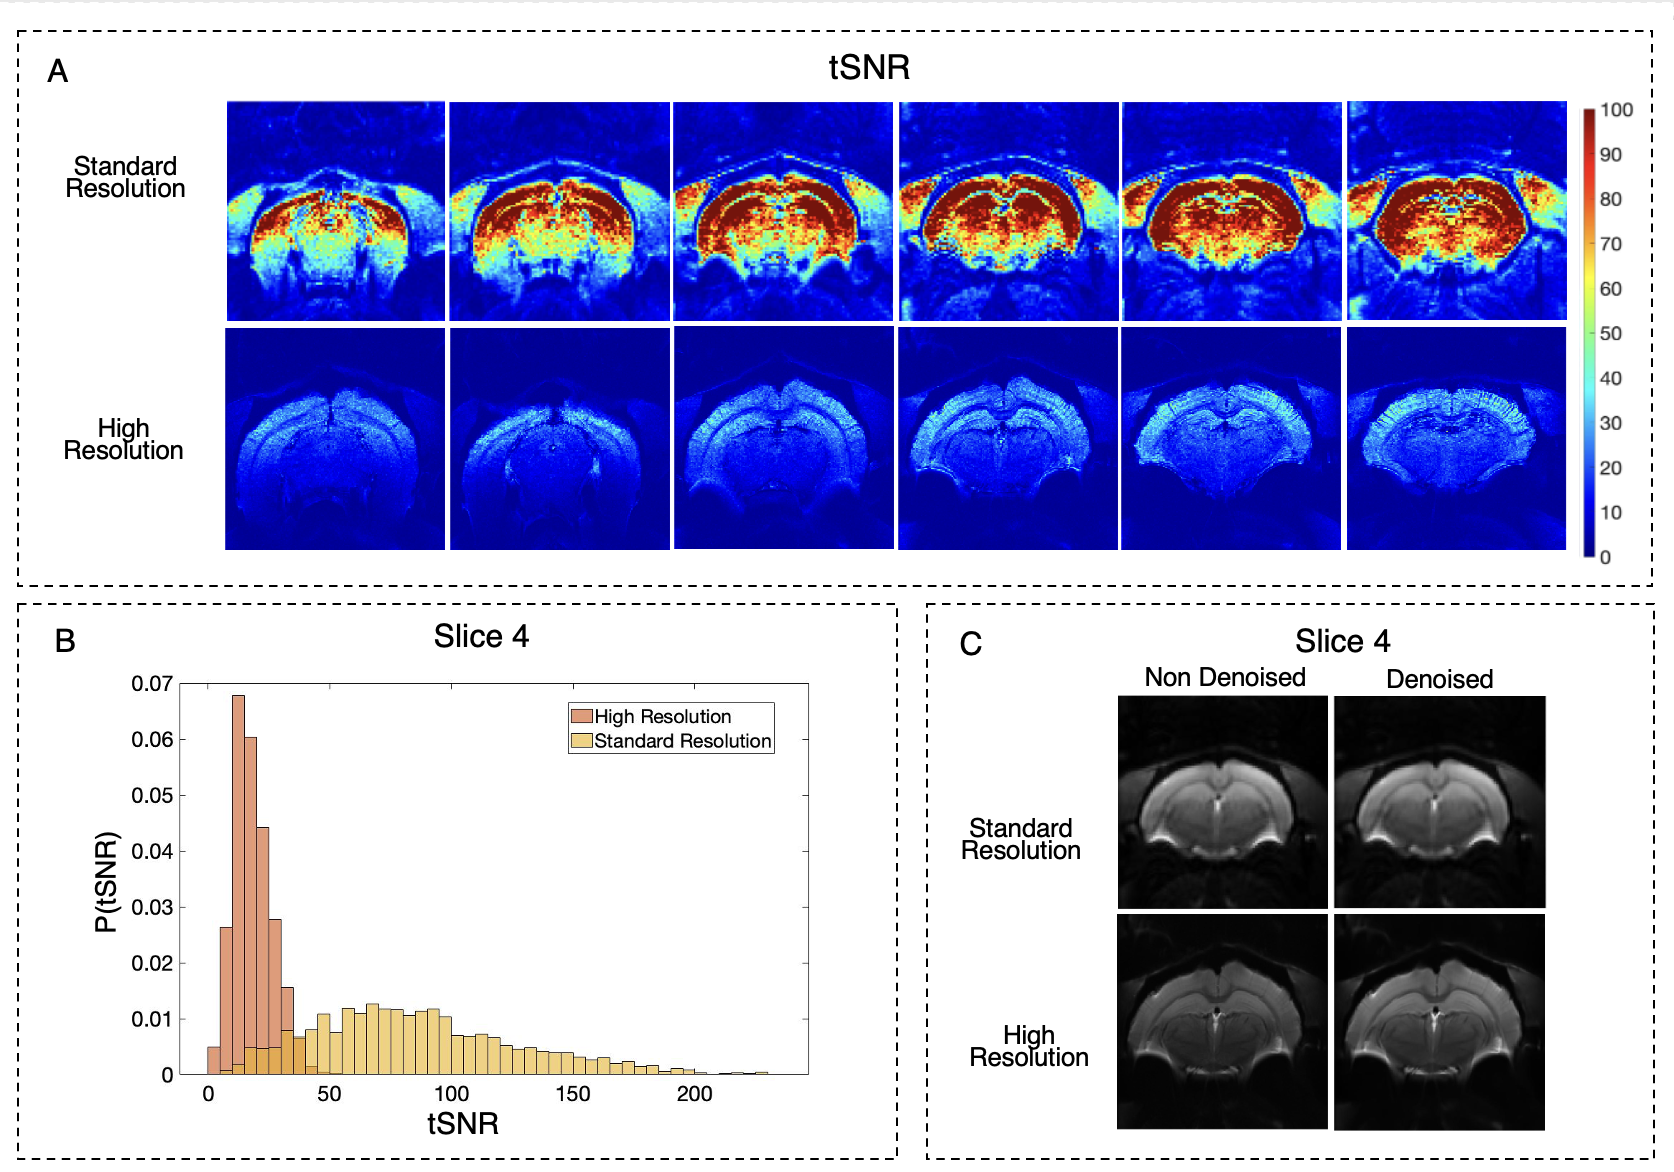
Data Analysis: Temporal SNR (tSNR) maps were calculated pixelwise for the control images in one representative animal: $$$tSNR=\frac{Mean_{signal}}{SD_{signal}}$$$. Raw data was denoised in image space with non-local PCA before CBF calculation7. CBF maps were calculated pixel-by-pixel10 assuming that the equilibrium magnetization of blood can be approximated by $$$\frac{M_0^t}{λ}$$$ where $$$M_0^t$$$ is the tissue magnetization in the average control image and λ is the water blood-tissue partition coefficient (0.9mL/g): $$$CBF(ml/100g/min) =\frac{6000\cdotλ\cdot\Delta M\cdot e^{\frac{PLD}{T_1^b}}}{2\cdot IE\cdot T_1^t\cdot M_0^t\cdot\left(1-e^{-\frac{TR}{T_1^t}}\right)^{-1}\cdot\left(1-e^{-\frac{LD}{T_1^t}}\right)}$$$,
where $$$\Delta M$$$ is the difference in magnitude between control and label images, $$$T_1^b$$$ and $$$T_1^t$$$ are the longitudinal relaxation times of blood (assumed to be 2430ms at 9.4T) and tissue (from the T1 mapping), respectively. The analysis pipeline is presented in Figure 1 and representative images for each step are shown in Figure 2.
Results
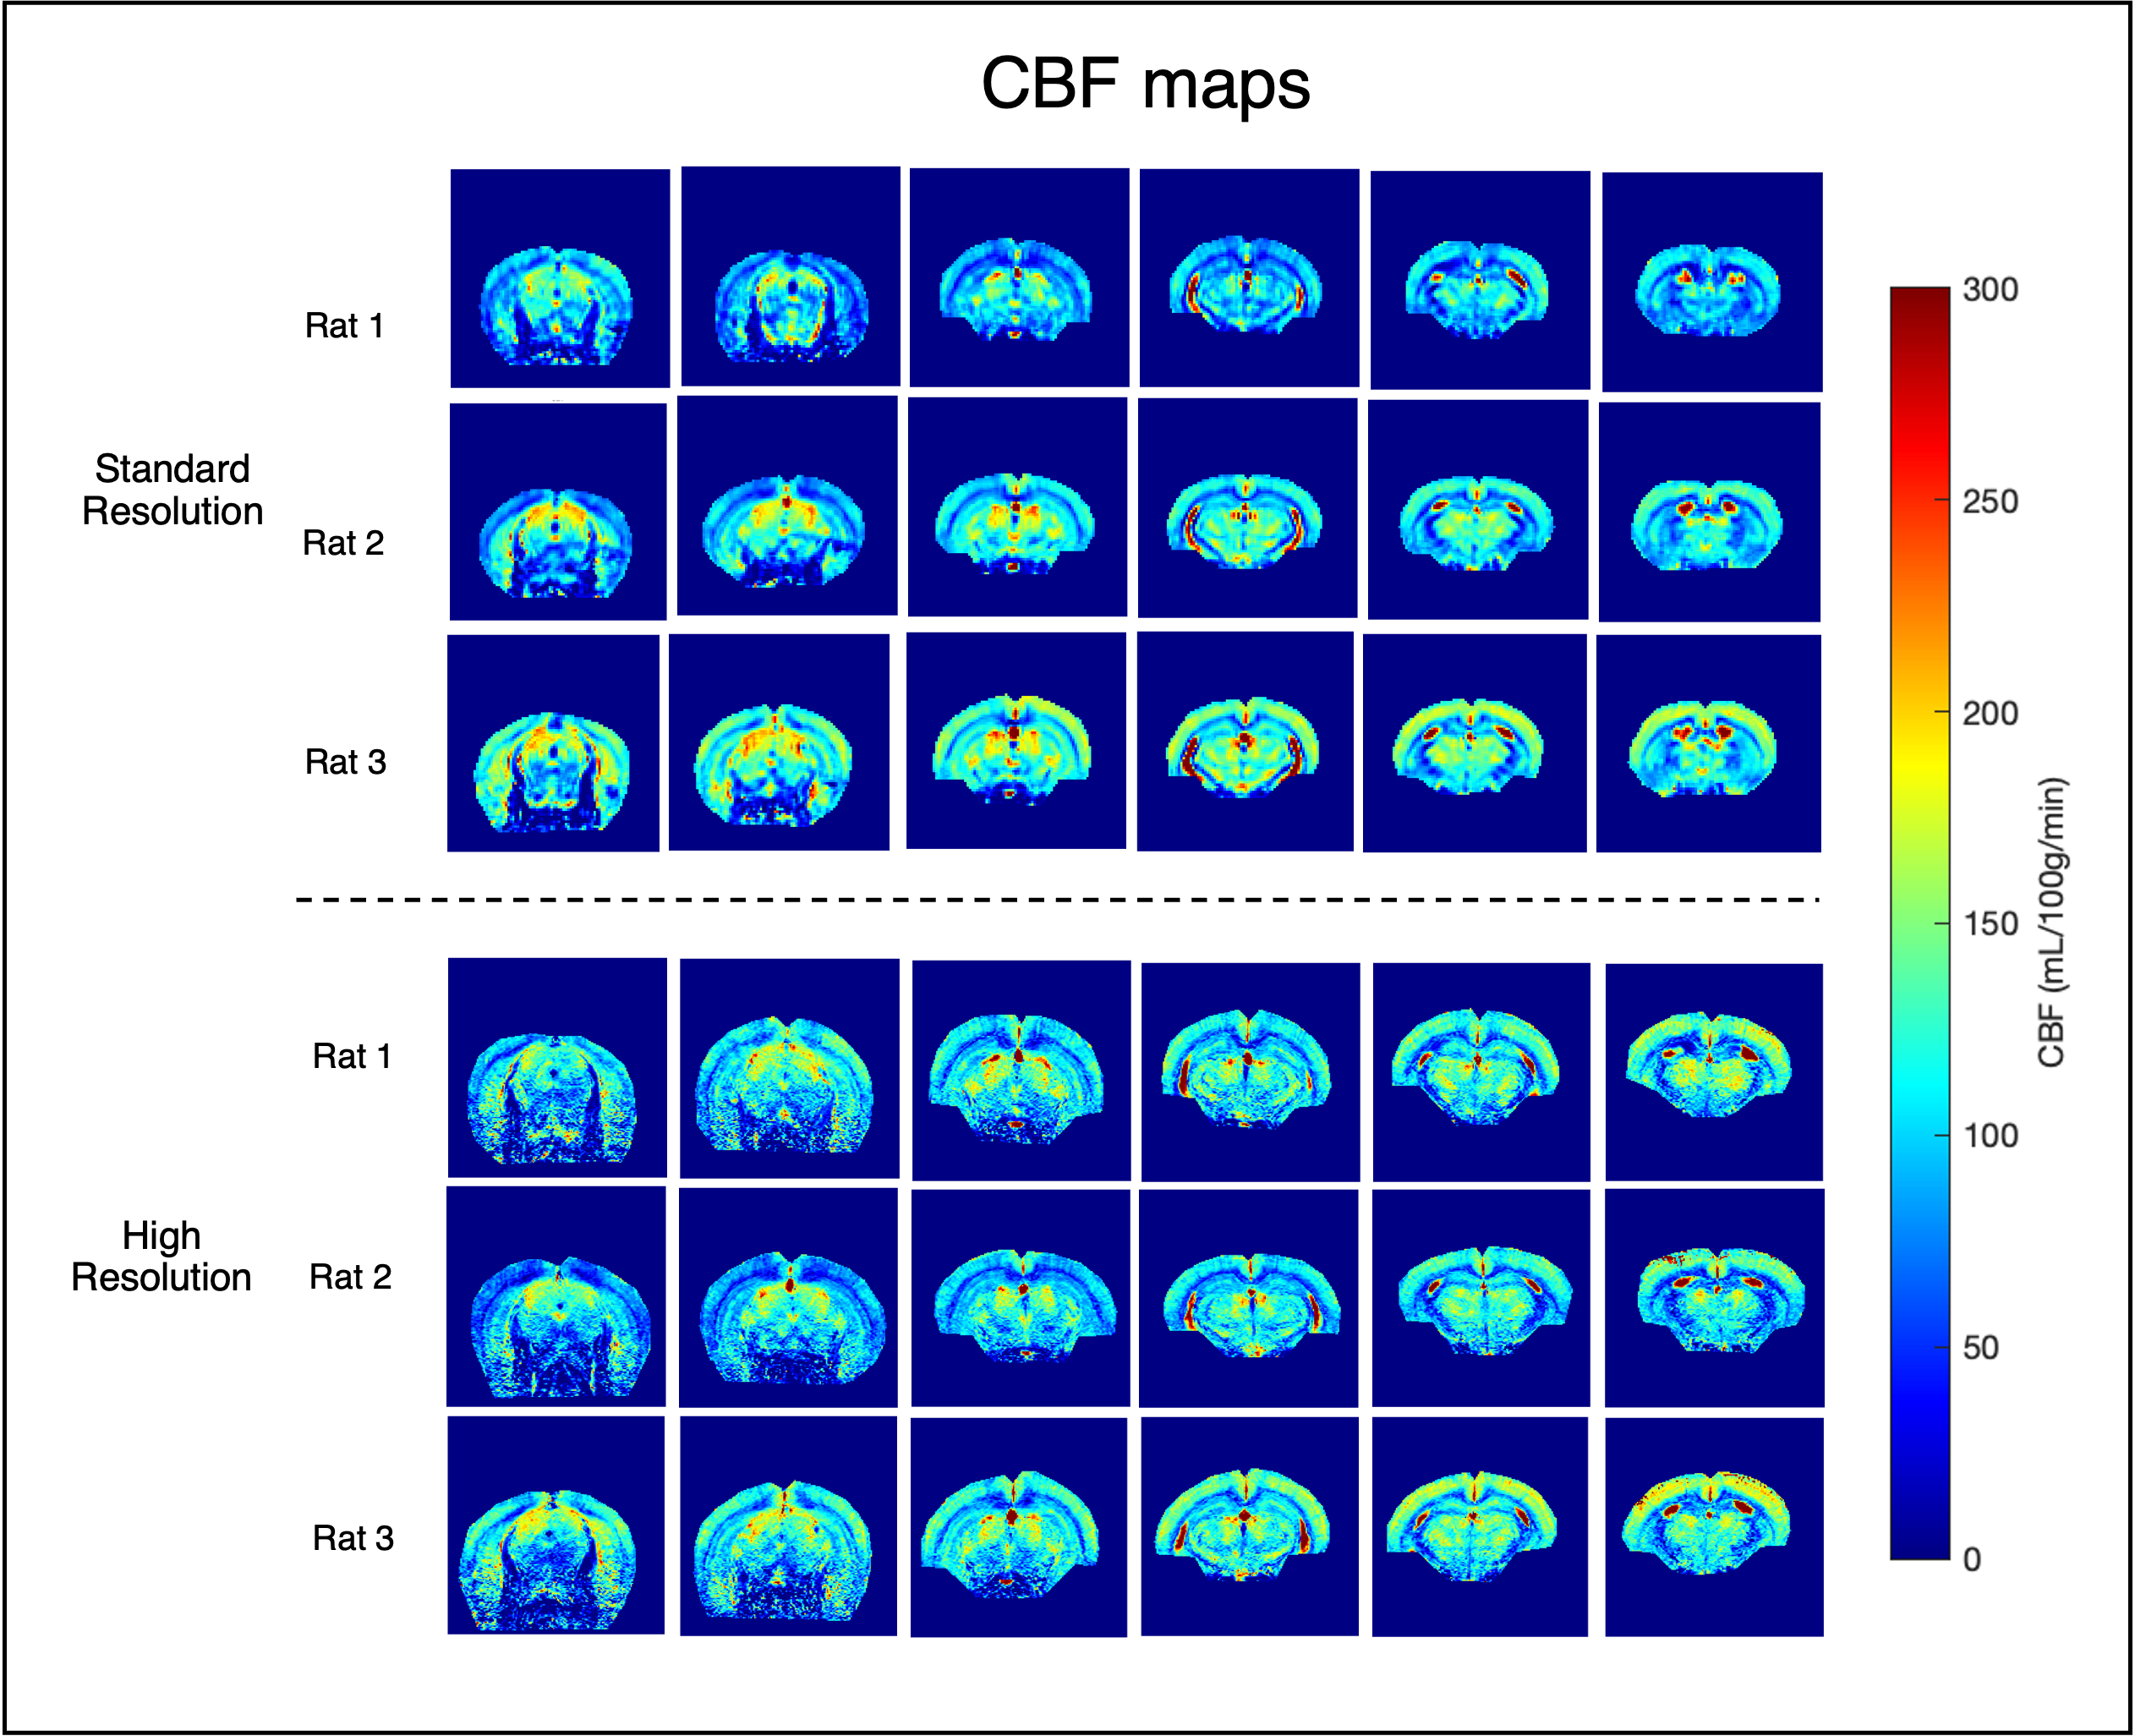
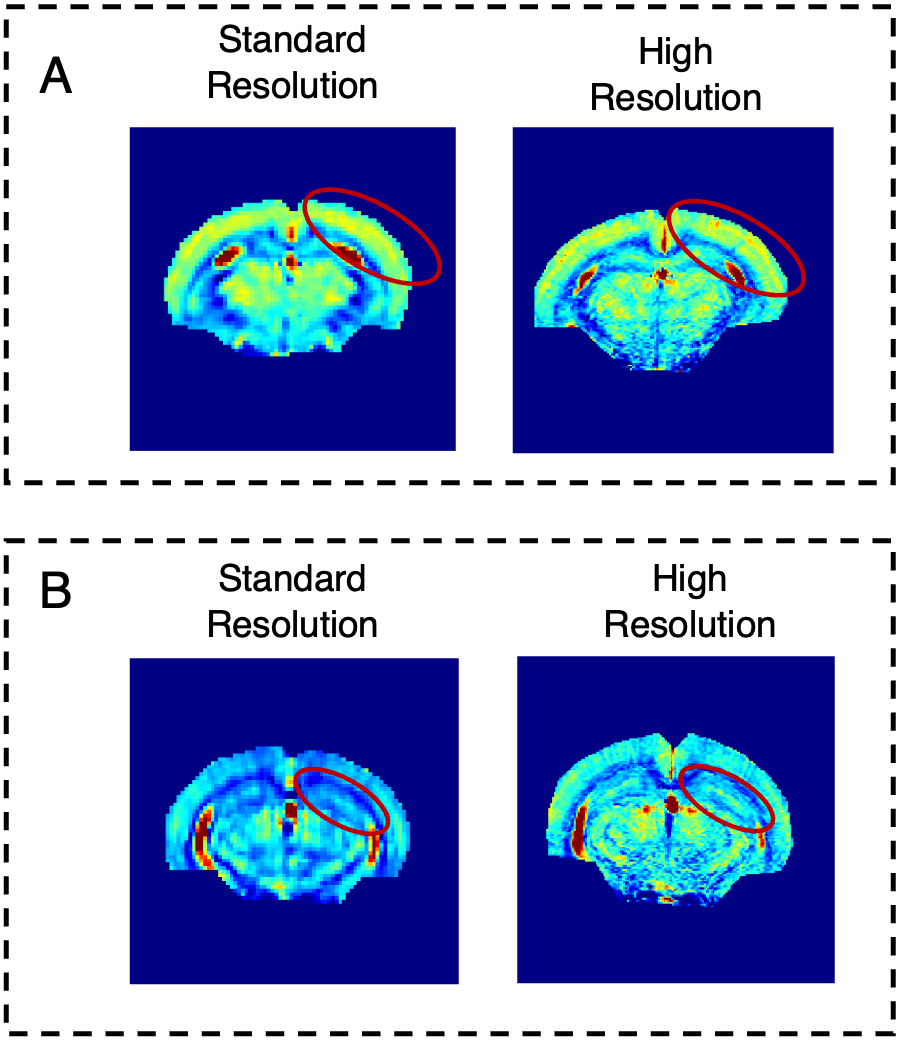
Figure 3 highlights that high-resolution raw data have reduced tSNR when compared to standard resolution, but still enough to properly quantify CBF. After phase optimization, the average IE was 87.0±4.0%. Figure 4 shows CBF maps at the standard resolution (top) and with x6 higher resolution (bottom). Both acquisitions provide the expected CBF patterns in healthy rat brain, with increased perfusion in grey matter (e.g cortex and thalamus) when compared to white matter, which remained consistent across animals. However, in the high-resolution images, a better delineation of different brain regions becomes apparent. Perfusion in different cortical layers can be discerned, along with clearly delineated descending vessels (Figure 5A). Additionally, even in the hippocampus, where CBF is reduced compared with other grey matter regions, layers can be observed (Figure 5B).Discussion
High-resolution CBF mapping can benefit multitude applications of perfusion imaging ranging from development, aging, neurodegeneration, and cancer. In this work, we successfully increased the state-of-the-art resolution of pCASL pre-clinical images by a factor of 6 without prolonging the experiments, which represents a significant improvement in image quality. These improvements are mainly due to the use of a cryogenic coil, which provides dramatically enhanced sensitivity. Additionally, our results reinforce that reliable CBF maps are only achievable after interpulse phase optimizations at the labelling plane9 – without which IE is low and unstable. One drawback of our single-shot EPI approach is the longer TE compared to previous studies9; still, we observed highly consistent results across animals and high relative ASL signal in both acquisition settings, suggesting that this was not a major confounding factor. In the future, the resolution could be further increased by acquiring EPIs with multiple segments, or faster spiral trajectories. Our results bode well for future applications of quantitative CBF mapping.Acknowledgements
The authors acknowledge the vivarium of the Champalimaud Centre for the Unknow, a facility of CONGENTO which is a research infrastructure co-financed by Lisboa Regional Operational Programme (Lisboa2020), under the PORTUGAL 2020 Partnership Agreement, through the European Regional Development Fund (ERDF) and Fundação para a Ciência e Tecnologia (FCT) under the project LISBOA-01-0145-FEDER-022170. We also acknowledge FCT for financial support through Grant 2021.08457.BD.
References
1. Buck J, Larkin JR, Simard MA, Khrapitchev AA, Chappell MA, Sibson NR. Sensitivity of multiphase pseudocontinuous arterial spin labelling (MP pCASL) magnetic resonance imaging for measuring brain and tumour blood flow in mice. Contrast Media Mol Imaging. 2018;2018. doi:10.1155/2018/4580919
2. Larkin JR, Simard MA, Khrapitchev AA, et al. Quantitative blood flow measurement in rat brain with multiphase arterial spin labelling magnetic resonance imaging. Journal of Cerebral Blood Flow and Metabolism. 2019;39(8):1557-1569. doi:10.1177/0271678X18756218
3. Hirschler L, Collomb N, Voiron J, Köhler S, Barbier EL, Warnking JM. SAR comparison between CASL and pCASL at high magnetic field and evaluation of the benefit of a dedicated labeling coil. Magn Reson Med. 2020;83(1):254-261. doi:10.1002/mrm.27931
4. Petcharunpaisan S. Arterial spin labeling in neuroimaging. World J Radiol. 2010;2(10):384. doi:10.4329/wjr.v2.i10.384
5. Ratering D, Baltes C, Nordmeyer-Massner J, Marek D, Rudin M. Performance of a 200-MHz cryogenic RF probe designed for MRI and MRS of the murine brain. Magn Reson Med. 2008;59(6):1440-1447. doi:10.1002/mrm.21629
6. Uszynski I1*, Hirschler L1*, Warnking J, Poupon C, Deloulme JC, and Barbier EL. “Combined 3D perfusion and diffusion MRI to phenotype the mouse brain: Evaluation and application to a model of schizophrenia”, ISMRM Annual Scientific Meeting 2017, Honolulu, USA (Abstract No. 5114).
7. Manjón J v., Coupé P, Buades A. MRI noise estimation and denoising using non-local PCA. Med Image Anal. 2015;22(1):35-47. doi:10.1016/j.media.2015.01.004
8. Duhamel G, Callot V, Tachrount M, Alsop DC, Cozzone PJ. Pseudo-continuous arterial spin labeling at very high magnetic field (11.75 T) for high-resolution mouse brain perfusion imaging. Magn Reson Med. 2012;67(5):1225-1236. doi:10.1002/mrm.23096
9. Hirschler L, Debacker CS, Voiron J, Köhler S, Warnking JM, Barbier EL. Interpulse phase corrections for unbalanced pseudo-continuous arterial spin labeling at high magnetic field. Magn Reson Med. 2018;79(3):1314-1324. doi:10.1002/mrm.26767
10. Alsop DC, Detre JA, Golay X, et al. Recommended Implementation of ASL Perfusion MRI for Clinical Applications. Magn Reson Med. 2015;73(1):102-116.
Figures