2897
Feasibility of texture analysis of cocaine use disorder patients’ MRI data to predict early brain changes1Accessible Magnetic Resonance Laboratory, Biomedical Imaging and Engineering Institute, Department of Diagnostic, Molecular and Interventional Radiology, Icahn School of Medicine at Mount Sinai, New York, NY, United States, 2Biomedical Imaging and Engineering Institute, Department of Diagnostic, Molecular and Interventional Radiology, Icahn School of Medicine at Mount Sinai, New York, NY, United States, 3Department of Psychiatry, Addiction Institute at Mount Sinai, New York, NY, United States
Synopsis
Keywords: Data Analysis, Brain
Substance use disorder (SUD) affects the structure, function, and metabolism of the brain, and MR imaging helps to track and manage the therapeutic efficacy. We analyzed cortical white matter and Amygdala regions for 5 patients with cannabis use disorder using changes in texture and volume. Each patient was scanned 4 times(at 0,2,12 and 24 weeks) with 3D fast spin echo on a 3T scanner. We found increased textural changes across intervals for cortical white matter. However, for Amygdala, volumetric changes were greater in weeks 2 and 12.Both these changes help in the early monitoring of the effectiveness of the therapy.Introduction
About 700,000 deaths are reported due to drug overdose and ~96K deaths are reported every year in the United States since 2000 according to the National Center for Drug Abuse Statistics.[1] Substance use disorder (SUD) affects brain structure, function and metabolism and requires MR imaging of the brain to monitor therapeutic efficacy. Previous MR studies have shown that patients with polysubstance use possess smaller prefrontal lobe [2] and white matter [3] compared to controls. Joanna et.al, [4] have summarized different brain regions affected due to addiction. In this study, we investigate the value of textural analysis to identify brain changes in cannabis use disorder (CUD) patients treated with 5-Hz repeated transcranial magnetic stimulation (rTMS) [5]. We pilot preliminary evaluation of these textural features as an earlier detection biomarker than volumetric changes in five CUD patients, motivated by a recent 3T study on Alzheimer’s disease. [6]Methods
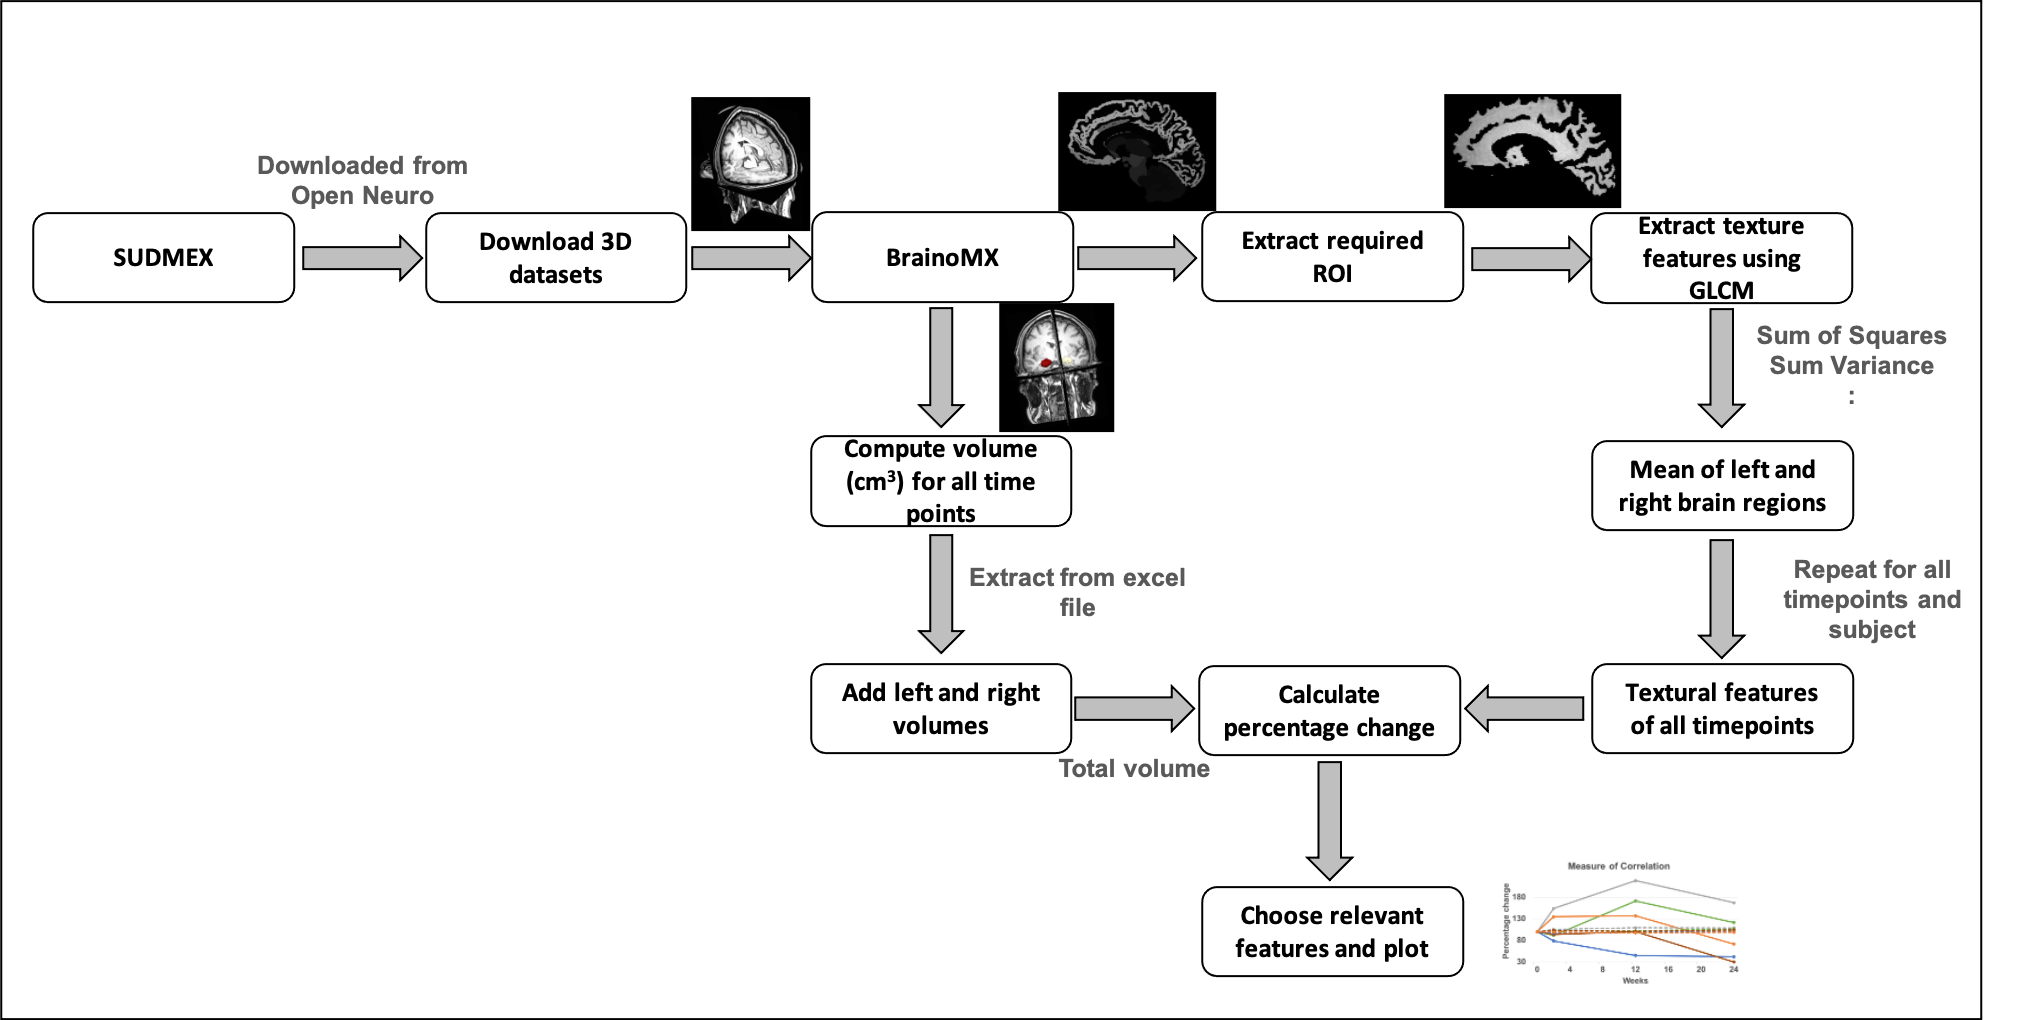
Dataset: In this study, we analyzed 5 patients’ data from the SUDMEX_TMS study available on openNeuro [7]. The ages of the 5 patients ranging from 32 to 42 years and each individual was scanned 4 times as a part of a longitudinal study. The scans include baseline (tp1), 2 weeks (tp2), 3 months (tp3), and 6 months (tp4). We computed textural features for two brain structures - cortical white matter and Amygdala [8]. All scans were performed on 3T and the sequence used was 3D fast spin echo (FSE). The acquisition parameters were TR/TE - 7/3.5 ms, field of view (FOV) - 240 mm2. Volumetry and texture analysis: The T1 weighted 3D volume data was segmented using the BrainoMX tool. [9] The resulting left and right volumes were added to get the total volume (in cm3). Along with the volume, the tool also provides segmentation masks. The 3D segmented volumes were fed to a 3D Gray Level Co-occurrence Matrix (GLCM) (pyfeats package [10]) to extract 14 textural features such as sum of variance, entropy, correlation coefficient among others (Haralick features). Only non-zero values were considered for the computation. Figure 1 shows the image processing pipeline. The percentage difference of volume and textural feature value for all the time-points were plotted with the first value serving as the control for each patient (100%). Out of the 14 textural features obtained from the GLCM, two features were selected after visually inspecting all 14 curves compared with volume changes.Results
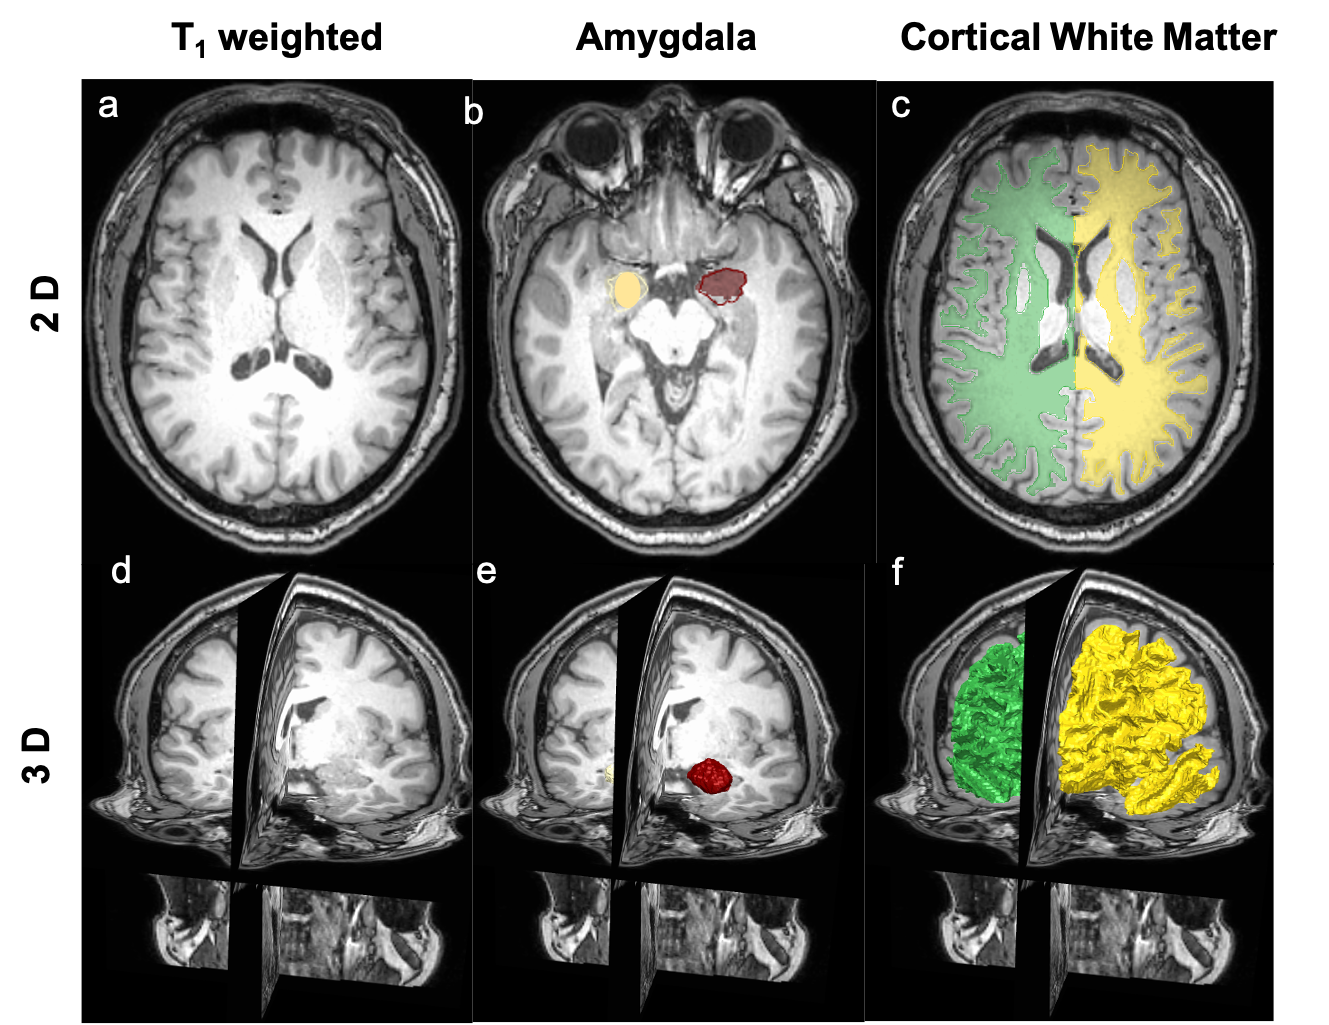
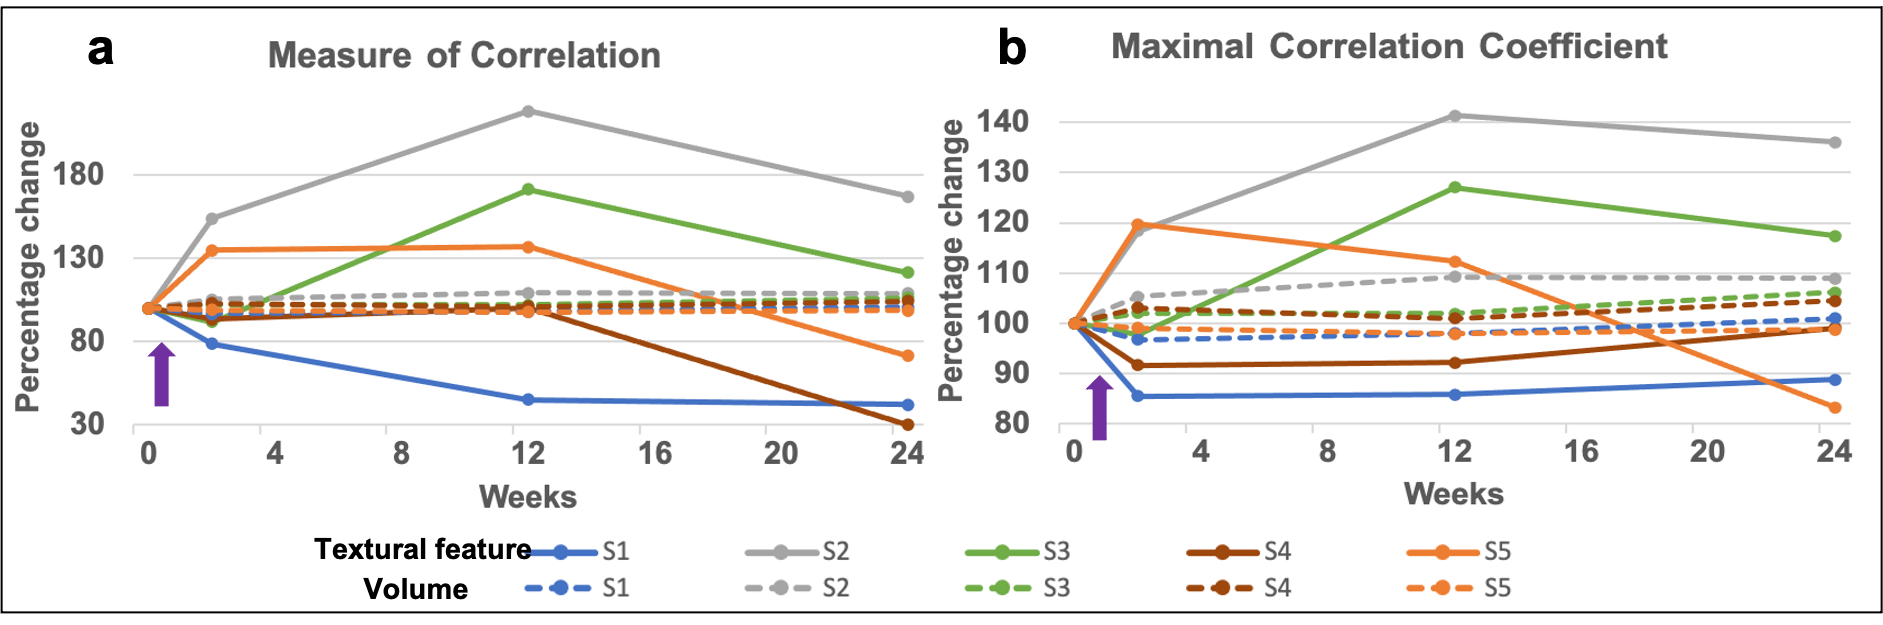
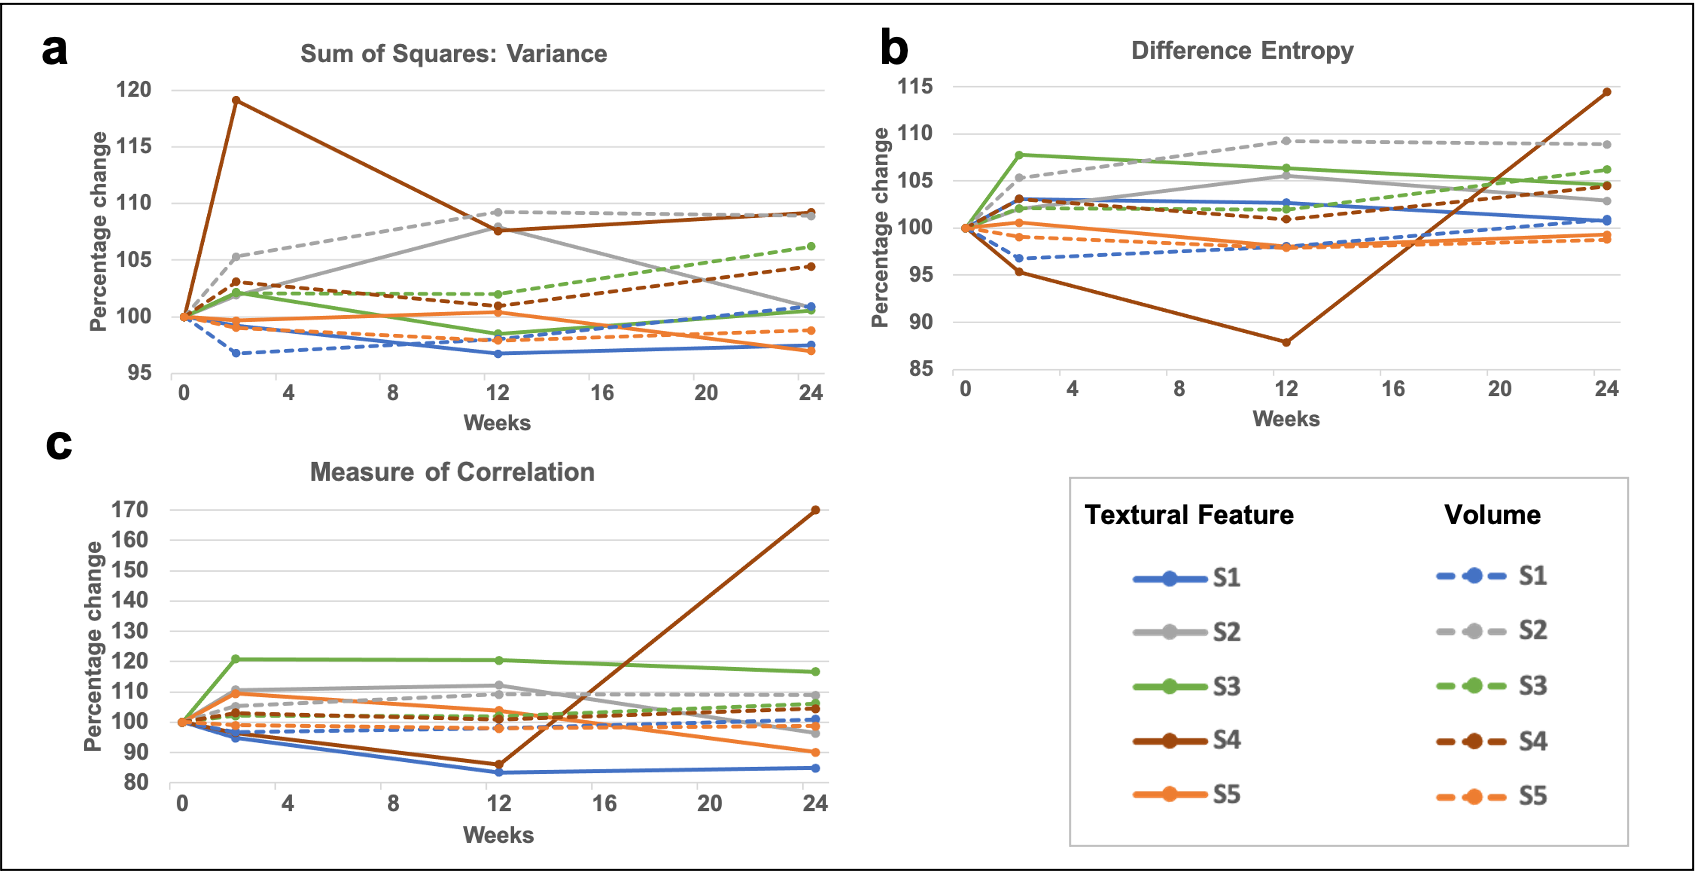
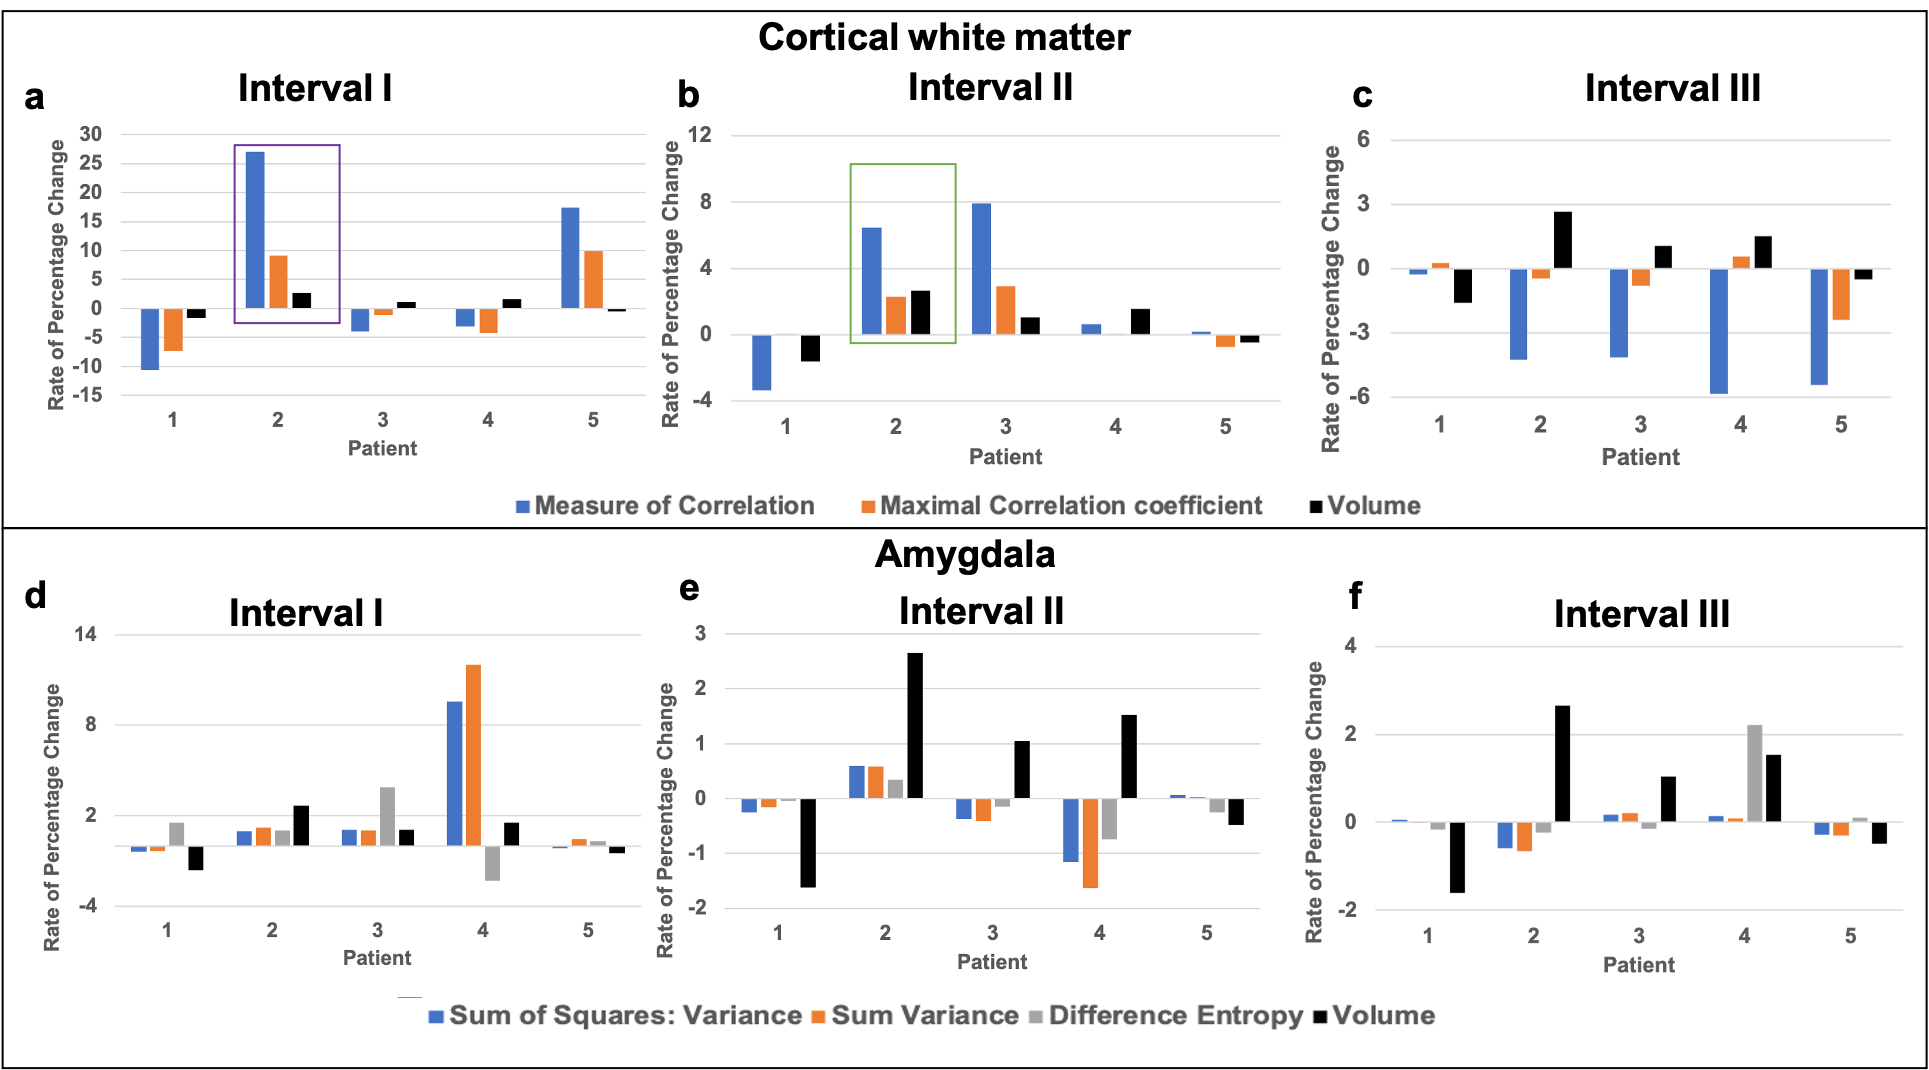
Figure 2 (a-c) show the representative T1 weighted data with the segmentation masks while Figure 2 (d-f) show the segmented brain subregions considered for volumetry and texture analysis. The left and right regions are shown with different colours for amygdala and cortical white matter. Figure 3 shows the plot of percentage change of volume (dashed lines) along with a textural feature (solid line) for all 5 patients. For cortical white matter, 2 features were selected - measure of correlation (figure 3(a)) and maximal correlation coefficient (figure 3(b)). It can be seen from both the plots that the slope of textural features (solid lines, shown with purple arrow) are steeper than the volumetric changes (dashed lines) between first two points (0 and 2 weeks). This indicates that the textural changes are more sensitive and earlier than the volume changes. Figure 4 (a-c) shows the percentage change of textural feature and volume changes over 4 time-points for Amygdala. The textural features selected were - (a) sum of square - variance, (b) difference entropy and (c) measure of correlation. Similar to the cortical white matter, even in Amygdala, these textural features show steeper slope in some patients’ data compared to volumetric changes. Figure 5 depicts the bar graph showing rate of percentage change in volume and textural feature for all 5 datasets. Figure 5 (a-c) shows the plots for cortical white matter in three different phases (a) Interval I: between baseline and 2 weeks, (b) Interval II: 2 weeks and 12 weeks (c) Interval III: 12 weeks to 15 weeks. Similarly, figure 5 (d-f) shows show the corresponding bar graphs for amygdala. It can be seen that during interval I (within 2 weeks), the rate of percentage change for textural features were greater than the volume (purple border). The textural features show increased changes compared to volumetric changes for cortical white matter in all intervals. However, the volumetric changes increase in intervals 2 and 3 for amygdala compared to textural features indicating perceivable downstream structural changes (see the bar graph in green border).Discussion and conclusion
From figures 3 and 5 it is can be observed that the textural changes can be seen earlier than the volume changes. This can be helpful in the early monitoring of therapeutic efficacy and management. Figure 5 shows increased volumetric changes for cortical white matter and amygdala from interval II onwards for 4 out of 5 patients. This might be attributed to the effect of rTMS treatment on these patients. The major limitations of this pilot study include a small sample size and the lack of interpretation of the textural feature values attributed to physiological changes in the brain structure. Current and future work include analyzing more datasets, mapping textural features to addiction neurobiology and statistical analysis.Acknowledgements
The authors would like to acknowledge support from the faculty idea innovation prize from the office of faculty development, Icahn School of Medicine at Mt. Sinai, 2022.References
1. https://drugabusestatistics.org
2. Liu X, et al. Smaller volume of prefrontal lobe in polysubstance abusers: A magnetic resonance imaging study. Neuropsychopharmacology. 1998;18(4):243–252
3. Schlaepfer TE, et al. Decreased frontal white-matter volume in chronic substance abuse. International Journal of Neuropsychopharmacology. 2006;9(2):147–153
4. Fowler, Joanna S., et al. "Imaging the addicted human brain." Science & practice perspectives 3.2 (2007):
5.Garza-Villarreal, Eduardo A., et al. "Clinical and Functional Connectivity Outcomes of 5-Hz Repetitive Transcranial Magnetic Stimulation as an Add-on Treatment in Cocaine Use Disorder: A Double-Blind Randomized Controlled Trial." Biological Psychiatry: Cognitive Neuroscience and Neuroimaging 6.7 (2021): 745-757.
6. Lee, Subin, Hyunna Lee, and Ki Woong Kim. "Magnetic resonance imaging texture predicts progression to dementia due to Alzheimer disease earlier than hippocampal volume." Journal of Psychiatry and Neuroscience 45.1 (2020): 7-14.
7. Ruth Alcala-Lozano and Sofia Fernandez-Lozano and Erick Morelos-Santana and Alan Davalos and Viviana Villicana and Eduardo A. Garza-Villarreal (2021). SUDMEX_TMS: The Mexican dataset of an rTMS clinical trial on cocaine use disorder patients.. OpenNeuro. [Dataset] doi: 10.18112/openneuro.ds003037.v1.0.1
8. Makris, Nikos, et al. "Decreased absolute amygdala volume in cocaine addicts." Neuron 44.4 (2004): 729-740.
Figures