2896
Application of radiomics approach on predicting freezing of gait in Parkinson’s disease based on rs-fMRI indices1The First Hospital of China Medical University, Shenyang, China
Synopsis
Keywords: Machine Learning/Artificial Intelligence, fMRI (resting state), Parkinson’s disease, freezing of gait, feedforward neural network, receiver operating characteristic.
- In the present investigation, we built a non-invasive and automatic classification model, by extracting radiomic features based on whole-brain functional alterations of rs-fMRI indices (mALFF, mReHo, and DC) combined with clinical scales (MoCA, and HAMD) using feedforward neural network (FNN) models, which is a representative of supervised learning classification methods. We found that these models can effectively differentiate PD-FOG and PD-nFOG and find potential biomarkers of PD-FOG, which might facilitate the individual diagnosis of PD-FOG patients.
Introduction
- To evaluate the effectiveness of radiomics features on distinguishing Parkinson’s disease (PD) patients with and without freezing of gait (FOG) based on multi-indices of resting-state functional magnetic resonance imaging (rs-fMRI) and clinical features.
Materials and methods
- Fifty-eight idiopathic PD patients (28 PD-FOG and 30 PD-nFOG) and 33 healthy controls (HC) were enrolled. Complete neurological and clinical features were assessed. All the subjects were scanned on a 3.0T MRI scanner (Magnetom Verio, Siemens, Erlangen, Germany) with a 32-channel phased-array head coil. The rs-fMRI images were acquired with the following parameters: TR = 2,500 ms, TE = 30 ms, flip angle = 90°, slice number = 43, slice thickness = 3.5 mm, slice gap = 0 mm, time points= 240, interleaved, FOV = 224 × 224 mm2, matrix size = 64 × 64, and voxel size = 3.5 × 3.5 × 3.5 mm3. The high-resolution sagittal 3D-T1 images were collected with the following parameters: TR = 5,000 ms, TE = 2,960 ms, flip angle = 12°, slice number = 176, slice thickness = 1 mm, slice gap = 0 mm, FOV = 256 × 256 mm2, matrix size = 256 × 256, and voxel size = 1.0 × 1.0 × 1.0 mm3.
- Three functional segregation rs-fMRI indices including the mALFF, mReHo, and DC were extracted as features by the DPABI software (HTTP:// www.restfmri.net). The LASSO was implemented for feature selection, and the feedforward neural network (FNN) models (three layers: one input, one hidden, and one output) based on rs-fMRI index were built. We trained and validated the models in two conditions: using radiomic features alone (radiomic models, 348 features in each patient) and combined with clinical features (integrated models, 350 features in each patient) using 5-fold cross-validation. In this method, each time we selected one fold as the testing set, the rest folds as the training set, thus the training set occupies 80% of the whole dataset each time. The performance of models was assessed via the area under the receiver operating characteristic curve (AUC).
Results
- Different models’ performance for classifying PD-FOG vs HC, PD-nFOG vs HC, and PD-FOG vs PD-nFOG, with and without clinical data were shown in Table1. For classifying PD-FOG vs. HC and PD-nFOG vs. HC, the models using only mReHo values showed the highest AUC to 0.750 (accuracy=70.9%) and 0.759 (accuracy=65.3%) respectively in the two above tasks. The ROC curves are shown in Figures 1A and 1B. For classifying PD-FOG vs. PD-nFOG, the model using mALFF values combined with two clinical features showed the highest AUC to 0.847 (accuracy=74.3%). The ROC curve was shown in Figure 1C. The ROC curves of the 100-round cross-validations were reproducible in the FNN classifier of the three optimal models (Figure 2). Therein, the most relevant features of PD-FOG included the mALFF alterations in the left parahippocampal gyrus and two clinical characteristics (MoCA scores and HAMD scores) (Figure 3).
Discussion
- Our study first presented a novel framework to discover predictive biomarkers of PD-FOG for classifying HC, PD-nFOG, and PD-FOG subjects using the FNN model combined with multilevel rs-fMRI indices and clinical features, which could be helpful to support a clinical decision in both radiology and neurology. The FNN model, as a representative of supervised learning classification methods, uses multiple features to predict a target variable via learning input data through their weights [1, 2], which is opted for owing to accurate performance on nonlinear and high-dimensional data and has been widely used in classification including psychiatry and psychology research.
- We also found that for differentiating PD-FOG vs PD-nFOG, the model using mALFF with clinical data showed the highest efficiency. ALFF was first proposed in 2007 [3], which can describe the regional intensity of the spontaneous blood-oxygen-level-dependent signal in rs-fMRI, reflecting regional spontaneous neuronal activity, and has been widely applied in neurological diseases. Therefore, ALFF has high accuracy and feasibility in the application, we speculated that ALFF can be used as an indicator to classify PD-FOG and PD-nFOG.
- We also found the left parahippocampal gyrus plays a key role in the mALFF with clinical data model prediction. It is a variable and complicated cortex in terms of structure [4]. Because the parahippocampal gyrus is closely connected with the hippocampus, the consequent research led to an increasing appreciation of its function in cognition, such as memory encoding and retrieval and visuospatial processing [5]. Additionally, the parahippocampal gyrus has previously been implicated in the emotional processing of stimuli with (negative) emotional valence [6]. Kuang et al. found that increased brain entropy in the right parahippocampal gyrus and left DLPFC may cause dysfunction of corticolimbic circuitry which is important to emotional processing and cognitive control [7]. This can further explain that FOG can be induced or aggravated when the environment changes and emotional tension and fear in PD patients. So the left parahippocampal gyrus may play a key role in the occurrence and development of PD-FOG.
Conclusion
- Our results demonstrated that by identifying the aberrant resting-state function brain areas as potential biomarkers, the radiomics approach might provide new insights into the FOG in PD patients. These radiomics models might be served as a promising tool to support the clinical diagnosis with high accuracy.
Acknowledgements
- This work was supported by grants from the National Science Foundation of China (82071909).
References
1. LeCun, Y., Y. Bengio, and G. Hinton, Deep learning. Nature, 2015. 521(7553): p. 436-44.
2. Farhoumandi, N., et al., Facial Emotion Recognition Predicts Alexithymia Using Machine Learning. Comput Intell Neurosci, 2021. 2021: p. 2053795.
3. Zang, Y.F., et al., Altered baseline brain activity in children with ADHD revealed by resting-state functional MRI. Brain Dev, 2007. 29(2): p. 83-91.
4. Van Hoesen, G.W., et al., The parahippocampal gyrus in Alzheimer's disease. Clinical and preclinical neuroanatomical correlates. Ann N Y Acad Sci, 2000. 911: p. 254-74.
5. Lin, Y.H., et al., Anatomy and White Matter Connections of the Parahippocampal Gyrus. World Neurosurg, 2021. 148: p. e218-e226.
6. Koelsch, S., et al., Investigating emotion with music: an fMRI study. Hum Brain Mapp, 2006. 27(3): p. 239-50.
7. Kuang, L., et al., Increased resting-state brain entropy of parahippocampal gyrus and dorsolateral prefrontal cortex in manic and euthymic adolescent bipolar disorder. J Psychiatr Res, 2021. 143: p. 106-112.
Figures
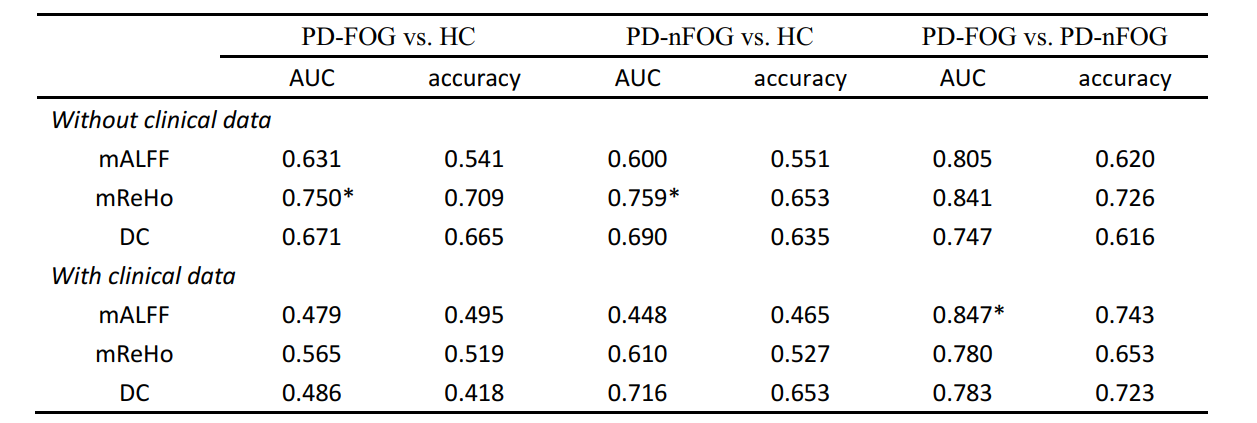
- Table 1 The performance of different models in three classification tasks.
- ROC, receiver operating characteristic; AUC, the area under ROC curve;* means the highest AUC in each classification task.
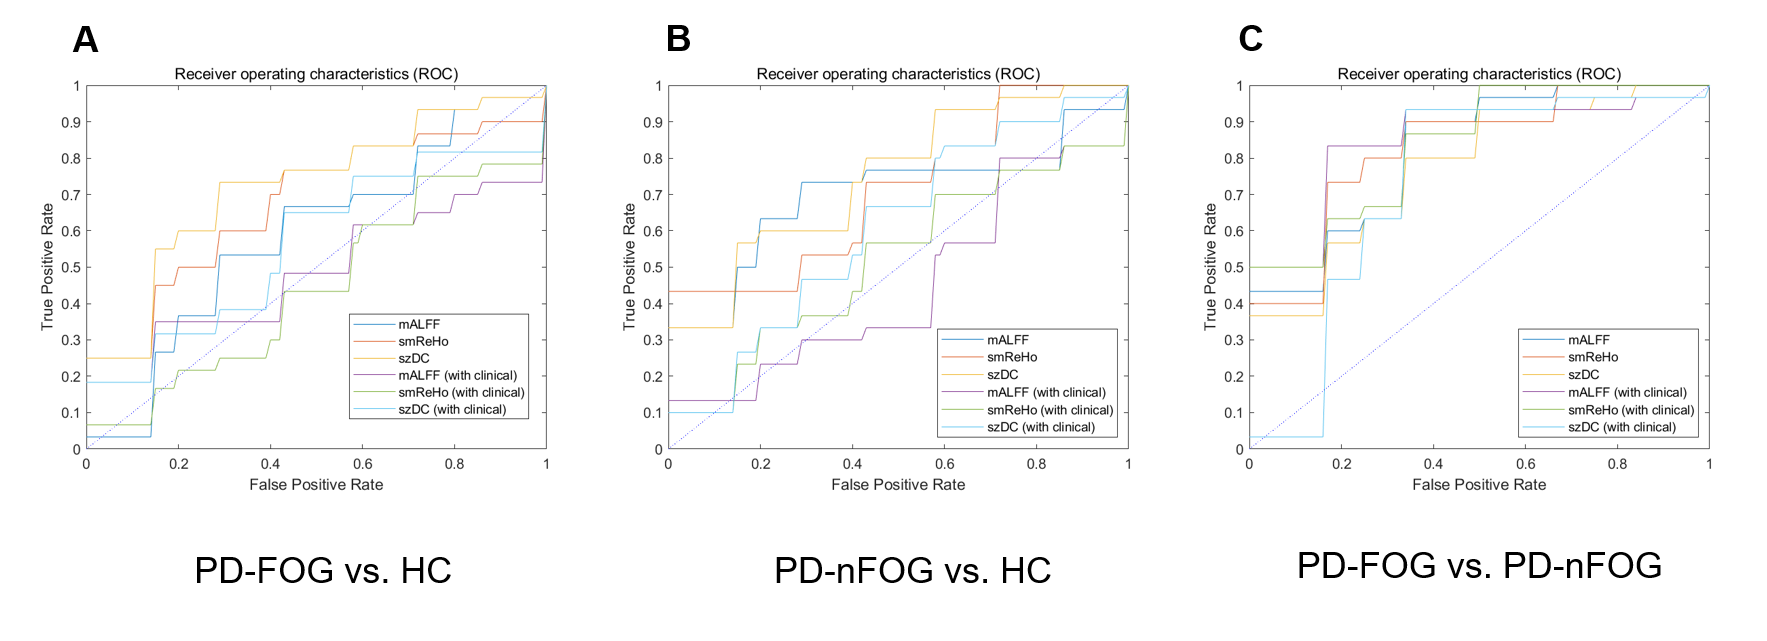
- Figure 1. The ROC curves of the optimal model for each classification task. 10-fold cross-validation and six machine learning models were utilized for predictive model construction in three tasks.
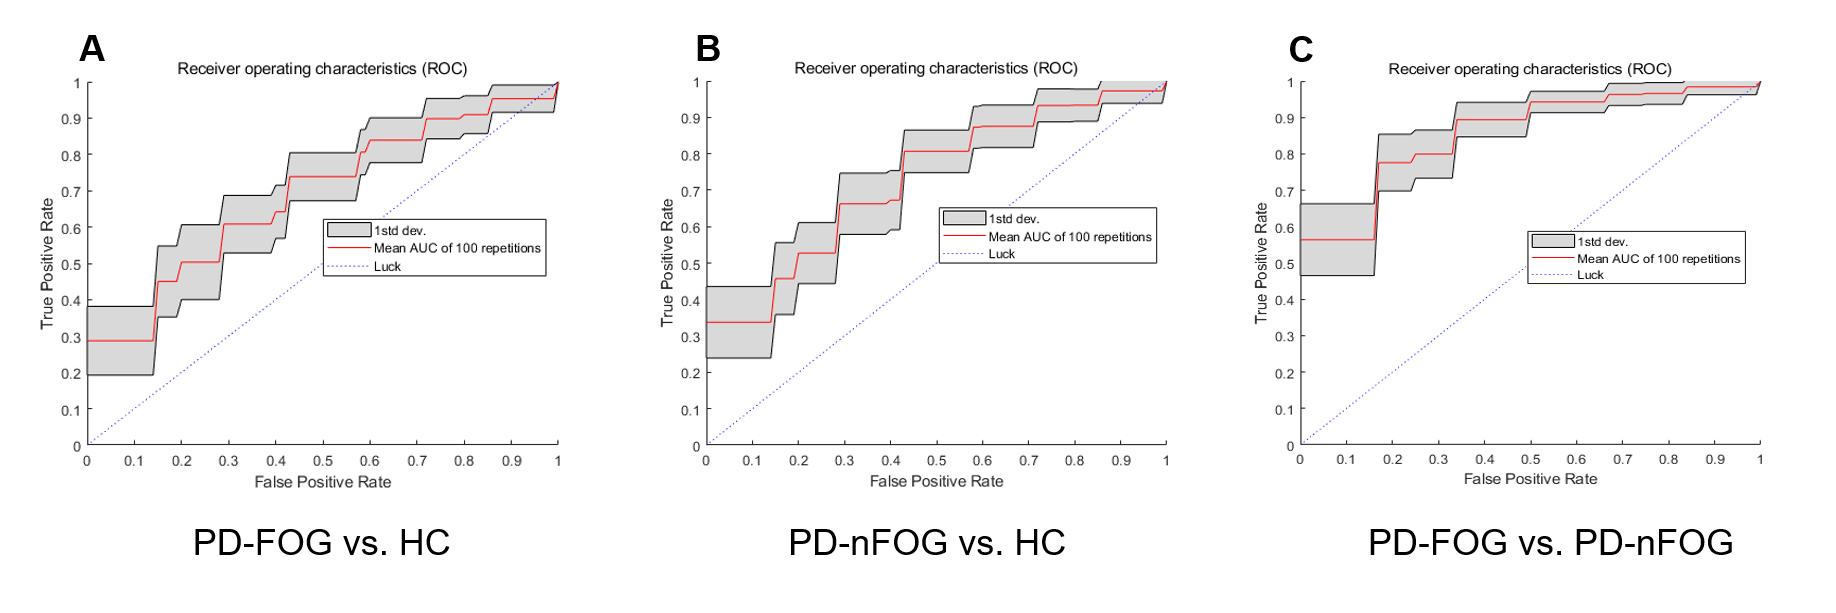
- Figure 2. The ROC curves of the FNN model using 100-round cross-validations. In each task curve, the red curve is the mean ROC of the 100-round cross-validations and the shadow area is the standard deviation.
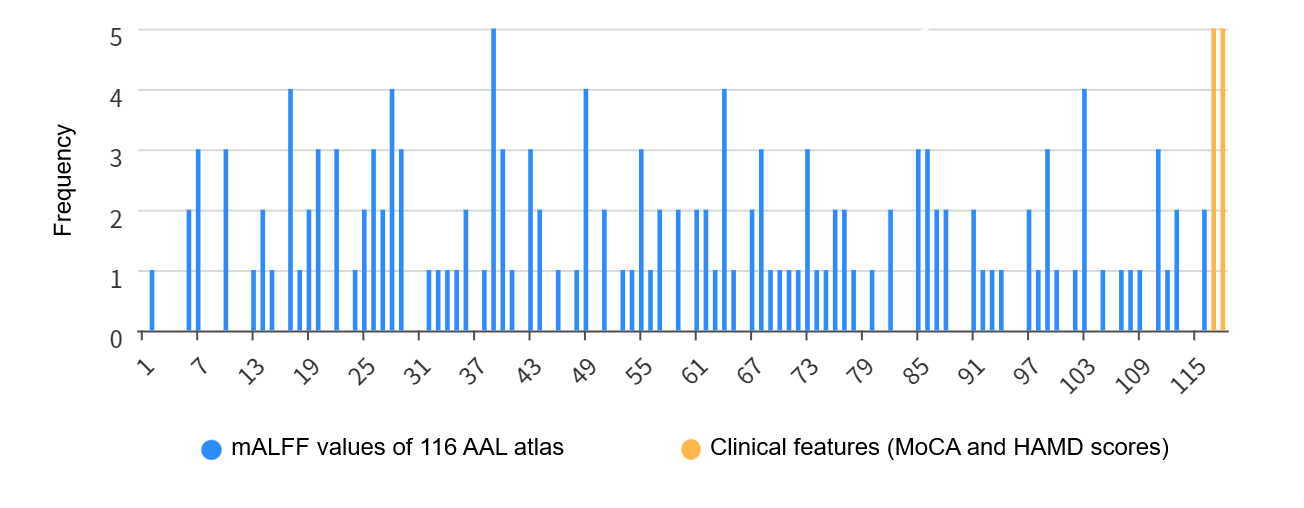
- Figure 3. Histograms of selected features for PD-FOG vs. PD-nFOG. The left parahippocampal gyrus, the MoCA score, and the HAMD score were selected as the top 3 related features (these features were selected 5 times in 5 folds). AAL, Anatomical Automatic Labeling; MoCA, the Montreal Cognitive Assessment; HAMD, the Hamilton Depression Scale.