2895
nnFAE: An Extended Module for FeAture Explorer (FAE) for Radiomic Feature Processing12. MR Scientific Marketing, Siemens Healthcare, Shanghai, China, 21. Shanghai Key Laboratory of Magnetic Resonance, East China Normal University, Shanghai, China
Synopsis
Keywords: Machine Learning/Artificial Intelligence, Software Tools
The biological meaning, model robustness and the harmonization of the features are the focuses in the current radiomics development. We designed a software named nnFAE which extends the open-source FeatureExplorer (FAE) to extract habitats features using multi-parameter MR images, to extract robust features recommended by IBSI, and to harmonize features from multi-vendors, etc. nnFAE has a graphic user interface to process the images and feature matrix in batch and can be used readily in radiomics studies.Introduction
Radiomics provides a data-driven approach which extracts quantitative features from medical images, and then uses machine learning methods to explore the relationship between the quantitative features and the clinical target [1]. Nowadays, several open-source or commercial software has been developed for radiomics, covering feature extraction (3D slicer or Frontier), machine learning model development (FAE or Orange), and result visualization [2]. Although a great many radiomics studies have been published in recent years, few models have been used in the real clinical settings. Reason for limited usage of radiomics models are related to the quantitative features, such as standardisation, interpretability, and harmonization [3-5]. Several papers, including those by the image biomarker standardisation initiative (IBSI), discussed these concepts and were devoted to pushing radiomics’ clinical applications. Although there are several packages in Python or R providing standard feature processing, no software with a graphic user interface (GUI) is available to make it easier for the radiologist to implement these processes in their radiomics studies.In this study, we designed a program with a GUI named nnFAE, which extends the open-source software FAE. nnFAE was designed to help the radiologist process and visualize the feature extraction.
The architecture of the nnFAE
nnFAE consists of three parts: Habitat analysis, IBSI feature extraction, and feature harmonization.Habitat Analysis
The conventional radiomics studies treated the tumor as a whole. All features were extracted from the whole region of interest (ROI). However, ROI may contain multiple distinctive components and extracting features from the whole ROI does not reflect the actual structure of the ROI. This has a negative influence on the interpretability of the radiomics features. R. Gillies et al. discussed the biological meaning of the radiomics features, and one of the promising directions is to analyze the habitat of the tumor by multi-vendor or multi-contrast images. Unsupervised methods, such as k-means cluster or Otsu threshold, could be used on an image to split the tumor into sub-regions. Then meaningful features can be extracted from the sub-regions, such as the volume percentage of the high DWI part or the mean value of the hypoxia.
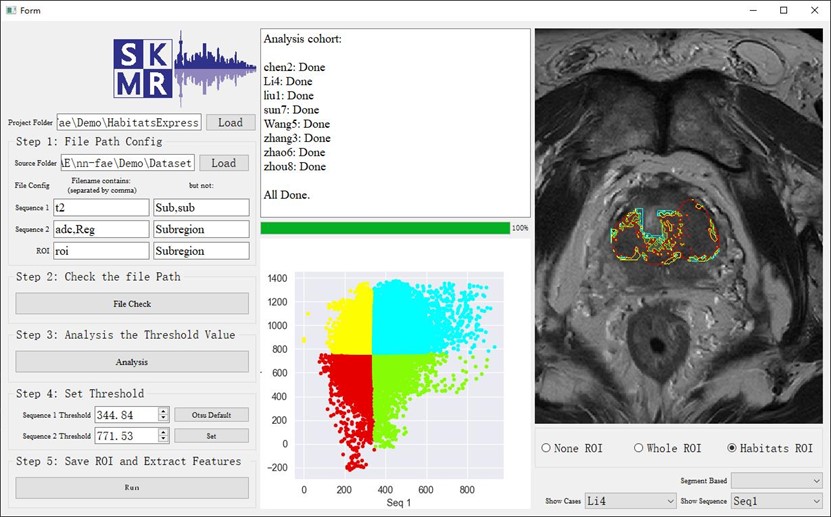
To help implement the above process, nnFAE provides a Habitat analysis module consists of batch files matcher, ROI splitter, and feature extraction (Figure 1). The ROI could be split using either thresholding or clustering on the case-level or cohort-level. For example, applying auto-thresholding t two sequences can split the ROI to 4 sub-regions: a low-low component, a low-high component, a high-low component, and a high-high component. Then the interpretable features, such as the mean value and the volume of each region can be extracted for further analysis.
IBSI Feature Extraction
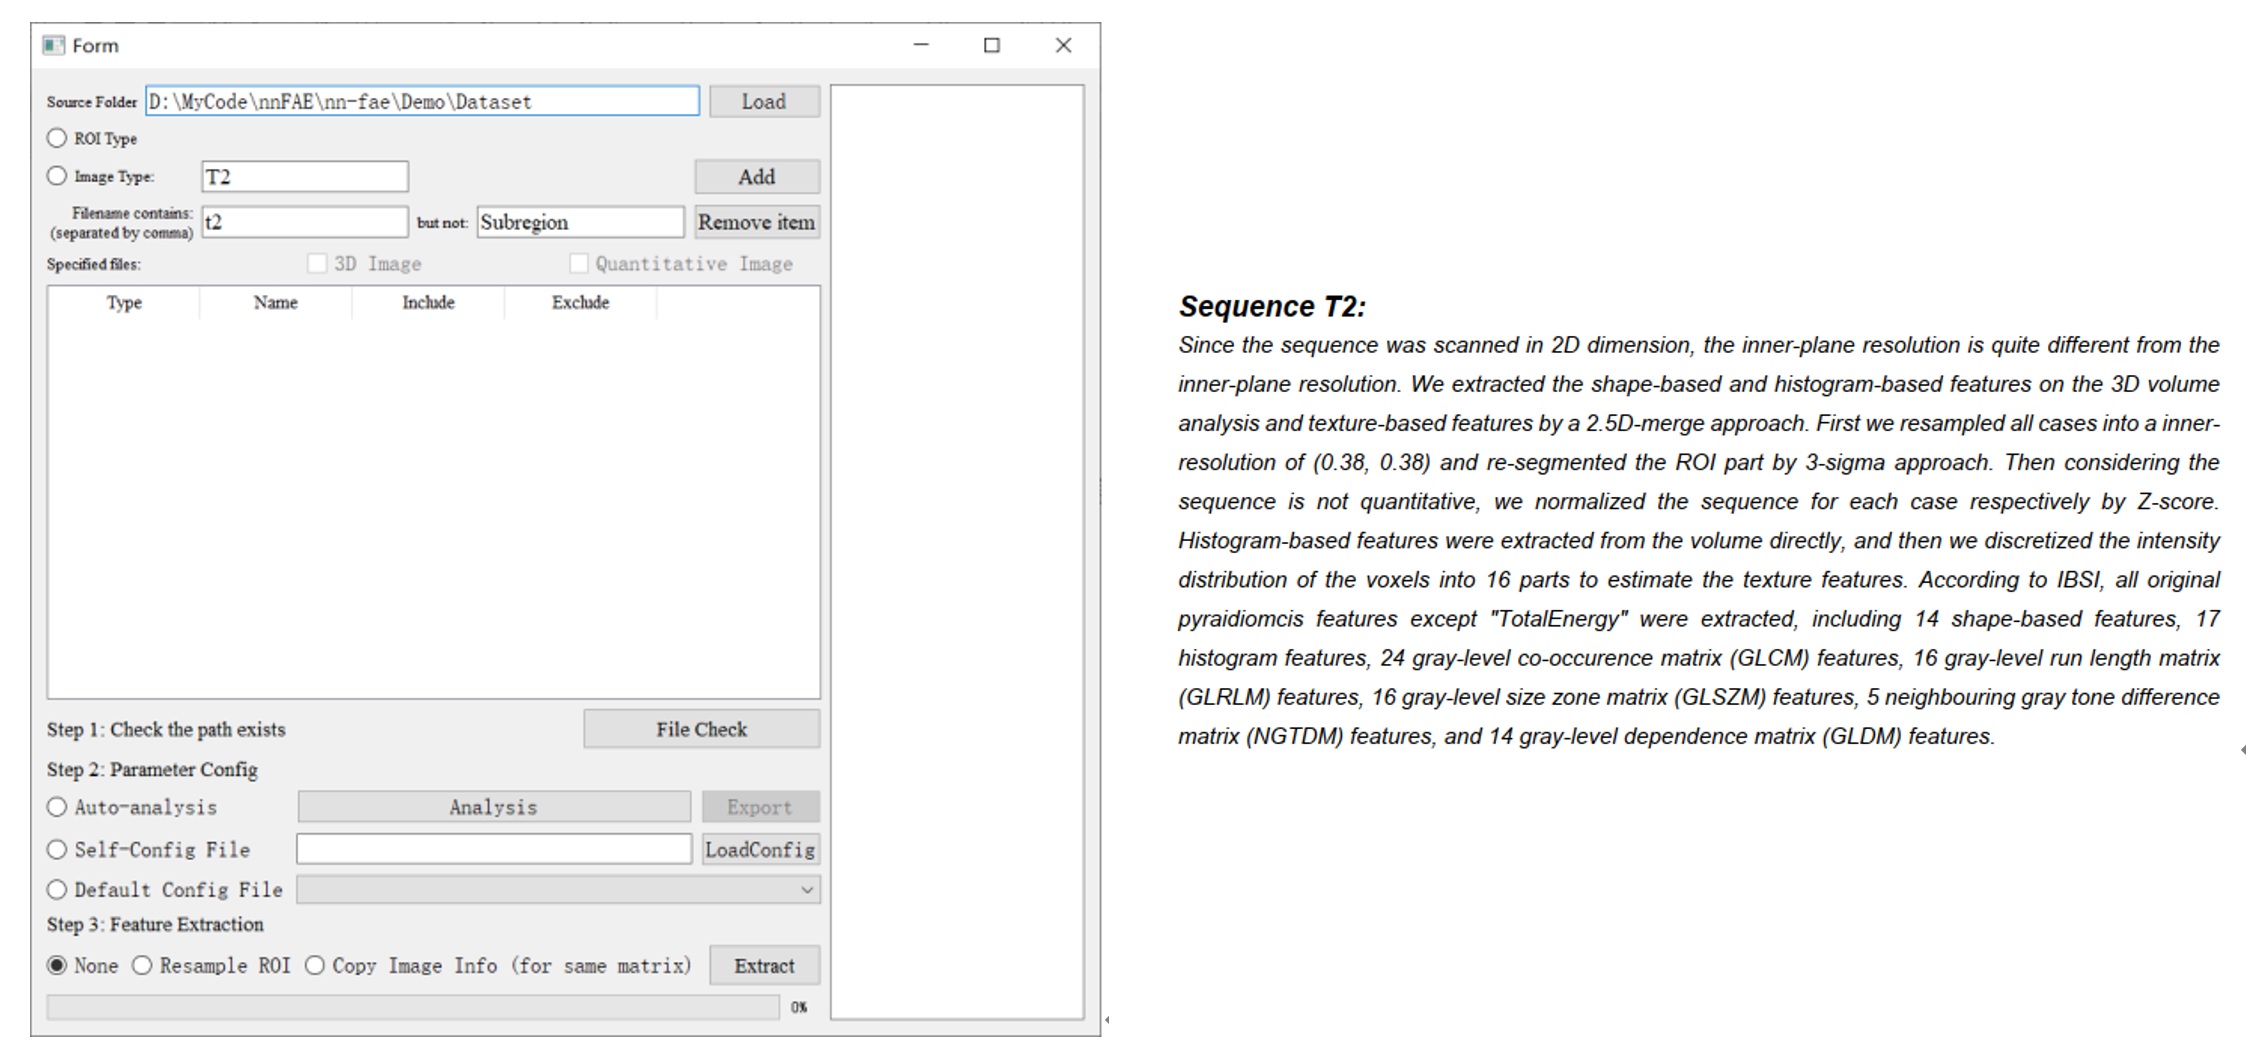
IBSI recommended a standardized paradigm for radiomics studies, including image pre-processing and extraction of robust features. However, there is no specifications on how to set different parameters for image pre-processing and features extraction. In IBSI Feature Extraction module of nnFAE, each sequence must be marked as either quantitative (such as ADC) or non-quantitative (such as T2W), and 2D or 3D scan. These information leads to different strategies of image pre-processing. For example, image normalization is implemented on case level for non-quantitative images and implemented on the cohort level for quantitative images. Also, the 2.5D- and 3D-average strategies are used for 2D and 3D sequences respectively. With the help of this module, features mentioned in both IBSI and PyRadiomics documents can be extracted. A PDF file can also be generated to describe the image processing and the features. (Figure 2)
Feature Harmonization
Compared to deep-learning-based computer-aided diagnosis models, radiomics models are more difficult to generalized to multi-center and multi-vendor studies. One reason is that radiomics features are easily influence by the whole process of image acquisition, preprocessing, which varies across systems in different sites. Though quantitative images and standardized scanning protocal can help to alleviate the variance, it still exists and the feature harmonization is often a must for multi-center or multi-vendor studies.
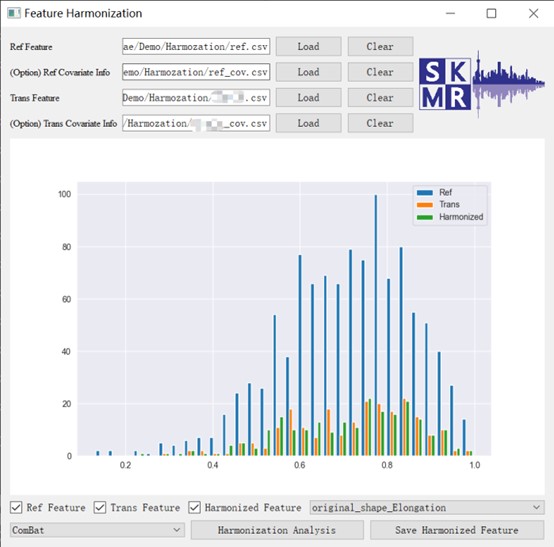
The Feature Harmonization module provides the linear transformation, such as ComBat, to harmonize features extracted from images from different systems. The bias and standard deviation estimation from the whole cohort is provided. Also, the covariate table (such as the gender) can be provided as an option to make the harmonization more accurate. The calibrated feature matrix can be exported for the further analysis. (Figure 3)
Discussion and Conclusion
In this study, we focused on the interpretability, standardization, and harmonization of the quantitative features in radiomics studies. We designed a GUI software to help radiologists extract interpretable features for habitat radiomics using multi-parametric MR images, to extract IBSI-compliant robust features, and to harmonize features extracted from multiple systems. nnFAE might help radiologists to keep up with the current trends of radiomics study and face the clinical challenges more confidently in radiomics studies.Acknowledgements
No acknowledgement found.References
1. Gillies RJ, Kinahan PE, Hricak H. Radiomics: Images Are More than Pictures, They Are Data. Radiology. 2016 Feb;278(2):563-77. doi: 10.1148/radiol.2015151169. Epub 2015 Nov 18. PMID: 26579733; PMCID: PMC4734157.
2. Song Y, Zhang J, Zhang YD, et al. FeAture Explorer (FAE): A tool for developing and comparing radiomics models. PLoS One. 2020 Aug 17;15(8):e0237587. doi: 10.1371/journal.pone.0237587. PMID: 32804986; PMCID: PMC7431107.
3. Tomaszewski MR, Gillies RJ. The Biological Meaning of Radiomic Features. Radiology. 2021 Mar;298(3):505-516. doi: 10.1148/radiol.2021202553. Epub 2021 Jan 5. Erratum in: Radiology. 2021 May;299(2):E256. PMID: 33399513; PMCID: PMC7924519.
4. Zwanenburg A, Vallières M, Abdalah MA, et al. The Image Biomarker Standardization Initiative: Standardized Quantitative Radiomics for High-Throughput Image-based Phenotyping. Radiology. 2020 May;295(2):328-338. doi: 10.1148/radiol.2020191145. Epub 2020 Mar 10. PMID: 32154773; PMCID: PMC7193906.
5. Ibrahim A, Primakov S, Beuque M, et al. Radiomics for precision medicine: Current challenges, future prospects, and the proposal of a new framework. Methods. 2021 Apr; 188:20-29. doi: 10.1016/j.ymeth.2020.05.022. Epub 2020 Jun 3. PMID: 32504782.
Figures