2891
Radiomics-based Machine Learning for Predicting Clinically Significant Cancer in Multicenter Cohort: Comparison to PI-RADS Reading
Gabriel Addio Nketiah1,2, Mohammed RS Sunoqrot 1,3, Elise Sandsmark3, Sverre Langørgen 3, Kirsten M Selnæs 1,3, Helena Bertilsson 1,4, Mattijs Elschot 1,3, and Tone F Bathen1,3
1Department of Circulation and Medical Imaging, Norwegian University of Science and Technology, Trondheim, Norway, 2Department of Radiology and Nuclear Medicine, St. Olavs Hospital, Trondheim University Hospital,, Trondheim, Norway, 3Department of Radiology and Nuclear Medicine, St. Olavs Hospital, Trondheim University Hospital, Trondheim, Norway, 4Department of Urology, St. Olavs Hospital, Trondheim University Hospital, Trondheim, Norway
1Department of Circulation and Medical Imaging, Norwegian University of Science and Technology, Trondheim, Norway, 2Department of Radiology and Nuclear Medicine, St. Olavs Hospital, Trondheim University Hospital,, Trondheim, Norway, 3Department of Radiology and Nuclear Medicine, St. Olavs Hospital, Trondheim University Hospital, Trondheim, Norway, 4Department of Urology, St. Olavs Hospital, Trondheim University Hospital, Trondheim, Norway
Synopsis
Keywords: Machine Learning/Artificial Intelligence, Prostate
Synopsis: Recently, predictive machine learning models have shown promise for prostate cancer diagnosis. The utility of MRI radiomic features for prostate cancer detection and classification has been shown several studies, but mostly using relatively small and single centre cohort. In this study, we showed that radiomics-based machine learning can perform relatively well compared to clinical practice, especially in large multicentre settings. On the patient-level analysis, the areas under the receiver-operating curves for PI-RADS reading by a radiologist and machine learning model were 90% and 89%, respectively.Introduction
Radiomics constitutes automatic high-throughput extraction of quantitative image features from radiological images and their subsequent analysis 1,2. The utility of radiomics-based machine learning models from MRI in prostate cancer diagnosis has recently gained attention, with huge number of studies 3–7. However, most of these studies are based on relatively small patient cohorts from single institutions and lack independent comparison with clinical readings, thereby limiting their clinical applicability. In this large multicenter cohort study, we investigated the utility of a radiomics-based machine learning model for detection of clinically significant prostate cancer foci in comparison to clinical reading according to PI-RADS.Materials and Methods
DatasetsBiparametric, i.e. T2-weighted (T2W) and diffusion-weighted (DW), MR images of 453 patients (Figure 1) from three independent datasets were used in this study: (1) the PROSTATEx challenge 8 training dataset (N=199), (2) the Prostate Cancer localization with a Multiparametric MR Approach trial (PCaMAP) dataset (N=96) and (3) an in-house collected dataset (N=158) from St. Olavs Hospital, Trondheim, Norway. The images were acquired with 3T Magnetom Trio or Skyra (Siemens Medical Solutions, Erlangen, Germany) prior to biopsy or radical prostatectomy. The whole prostate, peripheral zone (PZ), and tumor volumes of interest (VOIs) were delineated on the T2W images by or under guidance of an experienced radiologist. The presence of Grade Group≥2 9 in the biopsies or prostatectomy specimens was used to label each VOI as clinically significant or insignificant cancer.
Feature Maps Extraction
The T2W images were corrected for intensity non-uniformity and intensity non-standardness using the N4 bias field correction 10 and dual-reference tissue normalization 11, respectively. PyRadiomics toolkit 12 was used to extract (in 2D) voxel-wise radiomics features based on first-order statistics (number of features, nf=19), gray level co-occurrence matrix (nf=24), gray level run length matrix (nf=16), gray level size zone matrix (nf=16), neighboring gray tone difference matrix (nf=5), and gray level dependence matrix (nf=14) were extracted from the whole prostate volumes segmented on the T2W images. High b-value (b=1500 s/mm2) images and apparent diffusion coefficient (ADC) maps were derived from the DW images using the non-zero b-value (50–800 s/mm2 inclusive) images. First-order statistical radiomics features were also calculated from high b-value images and ADC maps. DW image features were co-registered 13 to the T2W images. Five anatomical feature maps: relative distance to the prostate boundary, PZ likelihood, and relative positions in x, y and z directions were also calculated.
Machine Learning
Cancer probability maps were obtained by training an Xtreme gradient boosting (XGBoost) classifier to predict the likelihood of a voxel being clinically significant cancer. To preserve the multicenter nature of the data, the classifier training and hyperparameter optimization (using 5-fold cross-validation) was done on the PROSTATEx and PCaMAP datasets, and testing on the in-house dataset. Local maxima indicative of cancer hotspots were detected on cancer probability maps using a spherical window with 10 mm radius. Free-response receiver-operating characteristic curve (FROC) analysis was performed on local maxima to evaluate model performance on lesion-level. Here, a local maximum was considered true positive it lies within 5mm from a clinically significant lesion annotation by the radiologist. For patient-level evaluation, ROC analysis was used. Local peak probability 14 was calculated as the average value within a circle with 5 mm radius at each local maximum and the maximum value was taken as the representative cancer probability for the patient. PI-RADS readings were available for comparison.
Results
In the training cohort (n=295 patients) there were 161 significant cancers in 143 patients, of which 110 lesions (N=100) were in the PZ and 51 (N=43) in transition zone (TZ). In the test cohort (N=158), 81 significant cancers were present in 67 patients, which consisted of 55 PZ cancers (N=48) and 26 TZ cancers (N=19). First-order statistical radiomics features mainly constituted the most important features in model (Figure 2). Figure 3 depicts example cancer probability maps. The FROC curve in Figure 4 shows the performance of the model in detecting significant cancers. On the patient-level analysis (Figure 5), PI-RADS reading by radiologist achieved AUC of 90% whilst machine learning achieved AUC of 89%Discussion
In this study, we showed that radiomics-based machine learning can perform relatively well compared to clinical practice, when trained on large data form multicentre settings. This study could offer several practical advantages to complement the radiological reading. First, it combines multiple images into a single feature map (i.e., cancer probability map), which reduces the number different imaging modalities to be evaluated and thus workload. Unnecessary biopsies and/or False positive detections constitute major concerns in prostate cancer detection due to the associated side effects (e.g., biopsy-related infection) and cost. Thus, the quantitative and objective nature makes it a potential suitable tool for initial screening to rule out a subset of patients not requiring biopsy. Finally, if biopsy is required, the probability maps (e.g., hotspots) can be used to guide sampling and potentially reduce the number of expected biopsy cores per patient. In future we seek to investigate the clinical feasibility and efficacy of the model especially in relation to sensitivity and specificity.Conclusion
Radiomics-based machine learning model from MR images can achieve comparable AUC in detecting prostate cancers relative to clinical reading according to PI-RADS.Acknowledgements
No acknowledgement found.References
1. Stoyanova R, Takhar M, Tschudi Y, et al. Prostate cancer radiomics and the promise of radiogenomics. Transl Cancer Res. 2016;5(4):432-447. 2. Gillies RJ, Kinahan PE, Hricak H. Radiomics: Images Are More than Pictures, They Are Data. Radiology. 2016;278(2):563-577. 3. Bernatz S, Ackermann J, Mandel P, et al. Comparison of machine learning algorithms to predict clinically significant prostate cancer of the peripheral zone with multiparametric MRI using clinical assessment categories and radiomic features. Eur Radiol. 2020;30(12):6757-6769. 4. Nketiah G, Elschot M, Kim E, et al. T2-weighted MRI-derived textural features reflect prostate cancer aggressiveness: preliminary results. Eur Radiol. 2016. 5. Nketiah GA, Elschot M, Scheenen TW, et al. Utility of T2-weighted MRI texture analysis in assessment of peripheral zone prostate cancer aggressiveness: a single-arm, multicenter study. Sci Rep. 2021;11(1). 6. Fehr D, Veeraraghavan H, Wibmer A, et al. Automatic classification of prostate cancer Gleason scores from multiparametric magnetic resonance images. Proc Natl Acad Sci. 2015;112(46):E6265-73. 7. Bonekamp D, Kohl S, Wiesenfarth M, et al. Radiomic Machine Learning for Characterization of Prostate Lesions with MRI: Comparison to ADC Values. Radiology. 2018;289(1):128-137. 8. Geert Litjens, Oscar Debats, Jelle Barentsz, Nico Karssemeijer HH. ProstateX Challenge data. The Cancer Imaging Archive (2017). 9. Epstein JI, Zelefsky MJ, Sjoberg DD, et al. A Contemporary Prostate Cancer Grading System: A Validated Alternative to the Gleason Score. Eur Urol. 2015;69(3):428-435. 10. Tustison NJ, Avants BB, Cook PA, et al. N4ITK: improved N3 bias correction. IEEE Trans Med Imaging. 2010;29(6):1310-1320. 11. Sunoqrot MRS, Nketiah GA, Selnæs KM, Bathen TF, Elschot M. Automated reference tissue normalization of T2-weighted MR images of the prostate using object recognition. Magn Reson Mater Physics, Biol Med. 2020. 12. Van Griethuysen JJM, Fedorov A, Parmar C, et al. Computational radiomics system to decode the radiographic phenotype. Cancer Res. 2017;77(21):e104-e107. 13. Klein S, Staring M, Murphy K, Viergever MA, Pluim JPW. elastix: a toolbox for intensity-based medical image registration. IEEE Trans Med Imaging. 2010;29(1):196-205. 14. Wahl RL, Jacene H, Kasamon Y, Lodge MA. From RECIST to PERCIST: Evolving Considerations for PET Response Criteria in Solid Tumors. J Nucl Med. 2009;50(Suppl 1):122S-150S.Figures
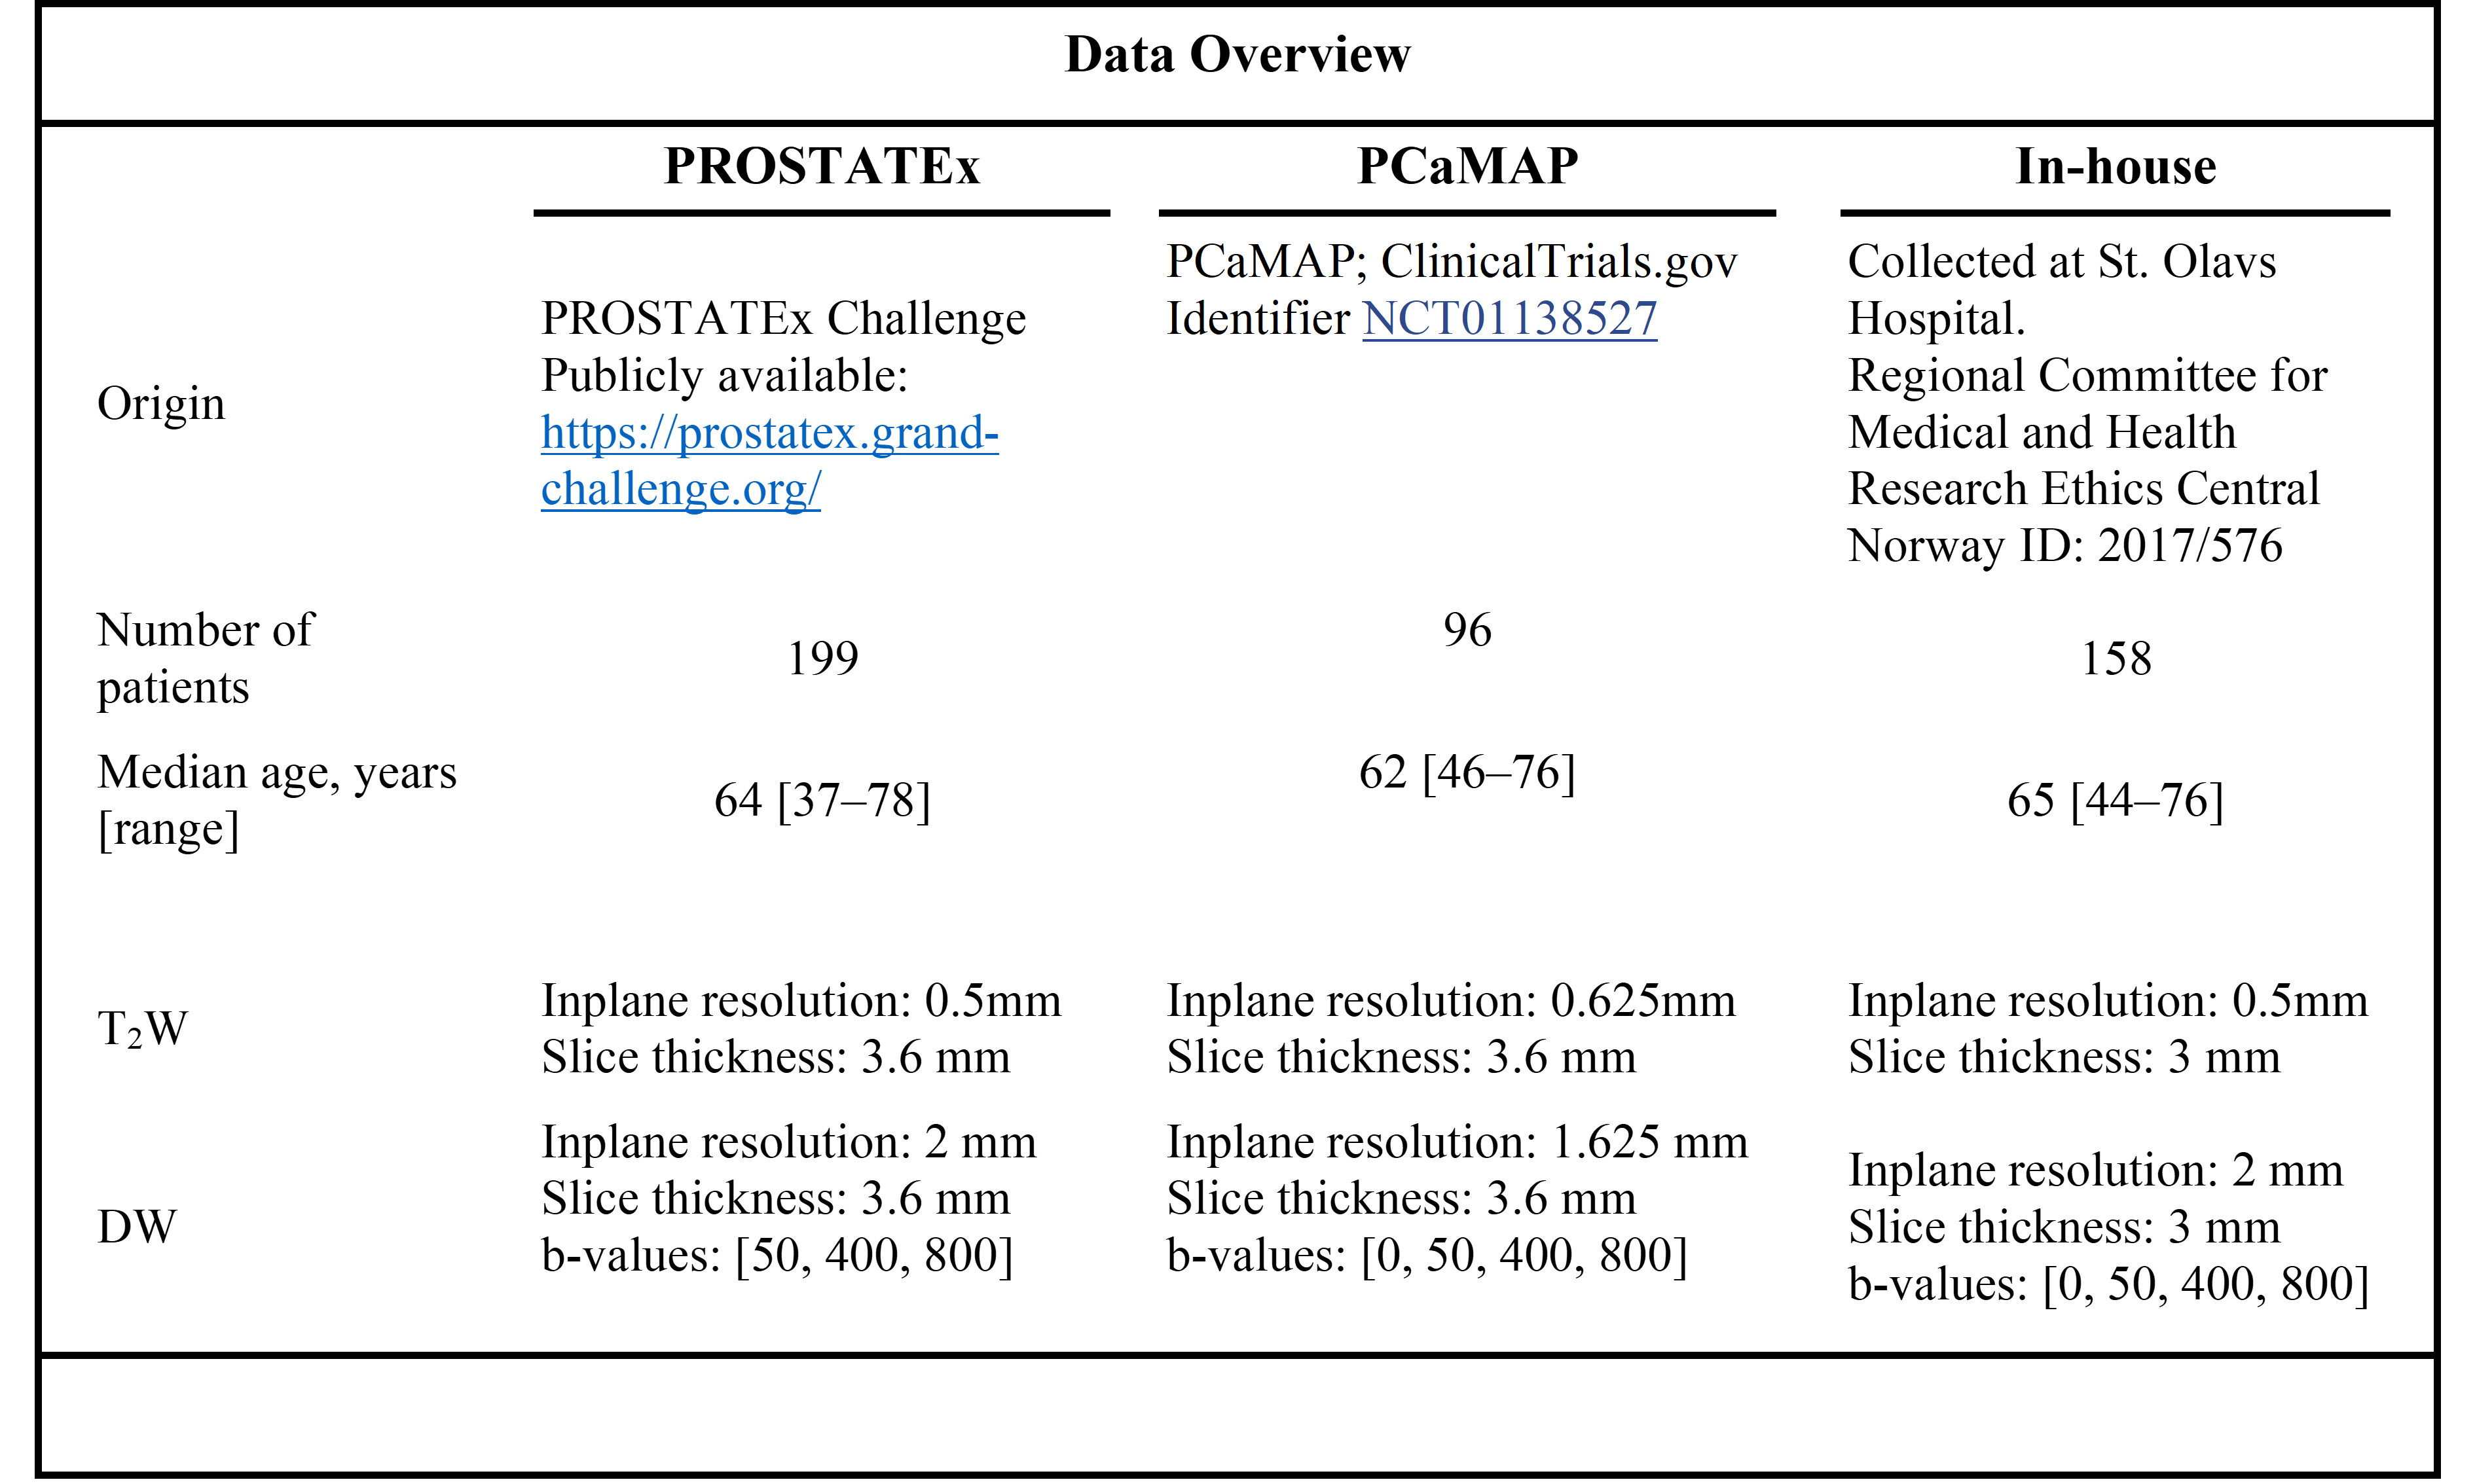
Figure
1: Patient characteristics and data acquisition settings
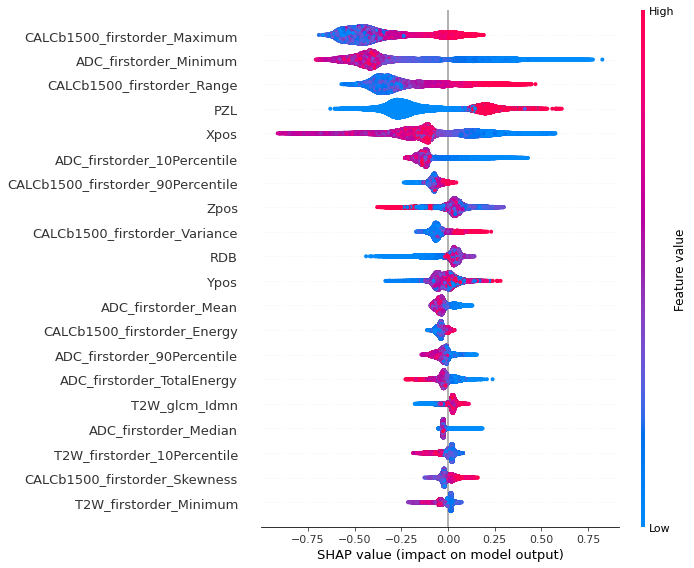
Figure 2: SHAP summary plot showing the importance and effects of the most
contributing features to the model.
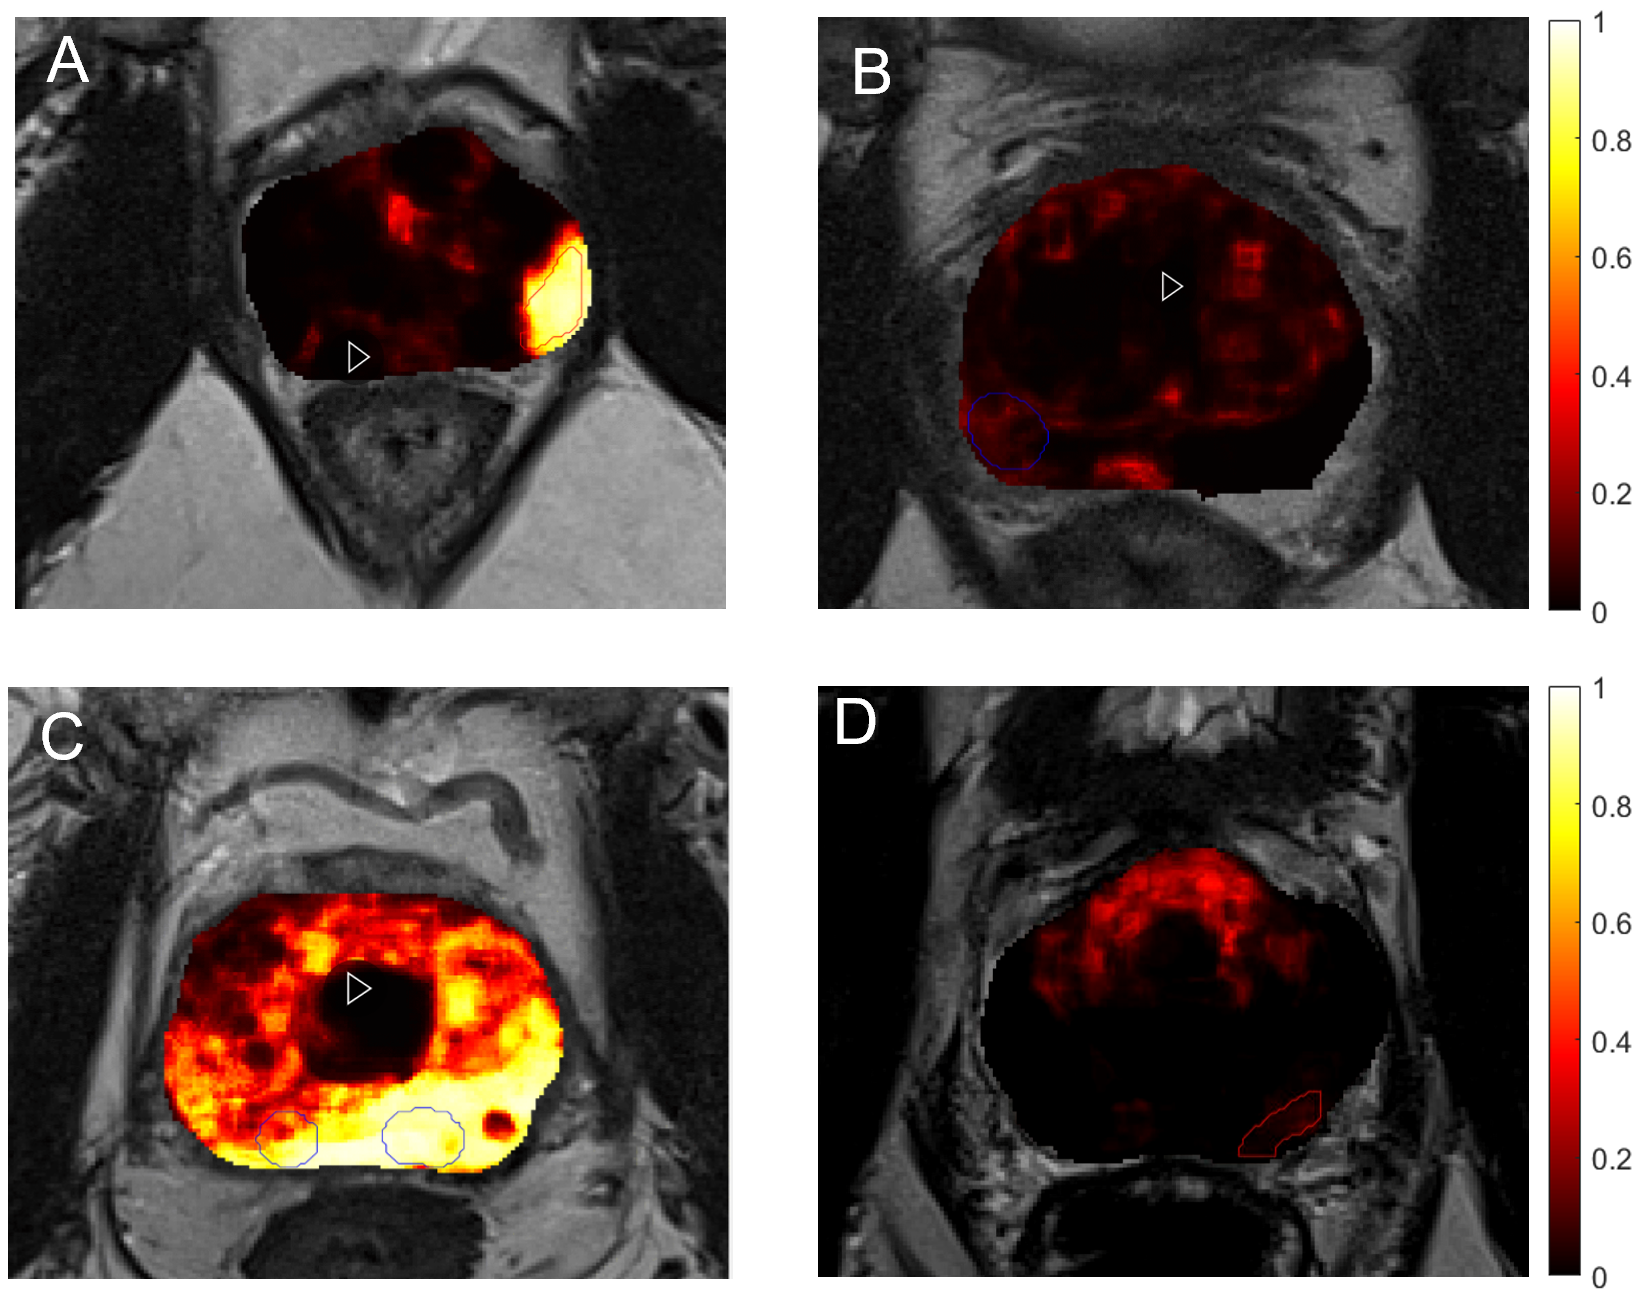
Figure 3: Examples of
predicted cancer probability maps back projected into T2-weighted image space. The red outline indicates regions that were
marked by the radiologist as potential clinically significant cancers and were
confirmed by biopsy (true positive), while the blue indicates regions rebutted
by biopsy (false positive). A, B, C and D depict true
positive, true negative, false positive and false negative predictions,
respectively.
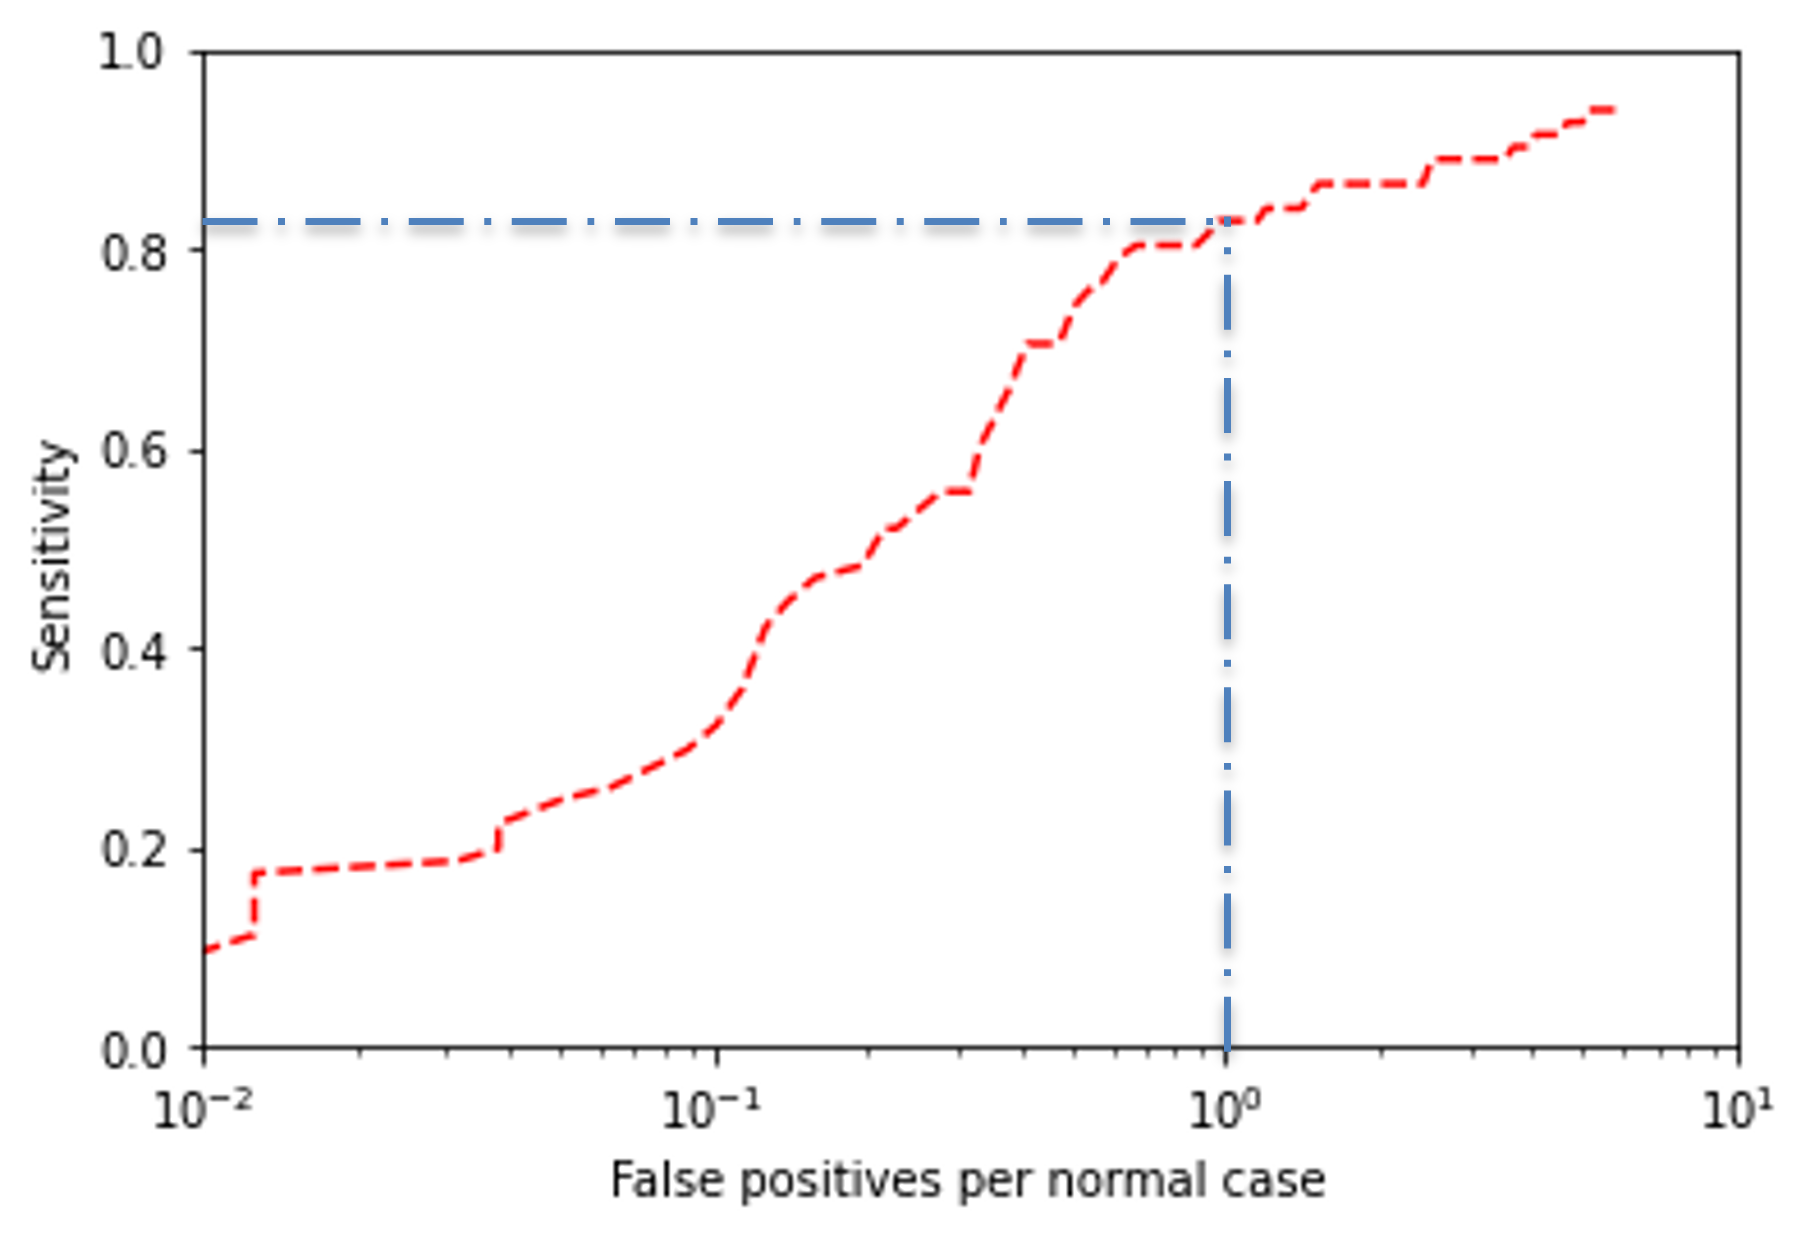
Figure
4: FROC analysis showing the utility of radiomics based
machine learning in detecting clinically significant prostate cancers on the
lesion level. At 1 false positive per normal case (blue line), the model
achieves a sensitivity of about 82%
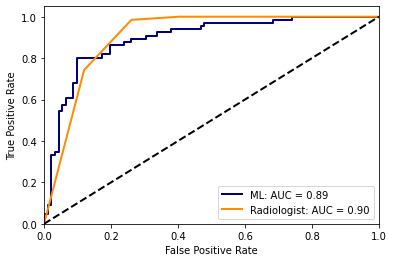
Figure
5: ROC analysis on per-patient level comparing the
performance of radiomics-based machine learning with clinical PI-RADS reading
by radiologist in detection of clinically significant prostate cancer.
DOI: https://doi.org/10.58530/2023/2891