2882
Radiomic feature reliability of protein-based amide proton transfer-weighted images of brain tumors acquired with compressed sensing
Jingpu Wu1,2, Yiqing Shen1,3, Qianqi Huang3, Pengfei Guo1,3, Jinyuan Zhou1, and Shanshan Jiang1
1Department of Radiology, School of Medicine, Johns Hopkins University, Baltimore, MD, United States, 2Department of Applied Mathematics and Statistics, Whiting School of Engineering, Johns Hopkins University, Baltimore, MD, United States, 3Department of Computer Science, Whiting School of Engineering, Johns Hopkins University, Baltimore, MD, United States
1Department of Radiology, School of Medicine, Johns Hopkins University, Baltimore, MD, United States, 2Department of Applied Mathematics and Statistics, Whiting School of Engineering, Johns Hopkins University, Baltimore, MD, United States, 3Department of Computer Science, Whiting School of Engineering, Johns Hopkins University, Baltimore, MD, United States
Synopsis
Keywords: Radiomics, Radiomics
Sensitivity encoding (SENSE) is a conventional practice for accelerating APTw image acquisition. To achieve an even higher acceleration, SENSE with compressed sensing (CS-SENSE) was introduced. However, its effect on the radiomic features extracted from the APTw images was yet studied. Here we extracted radiomic features from both SENSE- and CS-SENSE-APTw images and evaluated their reliability in different regions of interest (ROIs). Moreover, filters play an important part in emphasizing specific image characteristics in radiomics. The impact of filters on the radiomic features were also discussed. Our results provided a comprehensive reference for radiomic analyses where CS is implemented for acceleration.Introduction
Radiomics is a quantitative approach to convert the images to mineable high-dimensional data 1-3. Amide proton transfer-weighted (APTw) imaging is a novel molecular MRI technique that is able to provide endogenous contrast based on mobile proteins and peptides 4. In particular, radiomic analyses of APTw images were proved to have a great diagnostic value for brain tumors 5. As APTw images take relatively longer time to acquire, sensitivity encoding (SENSE) was widely adopted to accelerate the acquisition, while still keeping desirable image quality. SENSE with compressed sensing (CS-SENSE) is a novel technique to achieve even higher acceleration factors (AFs), but there is a tradeoff between AF and image quality. The effects of CS with different AFs for APTw images with brain tumor was recently evaluated 6 and an AF of 4 was recommended. However, the reliability of radiomic features extracted from CS-SENSE APTw images was still not studied. In this work, we extracted radiomic features from both SENSE (AF = 2) and CS-SENSE (AF = 4) APTw images and analyzed their consistency on different regions of interest (ROIs), the effects of different filters were also studied. We claim that our results can serve as a comprehensive reference for radiomic analyses based on APTw images with CS-SENSE.Methods
MR imaging was performed on a Philips 3T MRI scanner. A recommended 3D APTw imaging sequence 6 (saturation power = 2 μT; saturation time = 2 sec; TR = 6.5 sec; FOV = 212×192 mm2; 15 slices; slice thickness = 4 mm; matrix = 120×118, reconstructed to 256×256; SENSE = 2 or CS-SENSE = 4) was used to acquire APTw images. 40 patients with post-treated malignant gliomas (age 54.6 ± 17.0 years) were included in our study. Structural MR images were also acquired for reference, including T1-weighted (T1w), T2-weighted (T2w), fluid-attenuated inversion recovery (FLAIR), and gadolinium-enhanced T1-weighted (Gd-T1w).For each patient, skull-striping and ROI segmentation including normal tissue, edema, liquefactive necrosis (including surgical residual cavity) and tumor were manually performed based on the structural images (registered to APTw images). PyRadiomics was adapted to extract 3D radiomic features from original and filtered images (Wavelet, Laplacian of Gaussian (LoG), Square, SquareRoot, Logarithm, Exponential and Gradient filters were applied). Intraclass correlation coefficient (ICC) 7, a reliability index that reflects both degree of correlation and agreement between measurements, was implemented to measure the consistency of features extracted from SENSE-APTw and CS-SENSE-APTw images. ICC < 0.5, 0.5 ≤ ICC < 0.75, 0.75 ≤ ICC < 0.9, and ICC ≥ 0.9 indicate poor, moderate, good, and excellent reliability, respectively 8. A paired t-test was performed for each filter to confirm whether it can significantly improve the ICCs for a specific ROI.
Results and Discussion
For each combination of ROI and filter, the mean and standard deviation of ICCs were listed in Table 1, and the proportions of radiomic features with poor, moderate, good and excellent reliability were shown in Figure 1. In the original images, tumor mass showed significantly higher ICCs compared to the other three ROIs. ICCs for all FirstOrder radiomic features extracted from the tumor in original images were listed in Table 2. Most of these features have achieved good to excellent reliability, suggesting that features from tumor in original images were already satisfactory for radiomic analyses. We hypothesized that the good reliability of tumor was because the tumor area usually presents higher signals (hyperintensity) in APTw images along with the higher signal-to-noise ratios (SNR). Therefore, the stability under CS is supposed to be higher especially in which the data are undersampled and the signals are lost to some extent. This is a desirable finding, since the tumor area is usually of the most interest in clinical diagnosis.For other ROIs, the reliabilities were generally above moderate but far from good or excellent. Appropriate filters may be applied to improve radiomic reliability. As shown in Table 1, the exponential filter can significantly improve the reliability for all ROIs (p < 0.01) while the square filter can significantly improve the reliability for all ROIs except normal tissue (p < 0.01).
Conclusion
Tumor regions achieved significantly higher reliability under CS-SENSE than normal tissue, edema, and liquefactive necrosis. For radiomic analyses based on CS-SENSE-APTw images, features extracted from the tumor in original images may be reliable enough. For ROIs with normal tissue, edema, and liquefactive necrosis, filters are suggested to improve the reliability. The exponential filter can significantly improve the reliability for all ROIs, while the square filter can significantly improve the reliability for all ROIs except normal tissue.Acknowledgements
The authors thank our clinical collaborators for help with the patient recruitment and MRI technicians for assistance with MRI scanning. This study was supported in part by grants from the NIH.References
- Gillies RJ, Kinahan PE, Hricak H. Radiology. 2016;278:563–577.
- Rizzo S, Botta F, Raimondi S, et al. Eur Radiol Exp. 2018;2:36.
- Lambin P, Rios-Velazquez E, Leijenaar R, et al. Eur J Cancer. 2012;48:441–446.
- Zhou J, Zaiss M, Knutsson L, et al. Magn Reson Med. 2022;88:546-574.
- Jiang S, Guo P, Heo HY, et al. NMR Biomed. 2022;e4824.
- Zhang N, Zhang H, Gao B, et al. Front Neurosci. 2022;16:876587.
- Bartko J. Psychol Rep. 1966;19:3–11.
- Koo, TK, Li MY. J Chiropr Med. 2016;15:155–163.
Figures
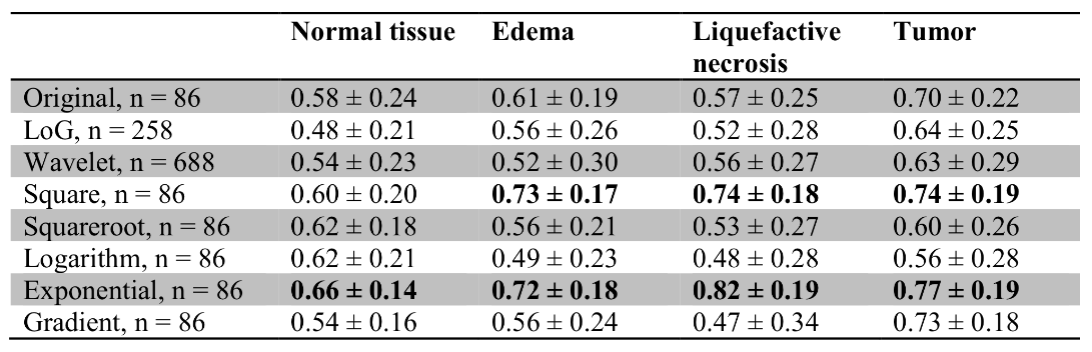
Table 1. Mean ± standard values of ICCs for
3D radiomic features extracted from SENSE- and CS-SENSE-APTw images, n is the
number of features extracted. Cells in bold indicate that features extracted
from images with specific filters have significantly higher ICCs than those
ICCs of features extracted from original images (p < 0.01).
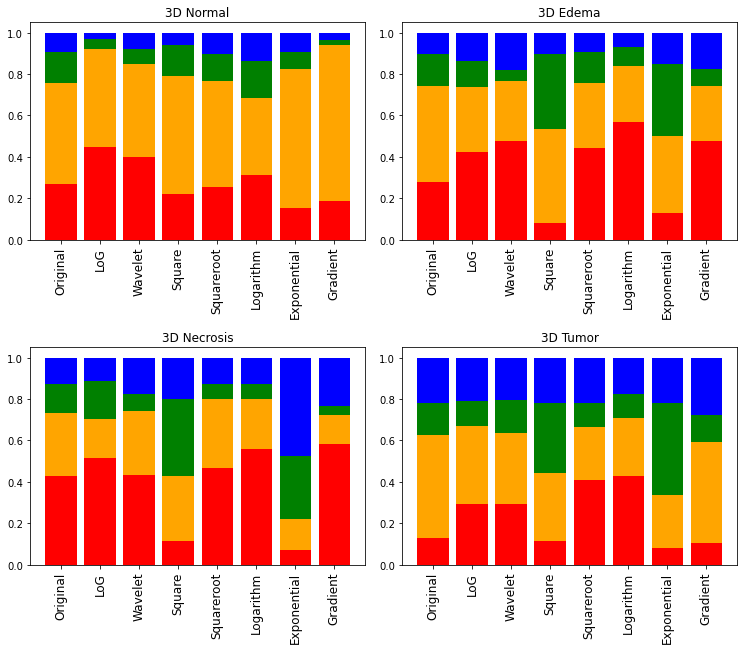
Figure 1. Proportions
of 3D radiomic features in different ROIs with poor (red), moderate (orange),
good (green) and excellent (blue) reliability between APTw images with SENSE
and CS-SENSE.
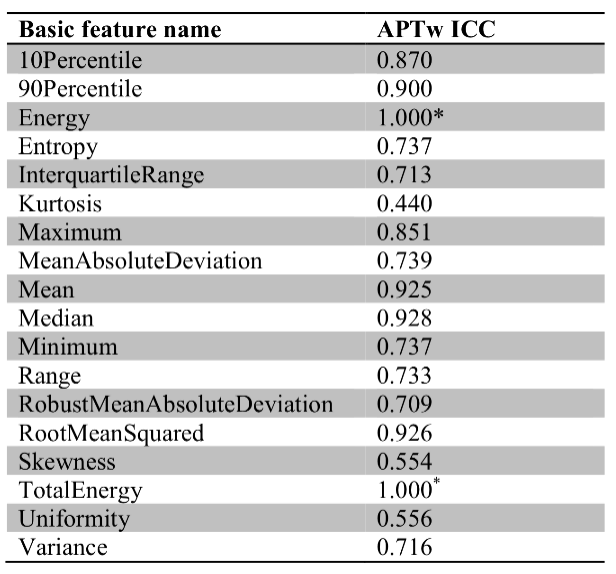
Table 2. ICCs for all FirstOrder radiomic features extracted from tumor in
original SENSE- and CS-SENSE-APTw images.
DOI: https://doi.org/10.58530/2023/2882