2881
MRS combined with enhanced silhouette in the prediction of malignant glioma radiomics classification1The Second Hospital of Hebei Medical University, Shijiazhuang, China, 2GE Healthcare, Beijing, China
Synopsis
Keywords: Radiomics, Brain, Magnetic resonance spectroscopy
Question: Among the studies using radiomics methods to predict glioma grading, most of them are based on conventional magnetic resonance imaging sequences, and functional magnetic resonance imaging is less studied.
Methods: This study predicted malignant glioma grading based on magnetic resonance structural images and magnetic resonance spectroscopy using an radiomics approach.
Results: The test set AUC of the model constructed based on T1-enhanced images and the ratio of three metabolites of MRS was 0.95.
Conclusion: Radiomics based on T1-CE and MRS has a good performance in identifying both grade III and grade IV gliomas.
Background
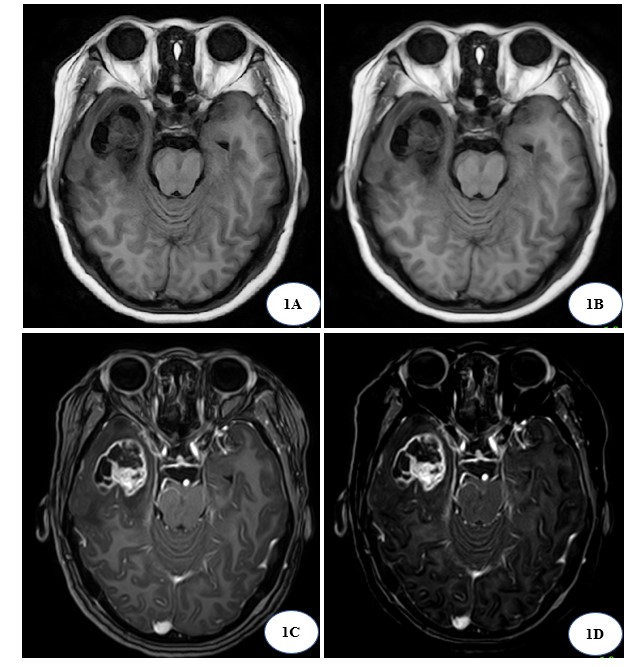
High-grade gliomas (including WHO grades III and IV) account for more than 50% of primary malignancies of the central nervous system [1]. Some studies have pointed out that grade III and IV gliomas have different genetic characteristics and advocate individualized treatment approaches [2]. Pathology is currently the gold standard for tumor grading, with the inherent limitation of sampling error due to the limited number of biopsy samples [3].MRI is the most important imaging method for diagnosing glioma grading, with T1 enhancement sequences providing information on tissue enhancement, silhouette images highlighting textural information by removing unenhanced portions, and spectroscopy providing metabolic information for the accurate detection and classification of high-grade gliomas in the brain. Therefore, this study combined MRI T1 enhancement, silhouette and MRS for radiomics analysis to identify high-grade glioma grading.Methods
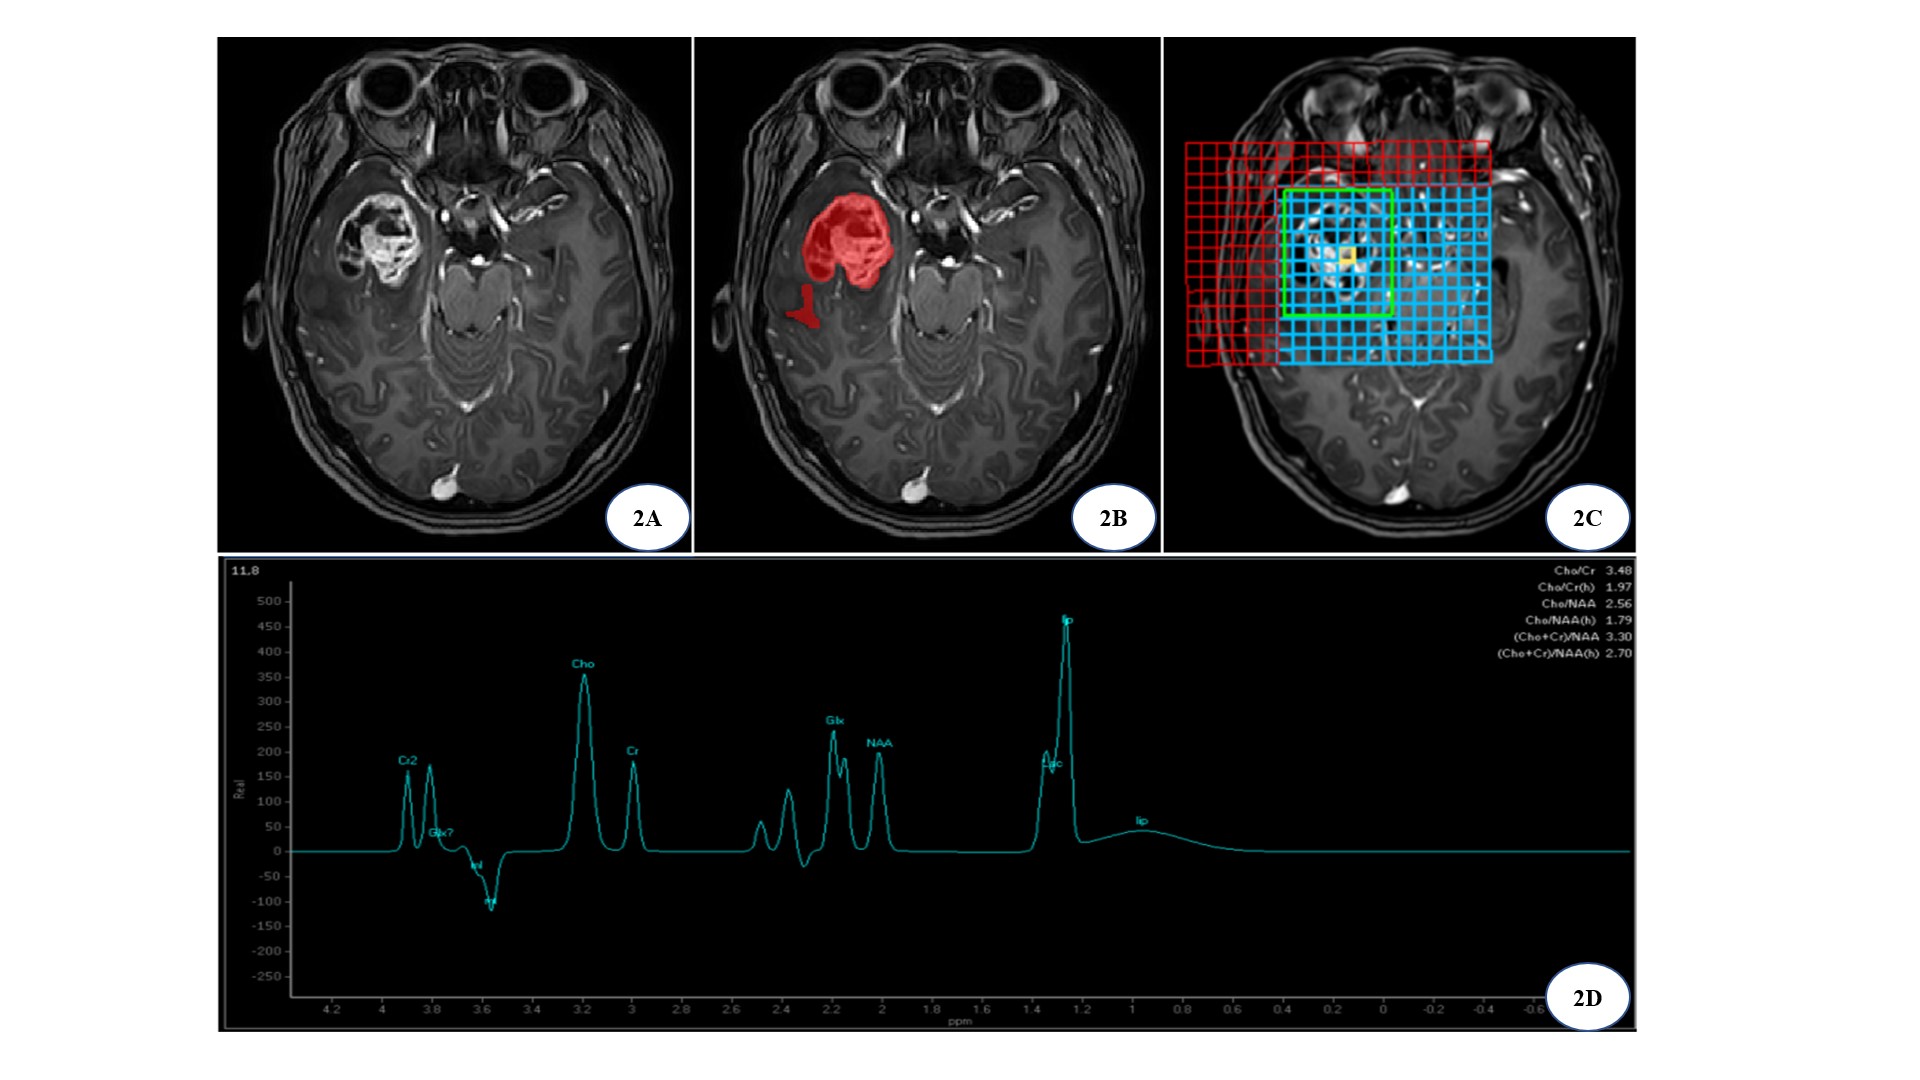
1. Data collection: 60 patients with glioma who attended the Second Hospital of Hebei Medical University were retrospectively collected for imaging information. (25 cases of grade III and 35 cases of grade IV).2. MR image processing: Align its T1-enhanced image with the T1WI image and subtract the two to obtain the silhouette image; use the post-processing workstation to phase and frequency correct the spectral data and calculate the peak height ratios of NAA/Cr, Cho/Cr, and Cho/NAA.
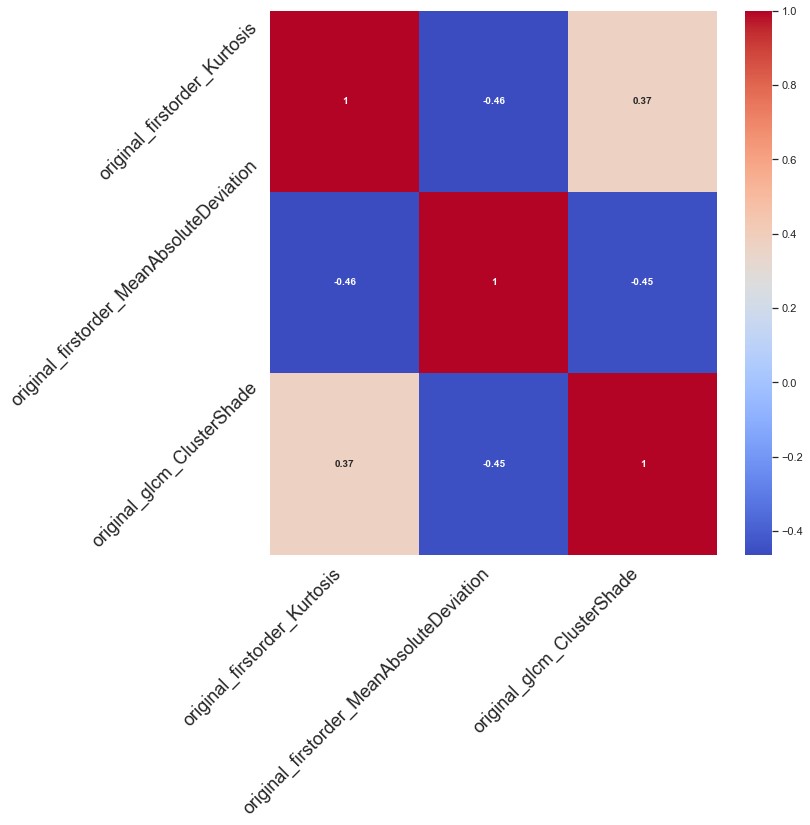
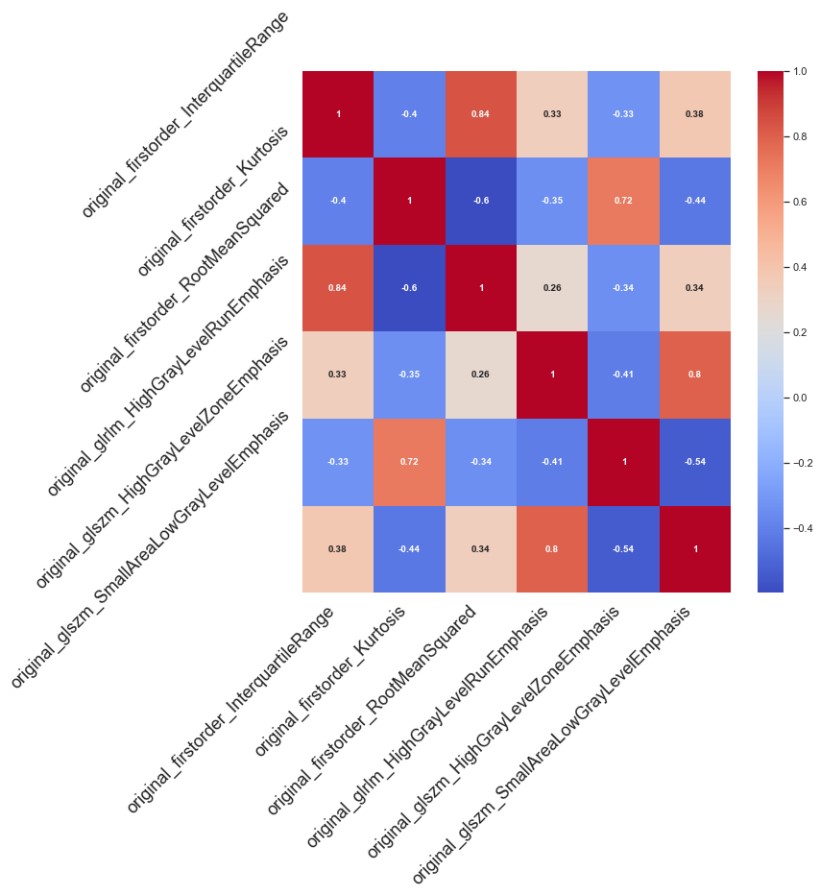
3. Radiomics processing: Two radiologists used ITK-SNAP to outline the ROI, including the tumor region and peritumor edema region, independently and manually. Radiomics features such as shape and texture were extracted based on T1-enhanced, silhouette images using the Pyradiomics package, feature screening was performed using two independent samples t-test, LassoCV, and the sample size was randomly divided into training and test sets according to 7:3. Combined with the 3 metabolite peak ratios of MRS, a random forest algorithm was used to construct the model and evaluate the model performance.
Results
The test set AUC of the model constructed based on the T1-enhanced image with 3 features screened out was 0.78; the test set AUC of the model constructed based on the silhouette image with 6 features screened out was 0.81; the test set AUC of the model constructed based on the 3 metabolite ratios of MRS was 0.8; the test set AUC of the model constructed based on T1-enhanced images and the ratio of the three metabolites from MRS was 0.95.Discussion
The 3D silhouette post-processing technique obtains the actual enhanced tissue by silhouetting the enhanced image with the plain image, highlight the enhanced lesion, greatly improving the resolution and diagnostic accuracy of the image [4]. In this study, the accuracy of the test set of the RF model established based on T1-enhanced images to identify malignant gliomas was 78% with an AUC of 0.78; the accuracy of the test set of the model constructed based on silhouette images was 72% with an AUC of 0.81, and the classification ability of the model based on silhouette images was better than that of T1-enhanced images.Biochemical indicators in the brain can be measured by magnetic resonance spectroscopy, which when used in combination with standard MRI can predict the grade of identified lesions [5]. Metabolite ratios of spectroscopy including Cho/NAA, Cho/Cr and NAA/Cr have shown moderate diagnostic performance in differentiating advanced grade gliomas [6]. Therefore, in this study, three metabolite ratios of wave spectra Cho/NAA, Cho/Cr and NAA/Cr were chosen to build a RF classification model with an accuracy of 78% and AUC of 0.8 for the test set. Vamvakas A [7] et al. used conventional MRI sequences, DTI and MRS (NAA/Cr, Cho/Cr, mI/Cr and lipid/Cr) to identify high and low grade gliomas and found that MRS with Lipids/Cr ranked first in feature importance, and the constructed SMO classifier achieved an accuracy of 95.5% with an AUC of 0.96.
It has been shown that multimodal MRI data can provide more information than single modality and the models built have better performance [7,8]. Therefore, in this study, T1-enhanced images, MRS and silhouette images were combined two by two and modeled separately, and the results showed that the combined T1-CE and MRS worked best, and the established RF model had an AUC of 0.95, which outperformed the single sequence, in line with Su C [8].
Limitations of this study: First, the amount of data collected was small and lacked independent external validation, and the amount of data will be increased in the future to verify the feasibility of this study. Secondly, because this study was a retrospective study, a uniform collection standard could not be determined, and a uniform collection standard should be developed in the future to reduce the errors caused by inconsistent collection techniques. Finally, this study did not combine clinical information such as age and genes, and will combine clinical information to deepen the study in the future.
Conclusion
The radiomics based on T1-CE, silhouette and MRS has good performance in identifying malignant gliomas. Compared with T1-CE, silhouette images can highlight the image enhancement information, and the model based on them is more effective; MRS can provide metabolic information, and its quantitative data can complement T1-CE to identify malignant gliomas.Acknowledgements
We are grateful to the Second Hospital of Hebei Medical University for financial support of this study, and to Mr. Lizhi Xie of GE Healthcare MR Research China Beijing, for guidance of this study.References
[1] Ostrom QT, Cioffi G, Gittleman H, et al. CBTRUS Statistical Report: Primary Brain and Other Central Nervous System Tumors Diagnosed in the United States in 2012-2016. Neuro Oncol. 2019;21(Suppl 5):v1-v100.
[2] Dreyfuss JM, Johnson MD, Park PJ. Meta-analysis of glioblastoma multiforme versus anaplastic astrocytoma identifies robust gene markers . Mol Cancer. 2009;8:71.
[3] Zidan S, Tantawy HI, Makia MA. High grade gliomas: The role of dynamic contrast-enhanced susceptibility-weighted perfusion MRI and proton MR spectroscopic imaging in differentiating grade III from grade IV. Egypt. J. Radiol. Nucl. Med. 2016;47(4):1565-1573.
[4] Mengnan W, Huiqin H, Xiaoyuan Z, et al. Value of DWI imaging combined with 3D silhouette for diagnosis and staging of cervical cancer. Modern Med Imagel. 2022;31(04):614-617+623.
[5] Rafique Z, Awan MW, Iqbal S, et al. Diagnostic accuracy of magnetic resonance spectroscopy in predicting the grade of glioma keeping histopathology as the gold standard. Cureus. 2022,14(2):e22056.
[6] Wang Q, Zhang H, Zhang J, et al. The diagnostic performance of magnetic resonance spectroscopy in differentiating high-from low-grade gliomas: a systematic review and meta-analysis. Eur Radiol. 2016;26(8):2670–2684.
[7] Vamvakas A, Williams SC, Theodorou K, et al. Imaging biomarker analysis of advanced multiparametric MRI for glioma grading. Phys Med. 2019;60:188-198.
[8] Su C, Jiang J, Zhang S, et al. Radiomics based on multicontrast MRI can precisely differentiate among glioma subtypes and predict tumour-proliferative behaviour. Eur Radiol. 2019;29(4):1986-1996.
Figures