2864
RF-induced heating of interventional devices at 0.55T1Division of Medical Physics, Department of Radiology, University Medical Center Freiburg, Freiburg, Germany, 2Department of Radiology, University Medical Center Freiburg, Freiburg, Germany
Synopsis
Keywords: Safety, Interventional Devices, Low Field, RF-induced heating
Low-field high-performance MRI systems at 0.55T are expected to cause less RF heating in conventional interventional devices compared to clinical 1.5T or 3T systems, which would facilitate MR-guided interventions significantly. Here we systematically evaluate the safety of intravascular devices through high-resolution electric field mapping, transfer function measurements, and realistic device trajectories from vascular models. Furthermore, the effects of patient size and positioning, target organ (liver and heart), and transmit body coil type are tested at a low-field RF test-bench for 6 commonly-used interventional devices (two guidewires, two catheters, an applicator and a biopsy needle).Introduction
RF-induced heating of implants and devices in the MRI environment is a result of the coupling of external electromagnetic (EM) transmit fields with elongated metallic structures [1], [2]. The heating depends on incident E field [3], EM properties of device and surrounding tissue, input impedance [4], [5] and insertion length [6]. Low-field high-performance MRI systems (e.g., at 0.55T) are expected cause less RF-induced heating than current clinical 1.5T or 3T systems [7]. Guidelines to assess RF-induced heating of devices and implants are based on two approaches:1. Measurements of the temperature increase around implants for an empirical worst-case positioning [8]
2. Analysis of RF exposure by the RF transmit coil along the lead pathways in combination and measurement of a position-independent lead RF response [9]
Although the ISO 10974 standard is intended for active implantable medical devices (AIMDs), in principle, it can also be applied to interventional guiding catheters (GC), guidewires (GW) and biopsy needles (BN). As interventional devices are partially immersed in the body, their insertion length is not constant over time, and the temperature hot spot is not necessarily an exposed tip [10]. Therefore, we use an adapted ISO 10974 tier 3 procedure, where the actual RF-induced heating hot spots of the devices are detected, and the insertion length is varied for various procedures.
In this study, we combine high-resolution electric field mapping for hot-spot detection with transfer function (TF) measurements. We use realistic vascular models to guide device trajectories and compare RF-induced heating of commonly-used interventional devices for different target organs, RF body coils, and positions.
Methods
A modified Tier-3 approach was applied [10], where high resolution E-field maps were measured for hot-spot detection during RF excitation at fLarmor(0.55T)=23.66MHz, and TF measurements were performed by placing an electro-optic sensor (EOS) [11] at the hot spot [6]. TFs were calibrated using various dipole excitation patterns [10]. An RF test-bench was constructed for temperature measurements with a regular (Coil1) and a modified 16-leg-birdcage (Coil2) quadrature body coil (Fig.2). Realistic device trajectories for coronary artery (CA) and hepatic artery (HA) catheterizations were obtained from CT angiograms of two patients (female: 157cm, male: 185cm) (Fig.1C). Temperature measurements were performed using a 4-channel fiber optic temperature sensor (FOTEMP, Optocon AG, Dresden, Germany) in a gel phantom (30g/L HEC and 1.55g/L NaCl, εr = 82.5, σ = 0.63 S/m @23.7MHz) as described in [8], but with a higher container to fit the 3D-printed vascular models.Measurement results were acquired at different positions of the phantom and the vascular model by shifting them by ±10cm in x- and y-direction, and by ±5cm in z-direction (Fig. 1B). Different cardiac catheterization methods (femoral artery right/left access) and insertion lengths (80, 85, 90, 95cm) as well as patient (head/feet first) and operator (left/right) positions were assessed. The following clinical routine devices were tested: Terumo Radiofocus Guidewire M (Ø 0.89mm, 180cm) (GW) and Medtronic SiteSeer 5F (Ø 1,67mm) guiding catheter (GC) for CA engagement; and Radiofocus Guidewire M (Ø 0.89mm, 260cm, straight tip) and a microcatheter (μC) for HA engagement. For HA catheterization, insertion lengths of 60, 65, 70cm were tested. RF heating was measured using a pulse train (pulse duration: 1ms, TR = 5ms, power: 1.8W/kg, 2min heating). Temperature measurements were performed also for an applicator for a coaxial BN pair: 15/20cm, introducer needle: 7.5/10cm (Amica Probe, HS Hospital Service, Rome, Italy) for various insertion lengths and positions (Fig.1A).
Body coils were simulated using FDTD (Sim4Life, ZMT, Zürich), and tangential E fields along the trajectories were extracted to calculate temperature rise based on TF measurements. The RF input power was scaled to achieve mean B1+ of 11.75µT within the center of the phantom.
Results
E field mapping with the EOS shows that hot spots can be as much as 4cm far away from the tip (Fig.3). Measured TFs are shown for all four devices (Fig.3). Temperature measurements are summarized in Fig.4. For CA catheterization, a maximum temperature rise of 1.2K was measured for Coil 1 (position-dependent variance: 0.7K). The difference between ΔTmax for right and left CA was less than 0.4K. For the CA, Coil2 causes an up to 0.8K less temperature increase. HA catheterization resulted consistently in less temperature rise (ΔTmax = 0.7K) than the RCA and LCA trajectories (ΔTmax = 1.2K) for all patient sizes and positions. (Fig.4). HA trajectories in 157cm/185cm patient models varied only by ΔTmax = 0.2K/0.3K. Maximum position-dependent variation was below 0.5K for 90% of the cases. For the applicator and needle, maximum temperature rise was 0.4K for all the tested cases. TF-based temperature rise and RF-induced heating measurements were comparable to the measurements, except μC engaged to HA case for Coil2 (Fig. 5).Discussion
HA catheterizations require shorter insertion length than CA, thus, less RF-induced heating as shown in both temperature and TF measurements. The resonance length at 23.7MHz was measured as 120cm which is above typical device insertion lengths for all studied cases; therefore, these measurements indicate that an extended safety margin might be applicable at 0.55T compared to 1.5T (resonance length measured as 35 cm). Although the RF-induced heating could be measured only for 2 minutes, the temperature curves were already saturated at the end of this period. Local SAR estimated from the temperature curves was 276W/kg in the most extreme case and was in good agreement with the simulations.Acknowledgements
Technical support by M. Malzacher, J. Nistler, M. Leghissa, B. Kraus of Siemens Healthineers. Coil models were provided by the vendors. We also thank Isil Winkler of Dept. Radiology and Neuroradiology, UKSH, Campus Kiel, Germany for converting the vascular models to mesh structures. Finally, grant support by BMBF (13GW0356B), and DFG under CRC 1425 (Project P15) are gratefully acknowledged.
The mention of commercial products, their sources, or their use in connection with material reported herein is not to be construed as either an actual or implied endorsement of such products by the authors or their institutions.
References
[1] F. G. Shellock, “Radiofrequency Energy-Induced Heating During MR Procedures: A Review,” J. Magn. Reson. Imaging, vol. 12, no. 1, pp. 30–36, Jul. 2000, doi: 10.1002/1522-2586(200007)12:1<30::AID-JMRI4>3.0.CO;2-S.
[2] C. J. Yeung, R. C. Susil, and E. Atalar, “RF heating due to conductive wires during MRI depends on the phase distribution of the transmit field,” Magn. Reson. Med., vol. 48, no. 6, pp. 1096–1098, 2002, doi: 10.1002/mrm.10310.
[3] S.-M. Park, R. Kamondetdacha, and J. A. Nyenhuis, “Calculation of MRI-induced heating of an implanted medical lead wire with an electric field transfer function,” J. Magn. Reson. Imaging, vol. 26, no. 5, pp. 1278–1285, Nov. 2007, doi: 10.1002/jmri.21159.
[4] A. C. Özen, T. Lottner, and M. Bock, “Safety of active catheters in MRI: Termination impedance versus RF‐induced heating,” Magn. Reson. Med., vol. 81, no. 2, pp. 1412–1423, Feb. 2019, doi: 10.1002/mrm.27481.
[5] A. C. Özen, B. Silemek, T. Lottner, E. Atalar, and M. Bock, “MR safety watchdog for active catheters: Wireless impedance control with real‐time feedback,” Magn. Reson. Med., vol. 84, no. 2, pp. 1048–1060, Aug. 2020, doi: 10.1002/mrm.28153.
[6] T. Lottner, S. Reiss, A. Bitzer, M. Bock, and A. Caglar Ozen, “A Transfer Function Measurement Setup With an Electro-Optic Sensor for MR Safety Assessment in Cascaded Media,” IEEE Trans. Electromagn. Compat., vol. 63, no. 3, pp. 662–672, Jun. 2021, doi: 10.1109/TEMC.2020.3040756.
[7] A. E. Campbell-Washburn et al., “Opportunities in Interventional and Diagnostic Imaging by Using High-Performance Low-Field-Strength MRI,” Radiology, vol. 293, no. 2, pp. 384–393, Nov. 2019, doi: 10.1148/radiol.2019190452.
[8] American Society for Testing and Materials International, “Designation: ASTM F2182-19, Standard Test Method for Measurement of Radio Frequency Induced Heating On or Near Passive Implants During Magnetic Resonance Imaging,” West Conshohocken, PA, 2019.
[9] ISO 10974, “Assessment of the safety of magnetic resonance imaging for patients with an active implantable medical device,” 2018.
[10] A. C. Özen, S. Reiss, O. Lottner, Thomas Yildirim, Dursun Korel Kocaturk, and M. Bock, “MR Safety Assessments of Active Implantable and Interventional Devices in a Single Measurement Setup,” in Proc. Intl. Soc. Mag. Reson. Med. 29, 2021, p. 364, [Online]. Available: https://cds.ismrm.org/protected/21MPresentations/abstracts/0364.html.
[11] S. Reiss, A. Bitzer, and M. Bock, “An optical setup for electric field measurements in MRI with high spatial resolution,” Phys. Med. Biol., vol. 60, no. 11, pp. 4355–4370, Jun. 2015, doi: 10.1088/0031-9155/60/11/4355.
Figures
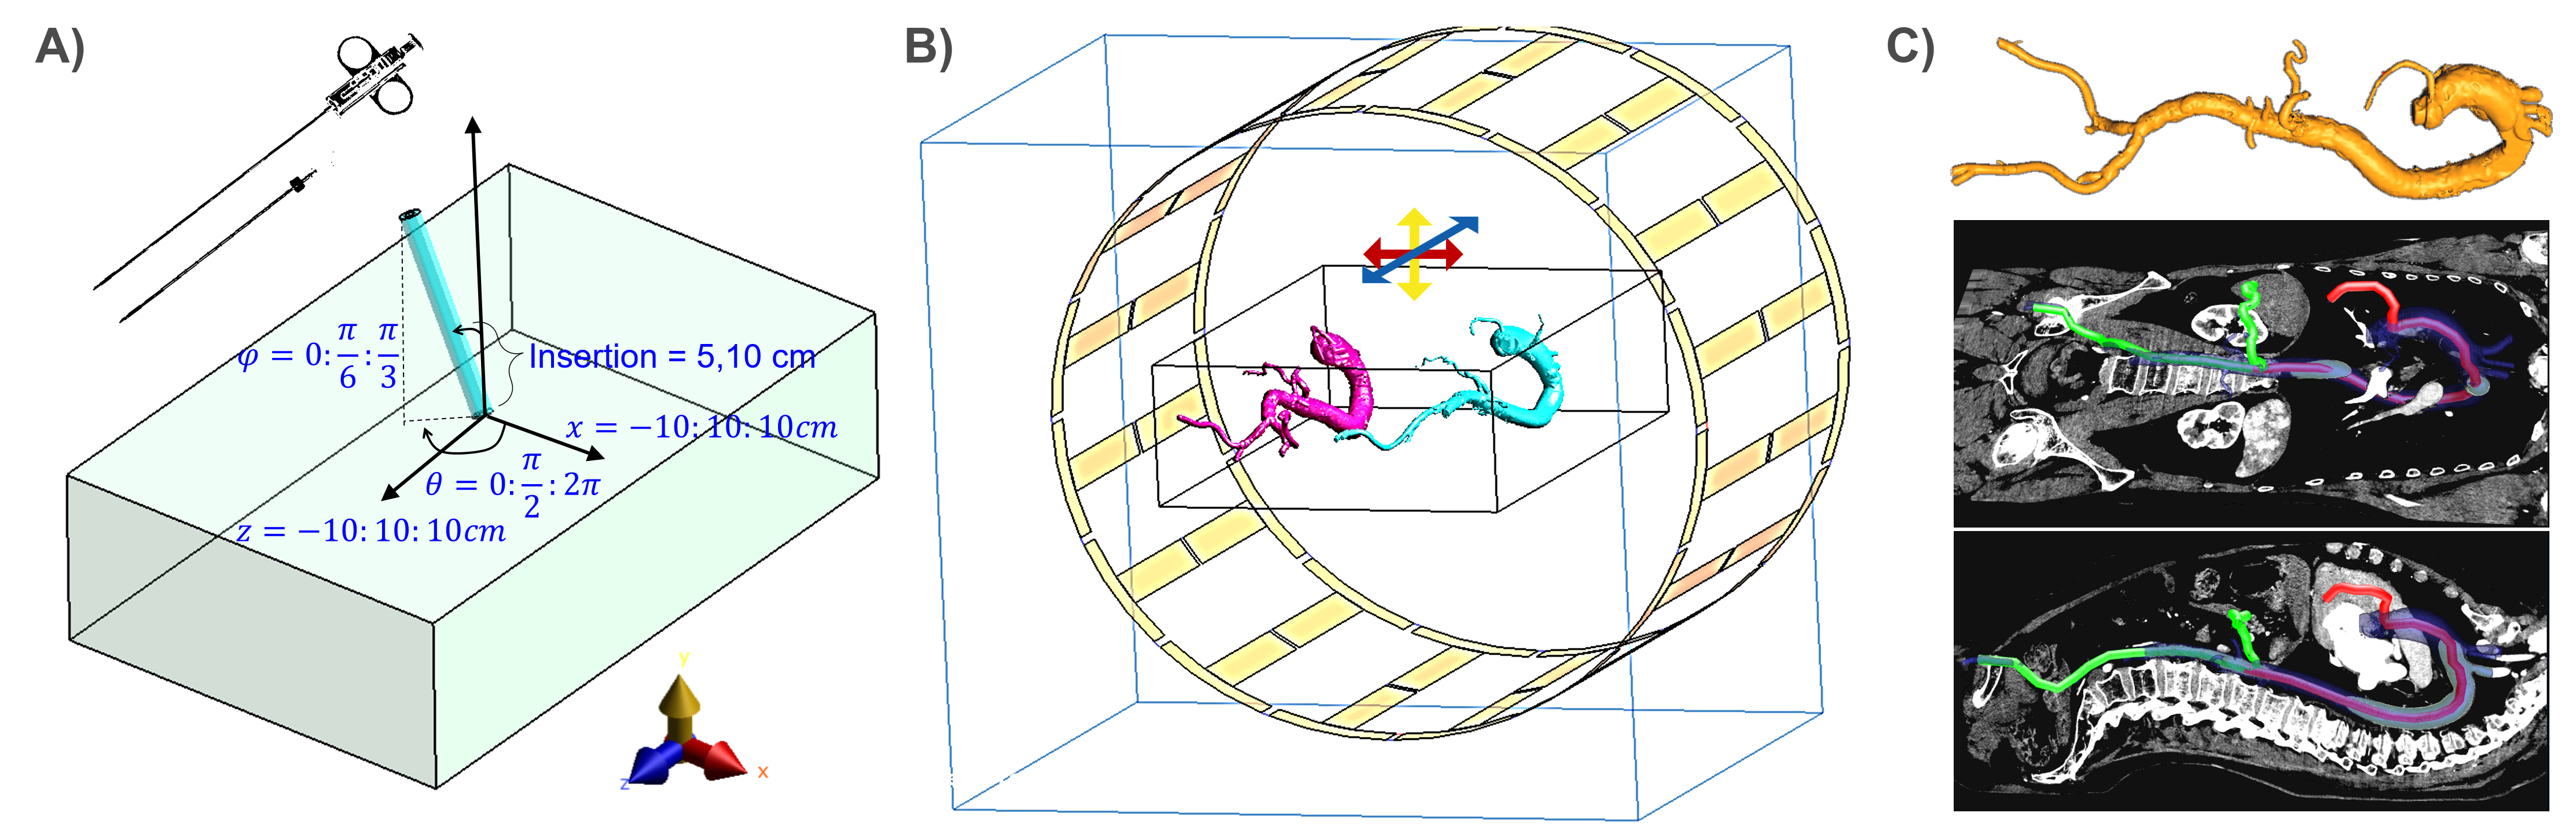
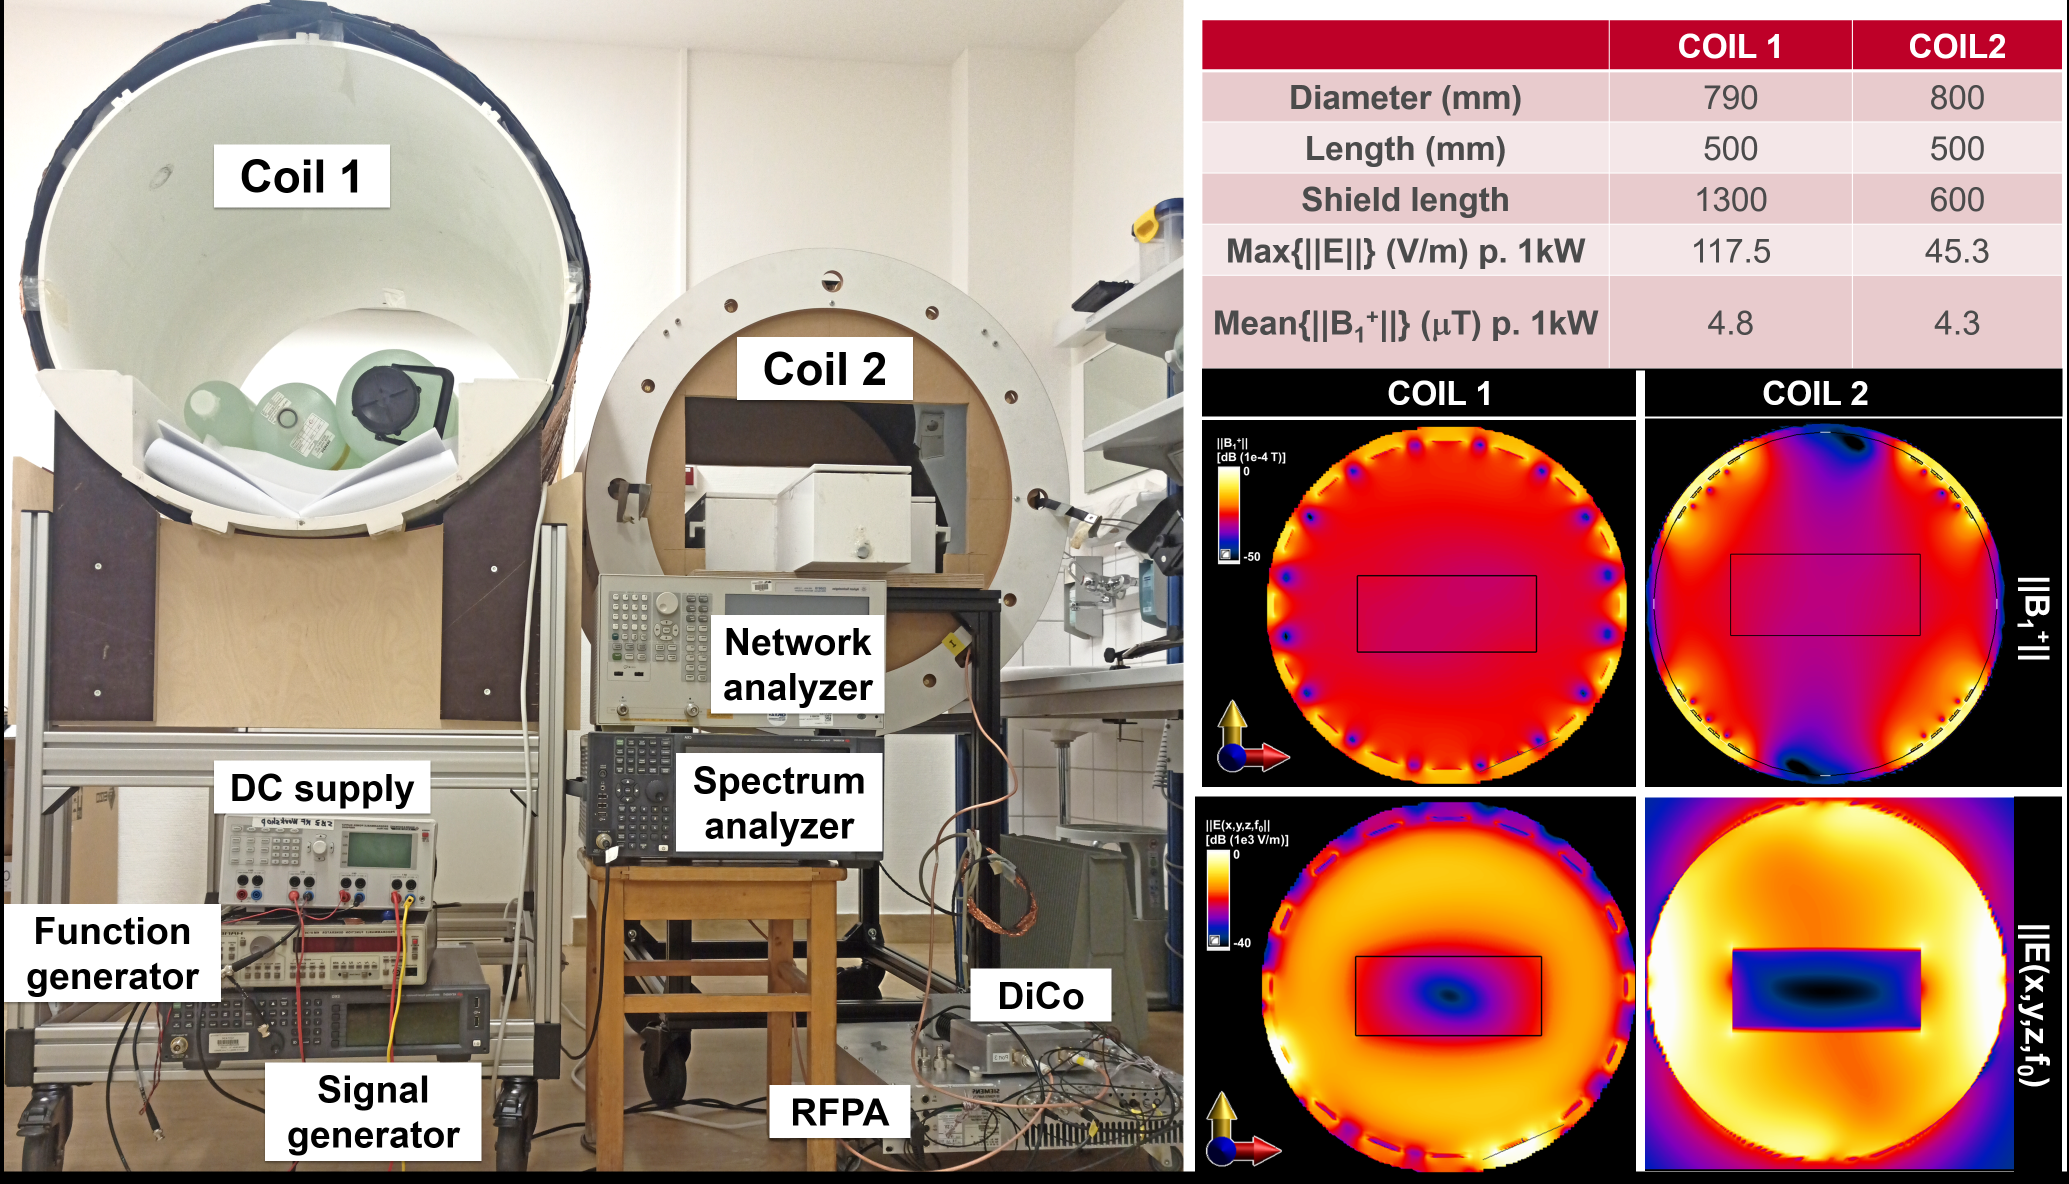
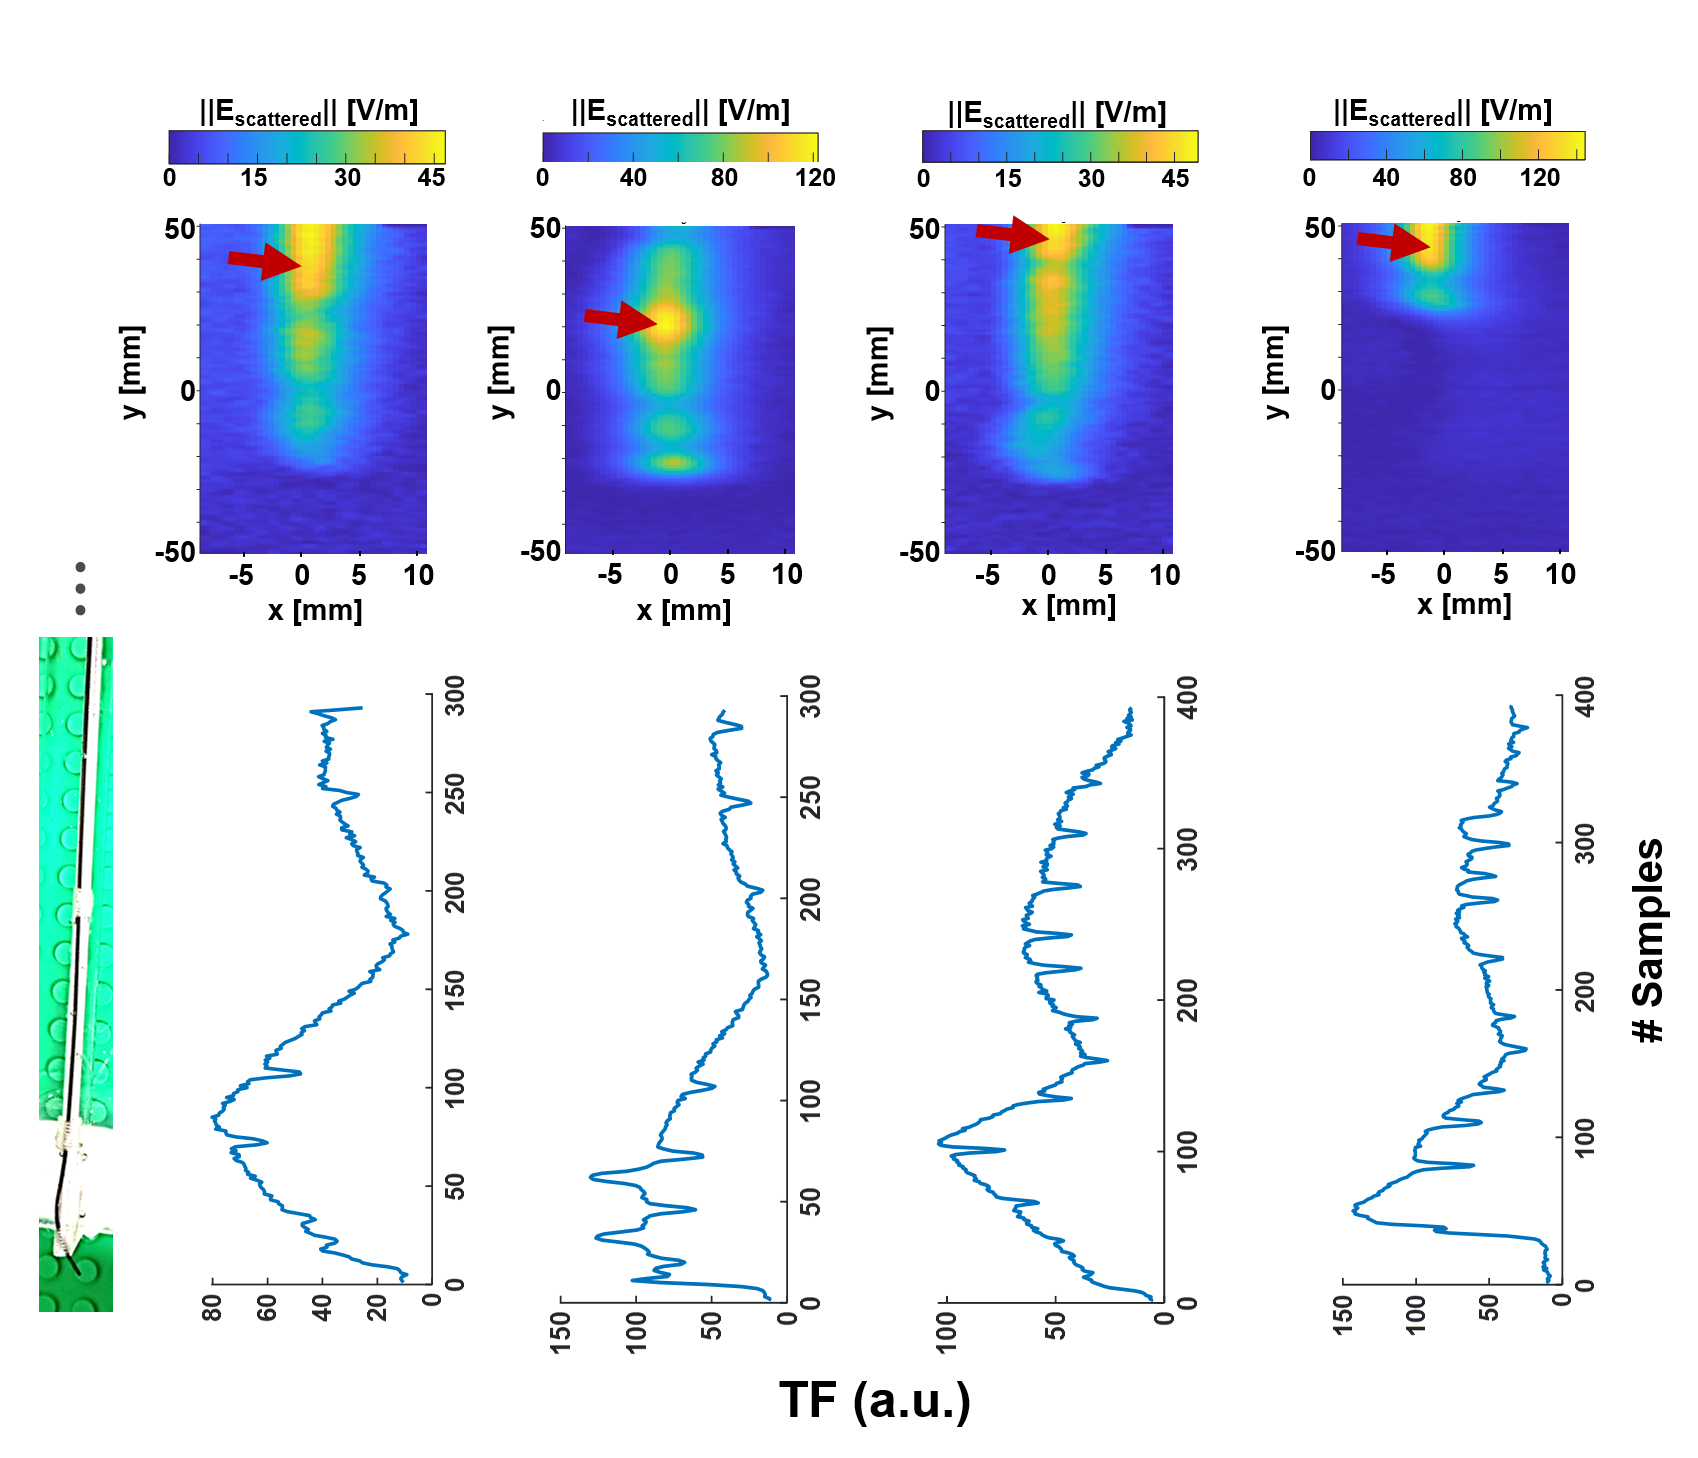
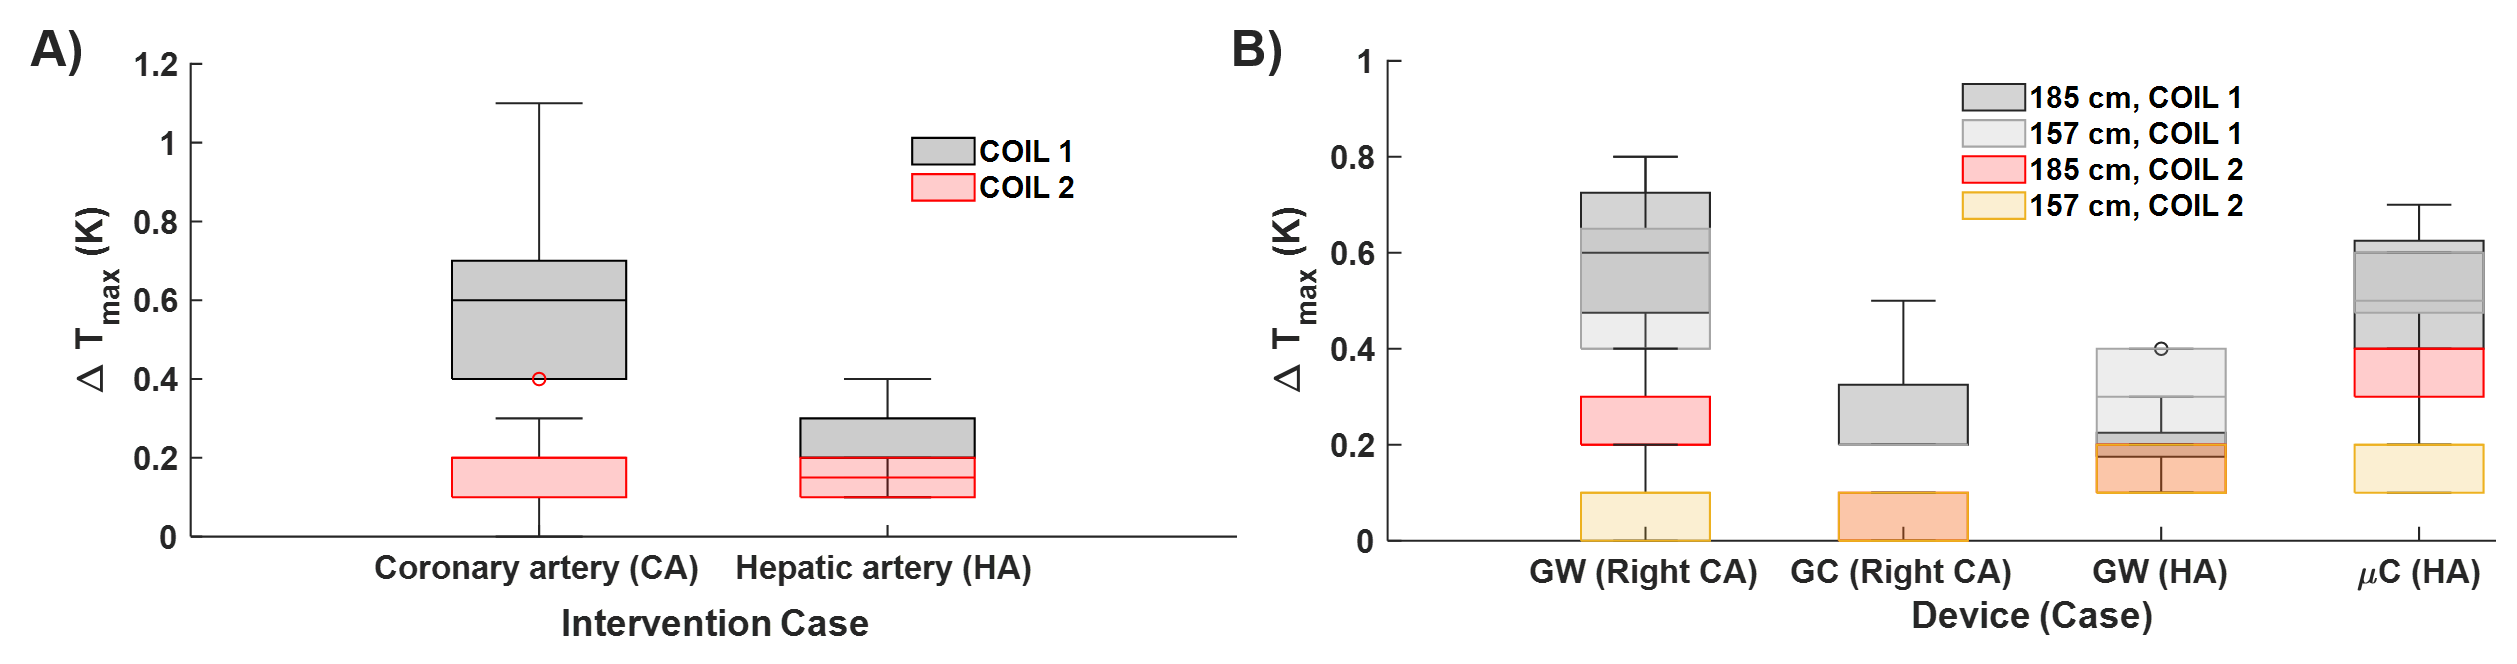
Fig.4: Temperature measurements at different positions of the vascular models inside the phantom. A) Comparison of different coils w.r.t. the interventional targets: coronary artery (CA) and hepatic artery (HA). Unless specified, left CA engagement is assumed. Due to the shorter insertion length, HA case results in lower temperature rise. B) Coil1 cause a higher temperature rise than Coil2. For both coils, guidewire GW for CA and mC yields higher temperature rise. Larger patient size also correlates with higher temperature rise for all the device and coil combinations.
