2856
Altered Gray Matter Volume and Functional Connectivity in Type 2 Diabetes Mellitus1Department of Magnetic Resonance, Lanzhou University Second Hospital, LanZhou, China
Synopsis
Keywords: Brain Connectivity, Diabetes, Neuroimaging, type 2 diabetes mellitus, VBM, resting-state fMRI, Cognition
Keyword: Neuroimaging, type 2 diabetes mellitus, VBM, resting-state fMRI, Cognition
The main purpose of this study was to evaluate the structural brain alterations and related functional abnormity of type 2 diabetes(T2DM), and its correlation with cognitive scale. Changes in brain volume were assessed using voxel-based morphology (VBM), while VBM Results were used to build ROI to analyse related functional connectivity (FC) changes in brain function. The result indicated that decreased gray matter volume and decreased functional connectivity may represent the neurobiological mechanism underlying cognitive dysfunction in patients with T2DM.
Introduction
Type 2 diabetes mellitus (T2DM) is a long-term systemic metabolic disease characterized by insulin resistance and hyperglycemia. Cognitive impairment in T2DM usually manifests as functional deficits in working memory, attention, and execution[1]. Neuroimaging has been used to non-invasively characterize the changes of brain structure and function in patients with T2DM, compared with healthy controls(HC), mainly showing a decrease in gray matter volume and altered FC values[2]. However, those findings in previous neuroimaging studies were heterogenous, meanwhile, both structural and functional alternations were observed in data-driven respectively. Therefore, we hypothesized that structural brain abnormalities in T2DM also show relevant functional brain abnormalities, as well as cognitive impairments could be observed. Our study was aim to investigate the abnormalities in brain volume using voxel-based morphology (VBM), while use abnormal brain regions to evaluate functional connectivity, as well as the relationship with cognitive decrements.Materials and Methods
Twenty-seven patients with T2DM and seventeen HC were enrolled. All subjects were recruited from Lanzhou University Second Hospital. All the subjects underwent MR examinations on a 3T MR scanner (Siemens Verio, Erlangen, Germany) with a 8-channel phased-array head coil. Experimental sequences covered structural and functional sequences. 3D high-resolution magnetization-prepared rapid gradient echo (MPRAGE) sequence was used for VBM analysis (FOV: 256 × 256 mm; matrix: 256 × 256; TR = 1900 ms; TE = 2.79 ms; resolution = 1 × 1 mm; flip angle = 9°). Rest-fMRI images were acquired via an echo-planar imaging (EPI) sequence (180 volumes, 36 contiguous slices, FOV: 192 × 192 mm, matrix: 64 × 64, spatial resolution = 3 × 3 × 3 mm; TR = 2000 ms; TE =30 ms; flip angle = 90°). All patients finished complete neuropsychological assessments and laboratory tests, including MMSE, MoCA, blood biochemistry, glycosylated HbA1c levels.The CAT12 toolbox (http://www.neuro.uni-jena.de/cat/) was used with the default parameters running statistic parametric mapping (SPM12) software (http://www.fil.ion.ucl.ac.uk/spm/). The 3D-T1 images of each participant were segmented and then spatially registered using the DARTEL method. The processed images were further smoothed using an 8-mm full width at half-maximum (FWHM). Finally, the brain volumes of the gray matter (GM), white matter (WM), and cerebrospinal fluid were obtained.The rs-fMRI data were preprocessed with the toolbox for Data Processing & Analysis of Brain Imaging (DPABI, http://rfmri.org/dpabi )[3]. Conventional preprocessing procedure was applied. The significant brain regions generated from VBM were considered as region of interest and selected as the seed to calculate FC values. The two-sample t-test was conducted using the SPM12 software to compare brain volume and FC maps between the two groups. Statistical analyses of the general data and clinical and cognition variable were performed using the SPSS software.Results
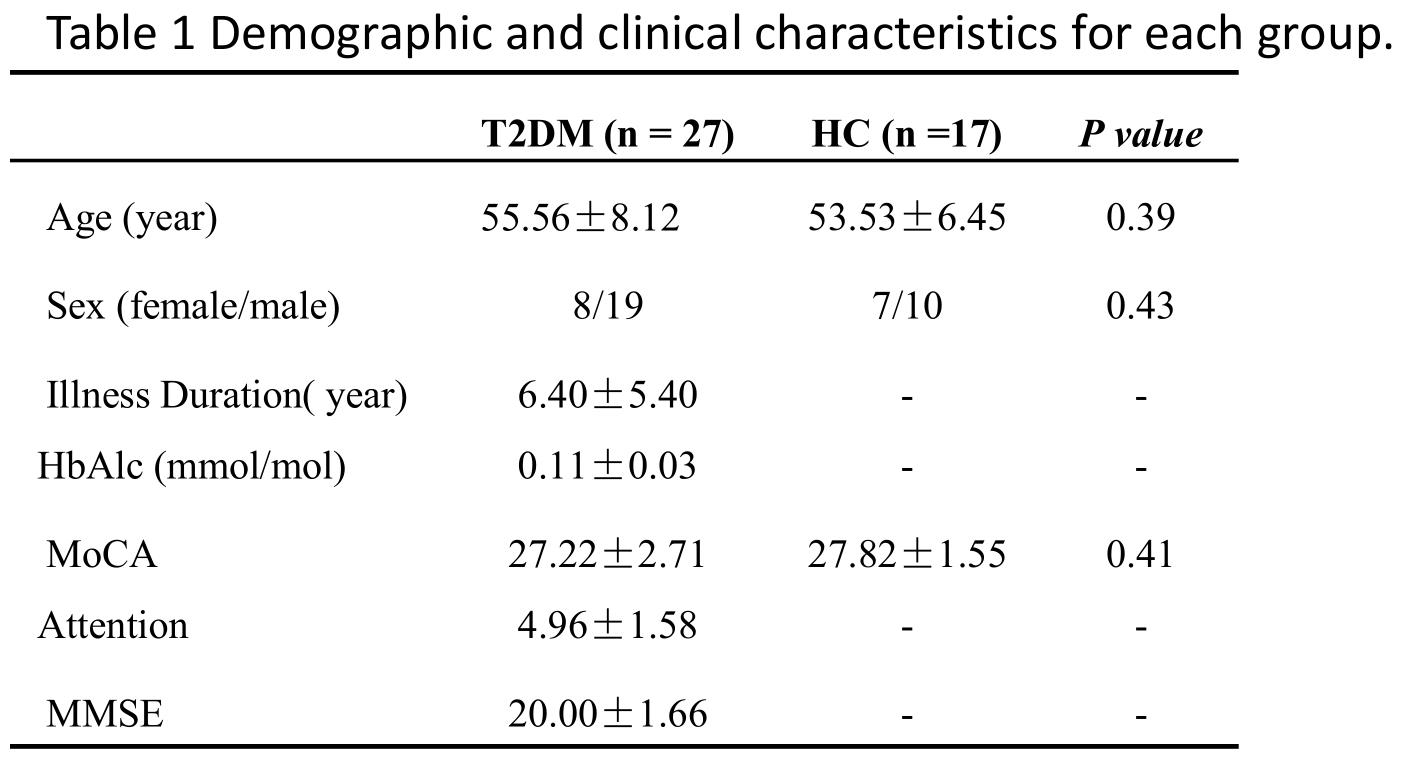
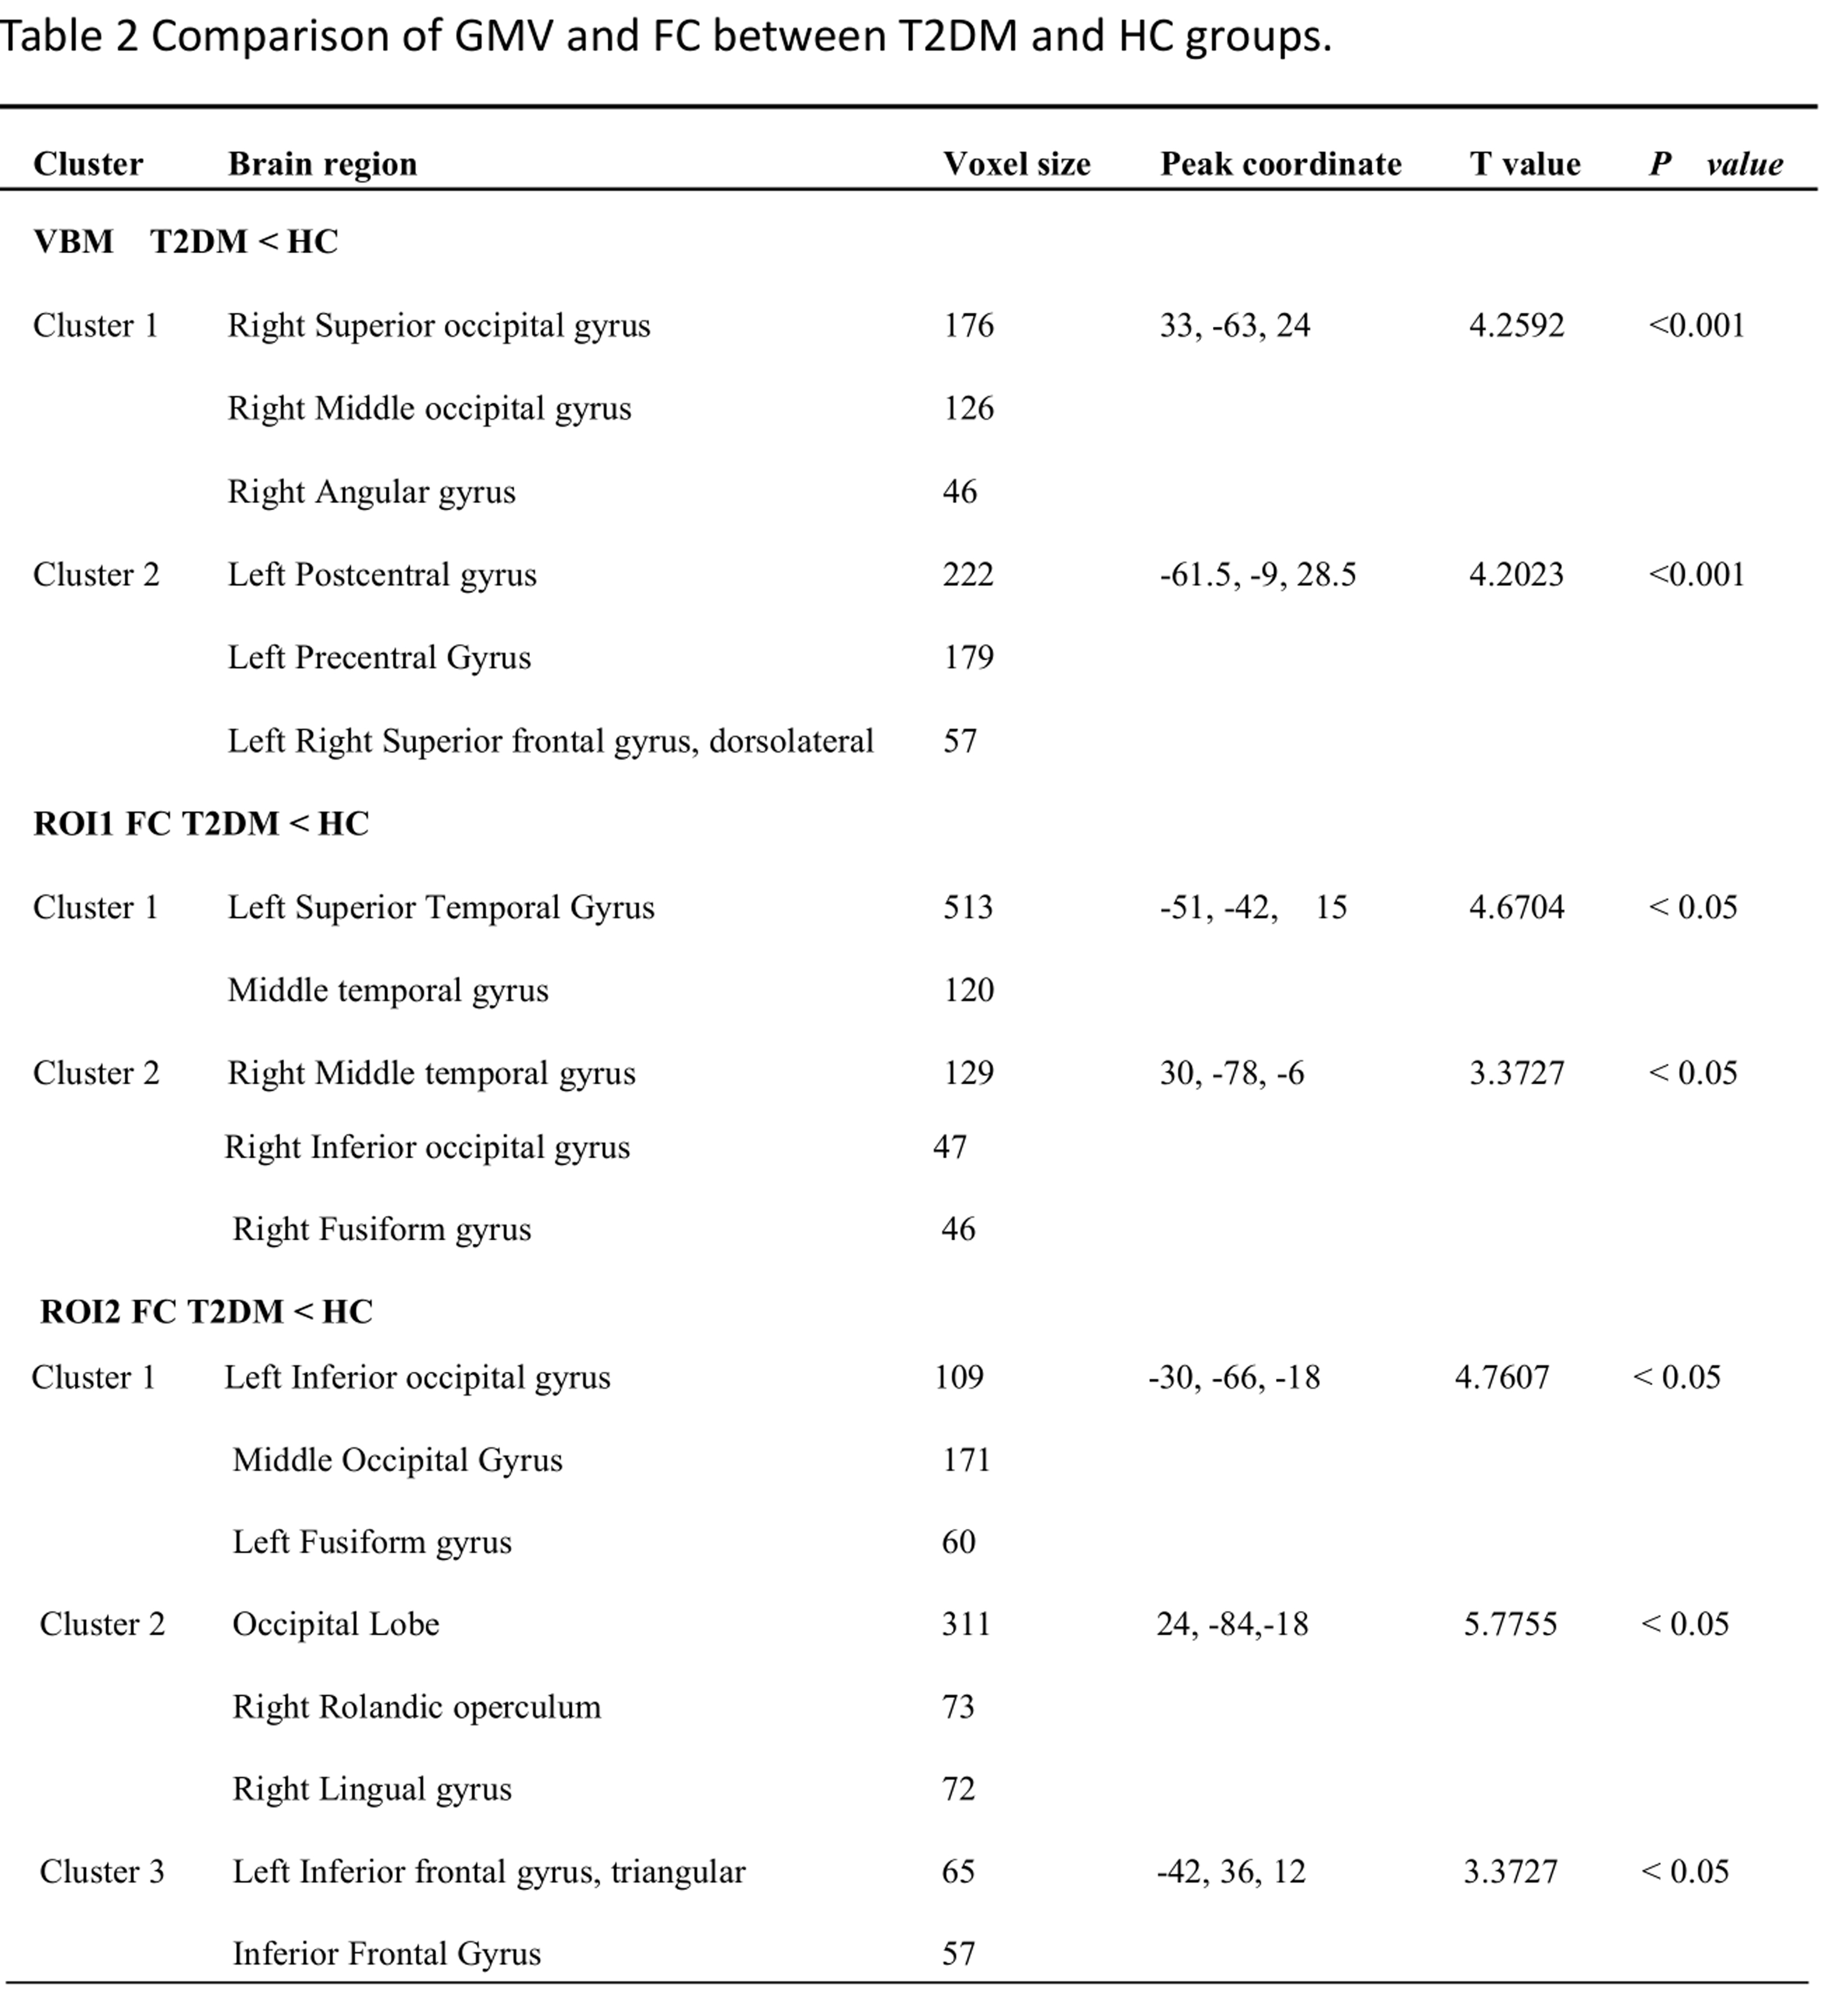
Demographic and clinical characteristics: information of T2DM and HC are listed in Table1. There were no significant intergroup differences in age, sex between groups (p > 0.05).Regional gray matter volume differences of the two groups: Using VBM analysis to examine regional normalized gray matter differences between groups, according to the two-sample t-test in SPSS, After adjusting for age, sex, and only considering clusters that consisted of >200 contiguous voxels, there were two clusters where GMV was significantly lower in the T2DM group than HC (uncorrected p < 0.001) (Table 2), cluster 1 included the right superior occipital gyrus, middle occipital gyrus, angular gyrus, left parahippocampal gyrus, cluster 2 included left postcentral gyrus, precentral gyrus, right superior frontal gyrus,. No brain region demonstrated an increase in GMV.
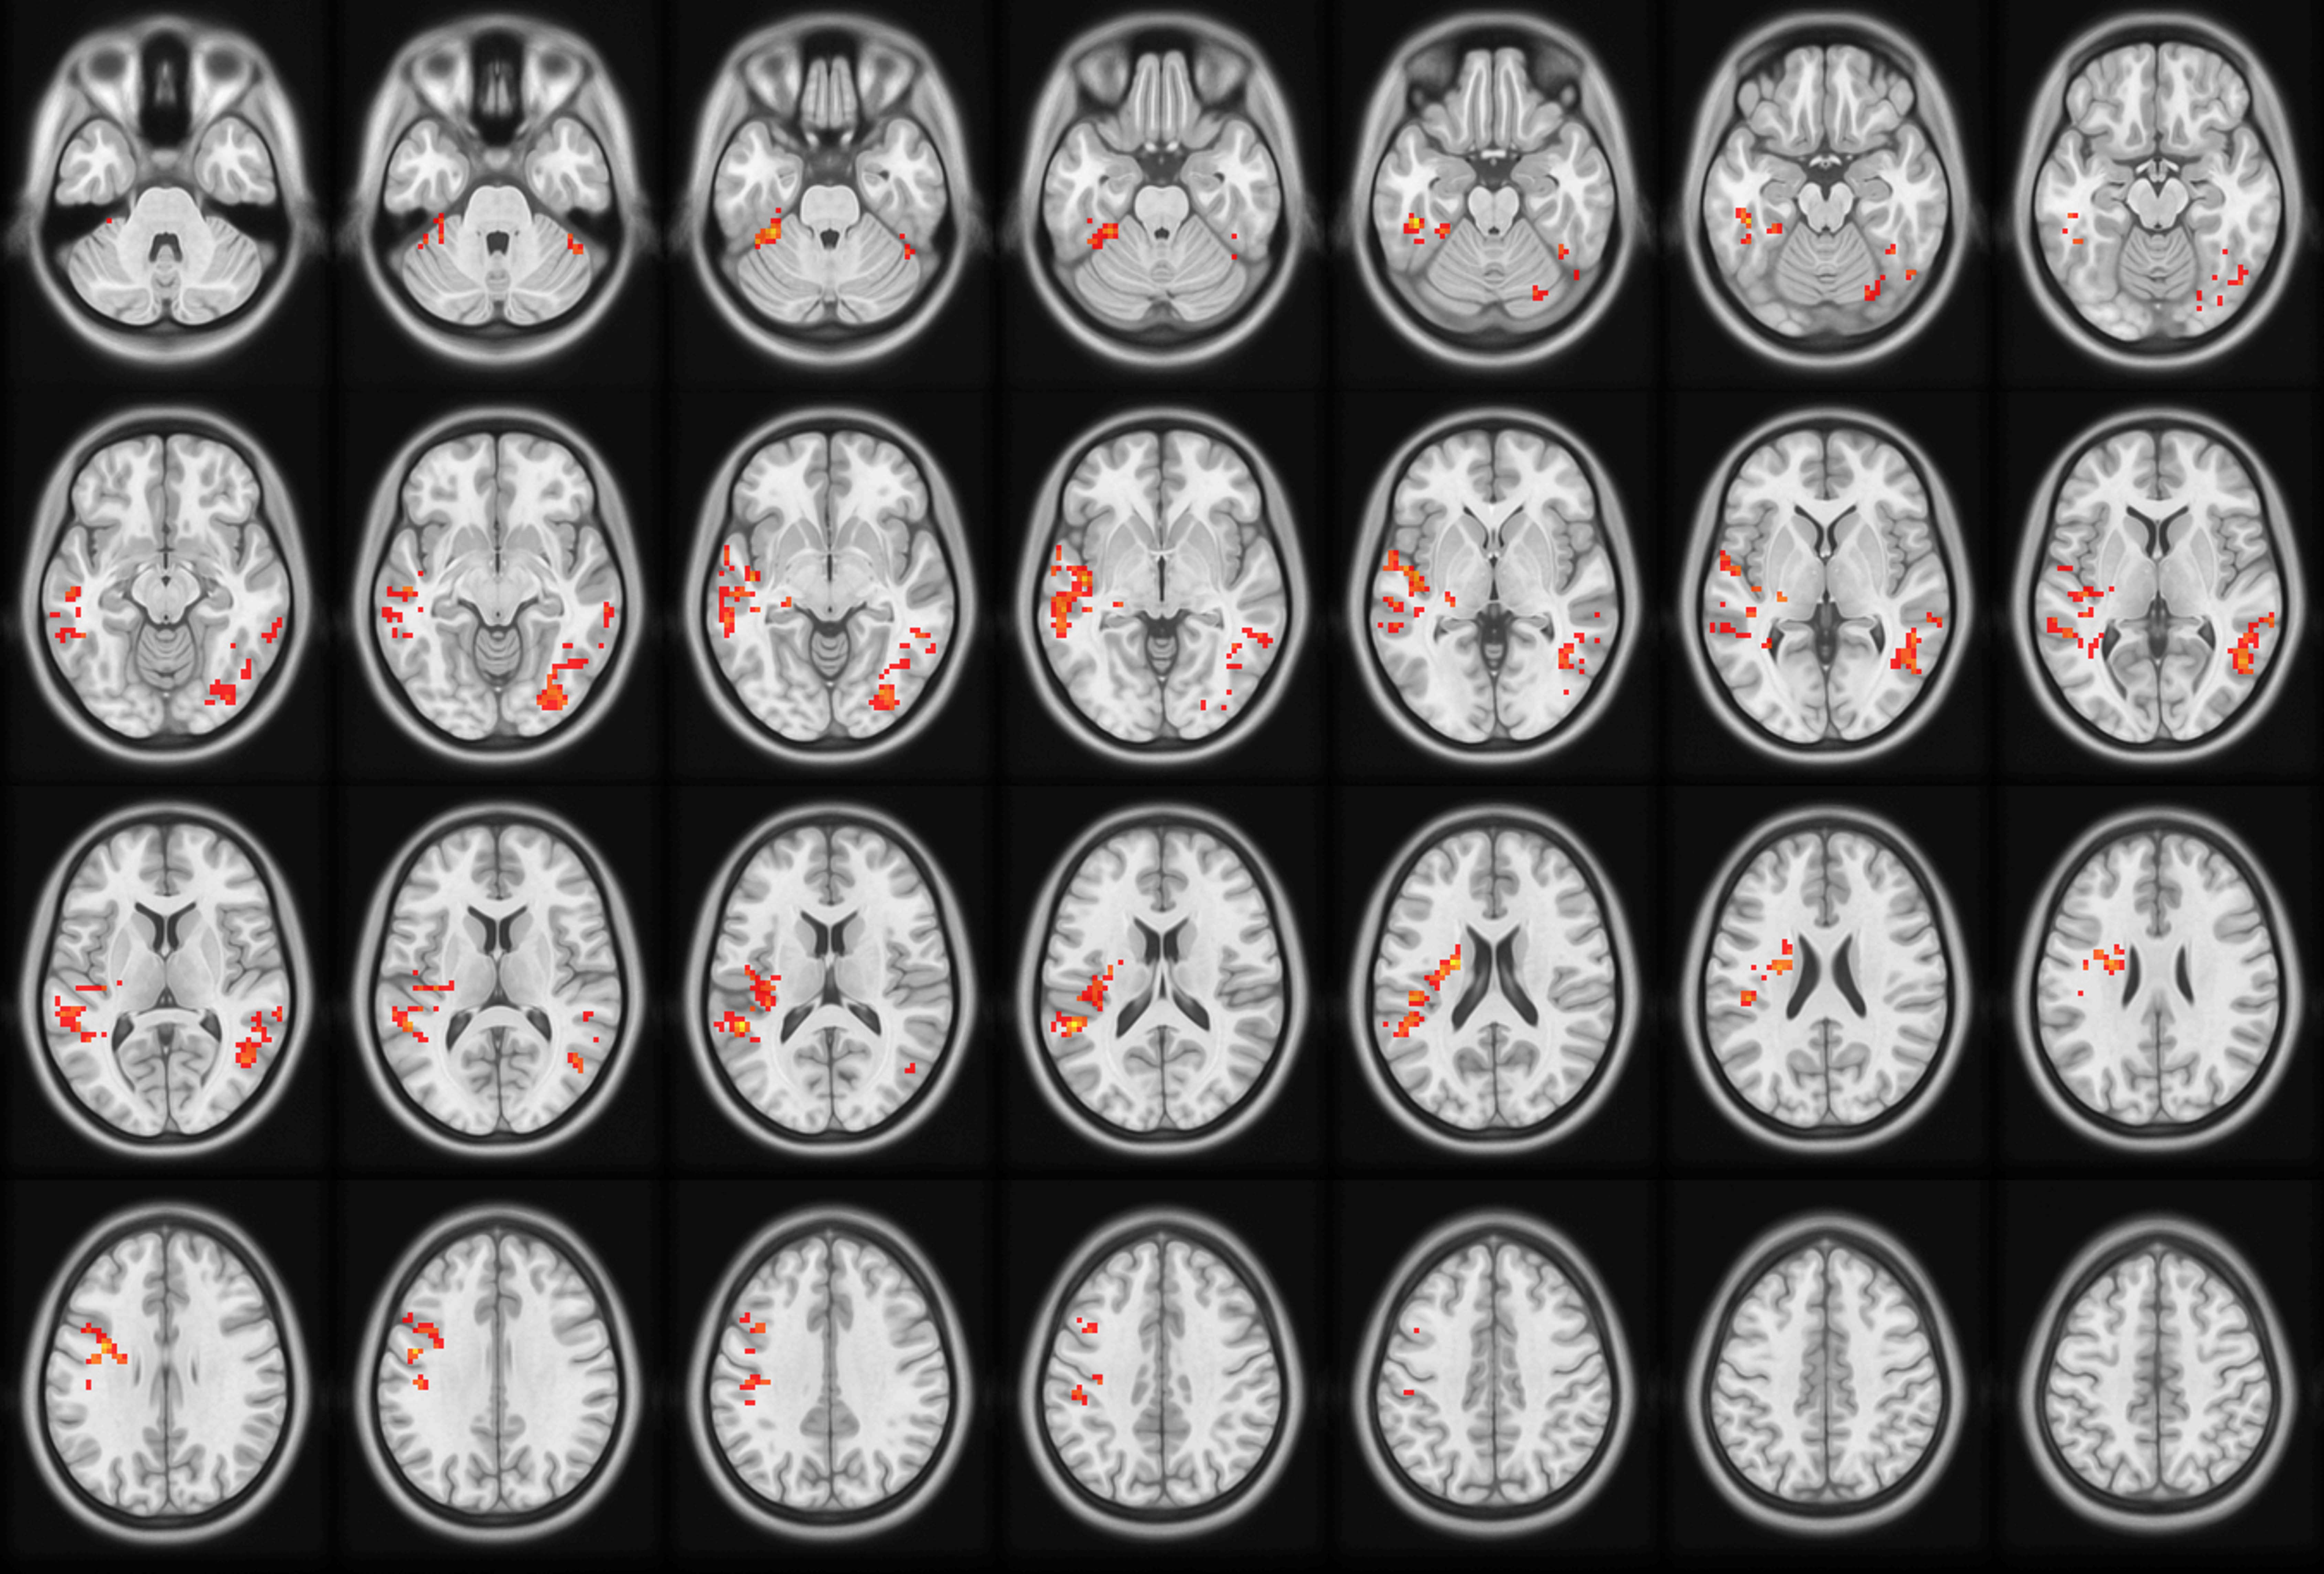
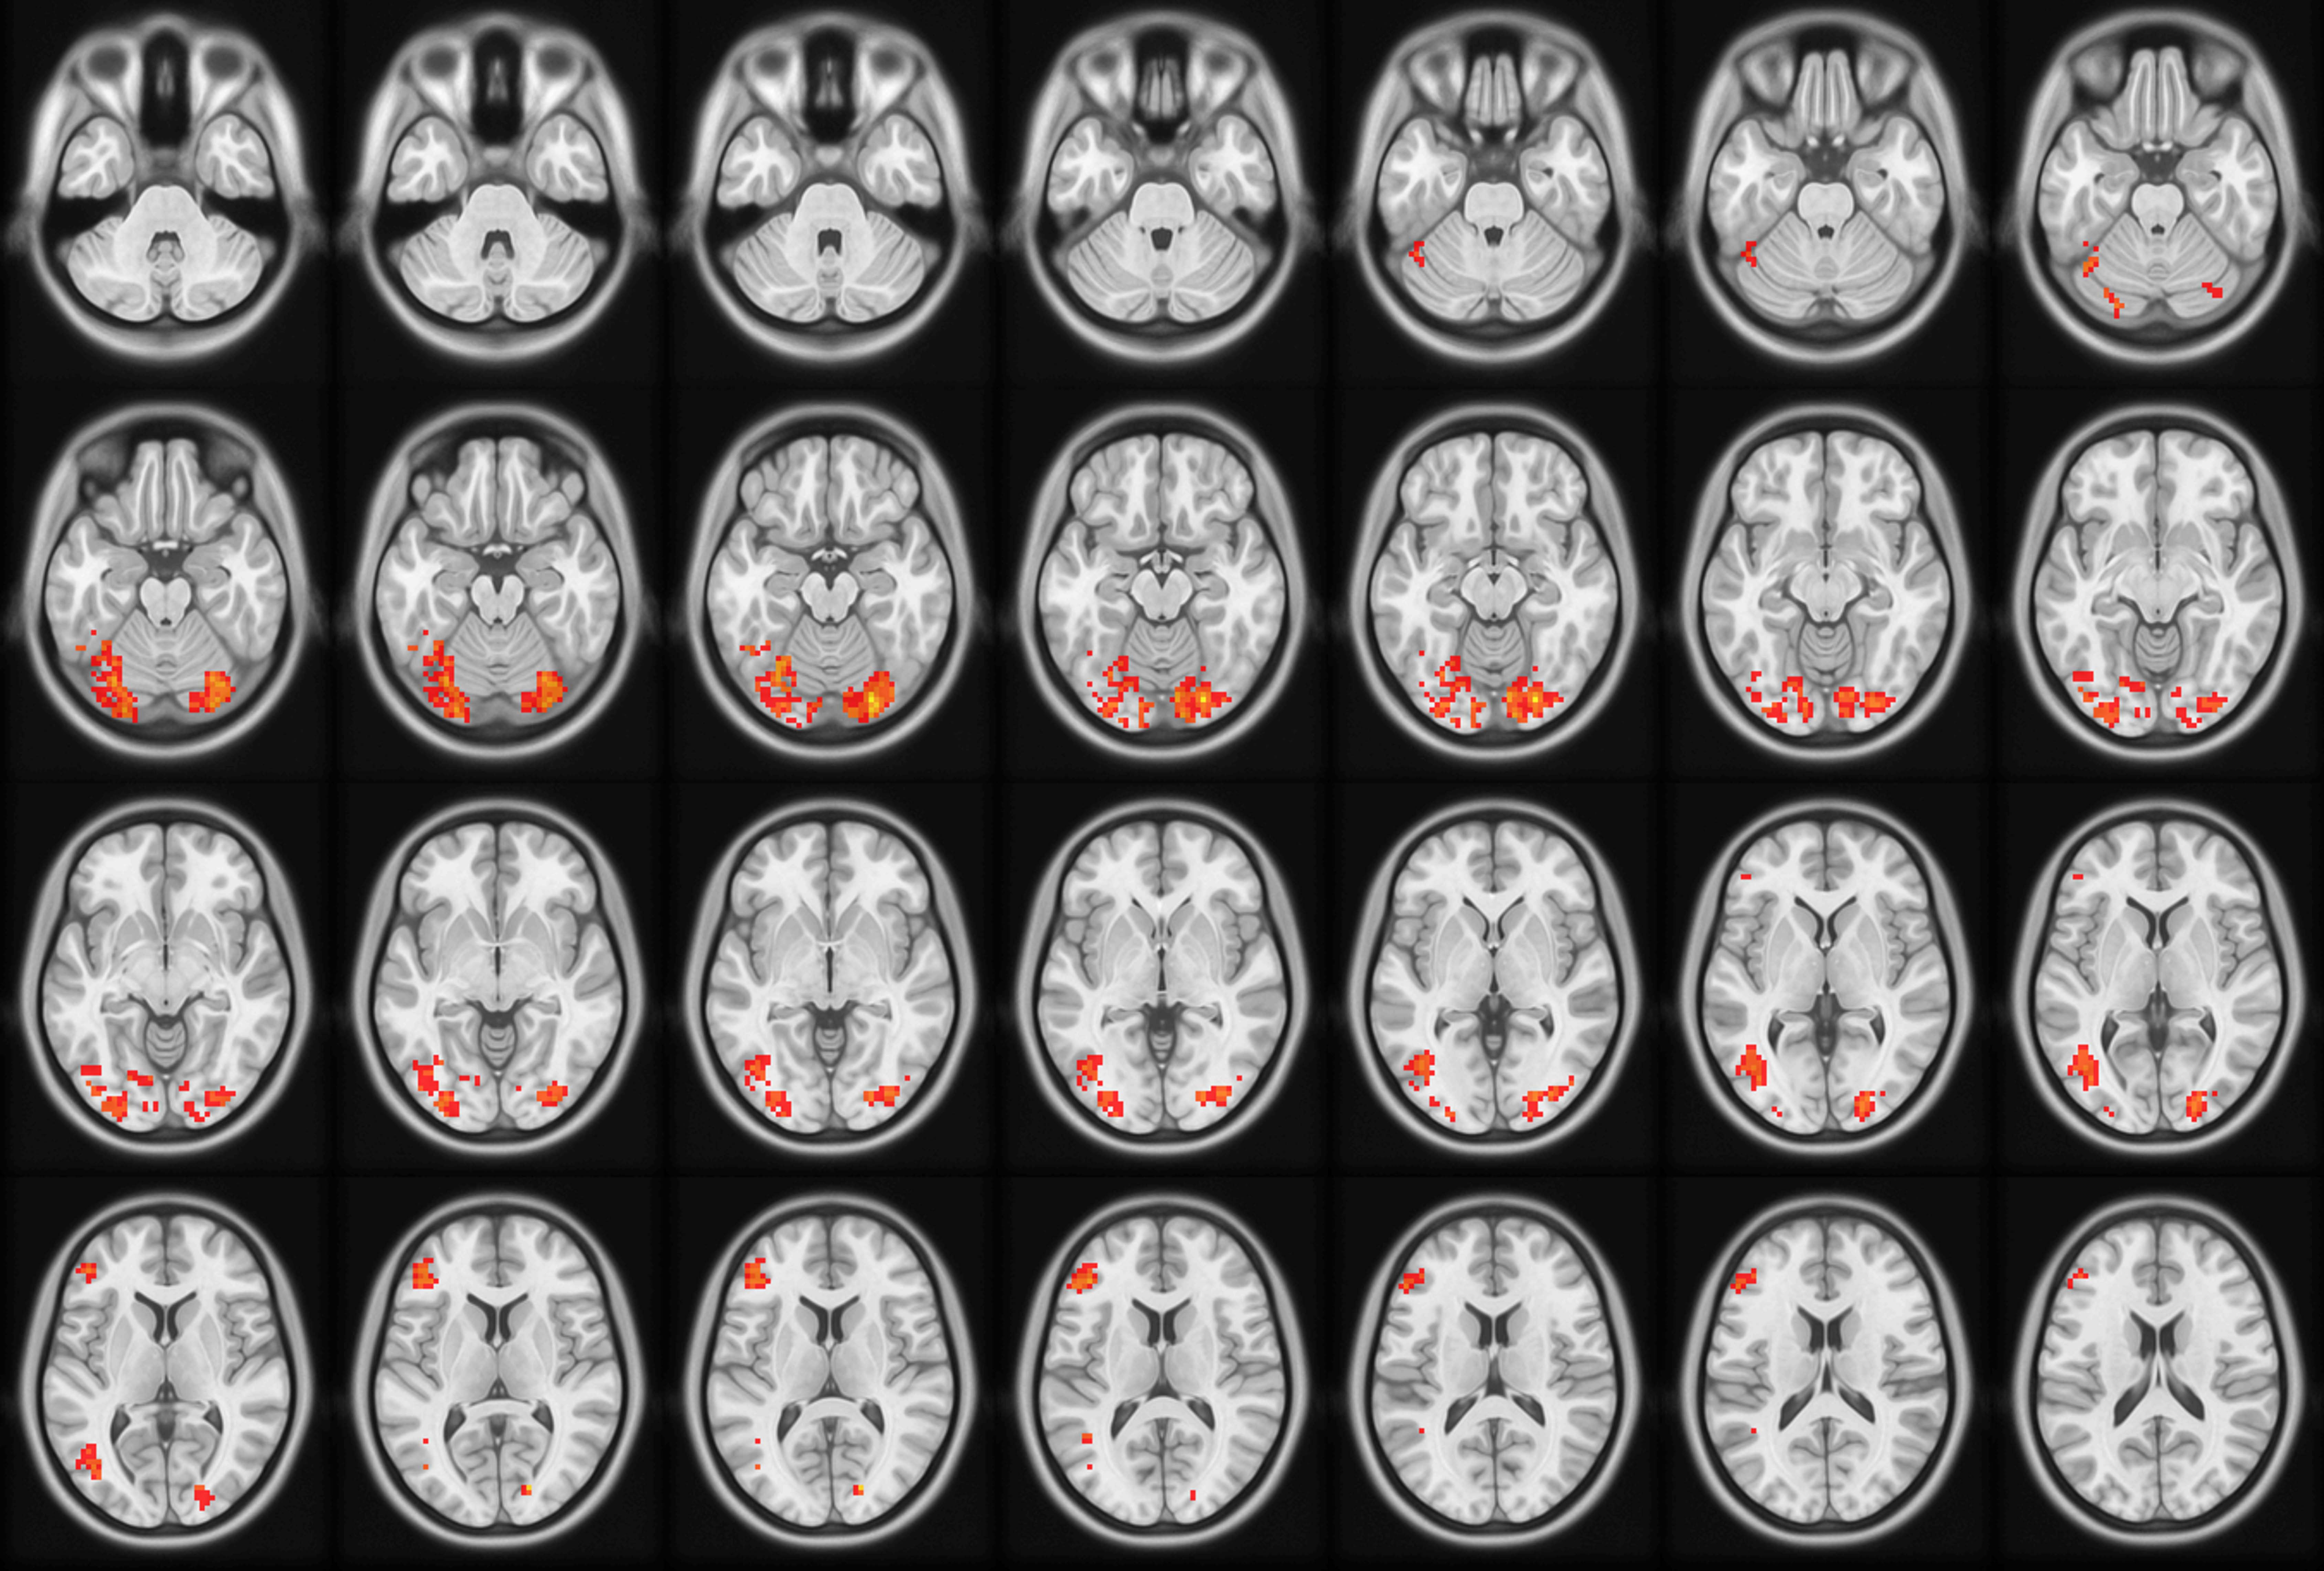
FC differences of two groups: using cluster 1 from VBM as ROI1 to build FC map, there were two clusters with decreased FC values in the T2DM group when compared to the HC group, including the left superior temporal gyrus, middle temporal gyrus, and right middle temporal gyrus, inferior occipital gyrus and fusiform gyrus(Table 2 and Figure 1). using cluster 2 from VBM as ROI2 to build FC map, there were three clusters with decreased FC values in the T2DM group (Table 2 and Figure 2).
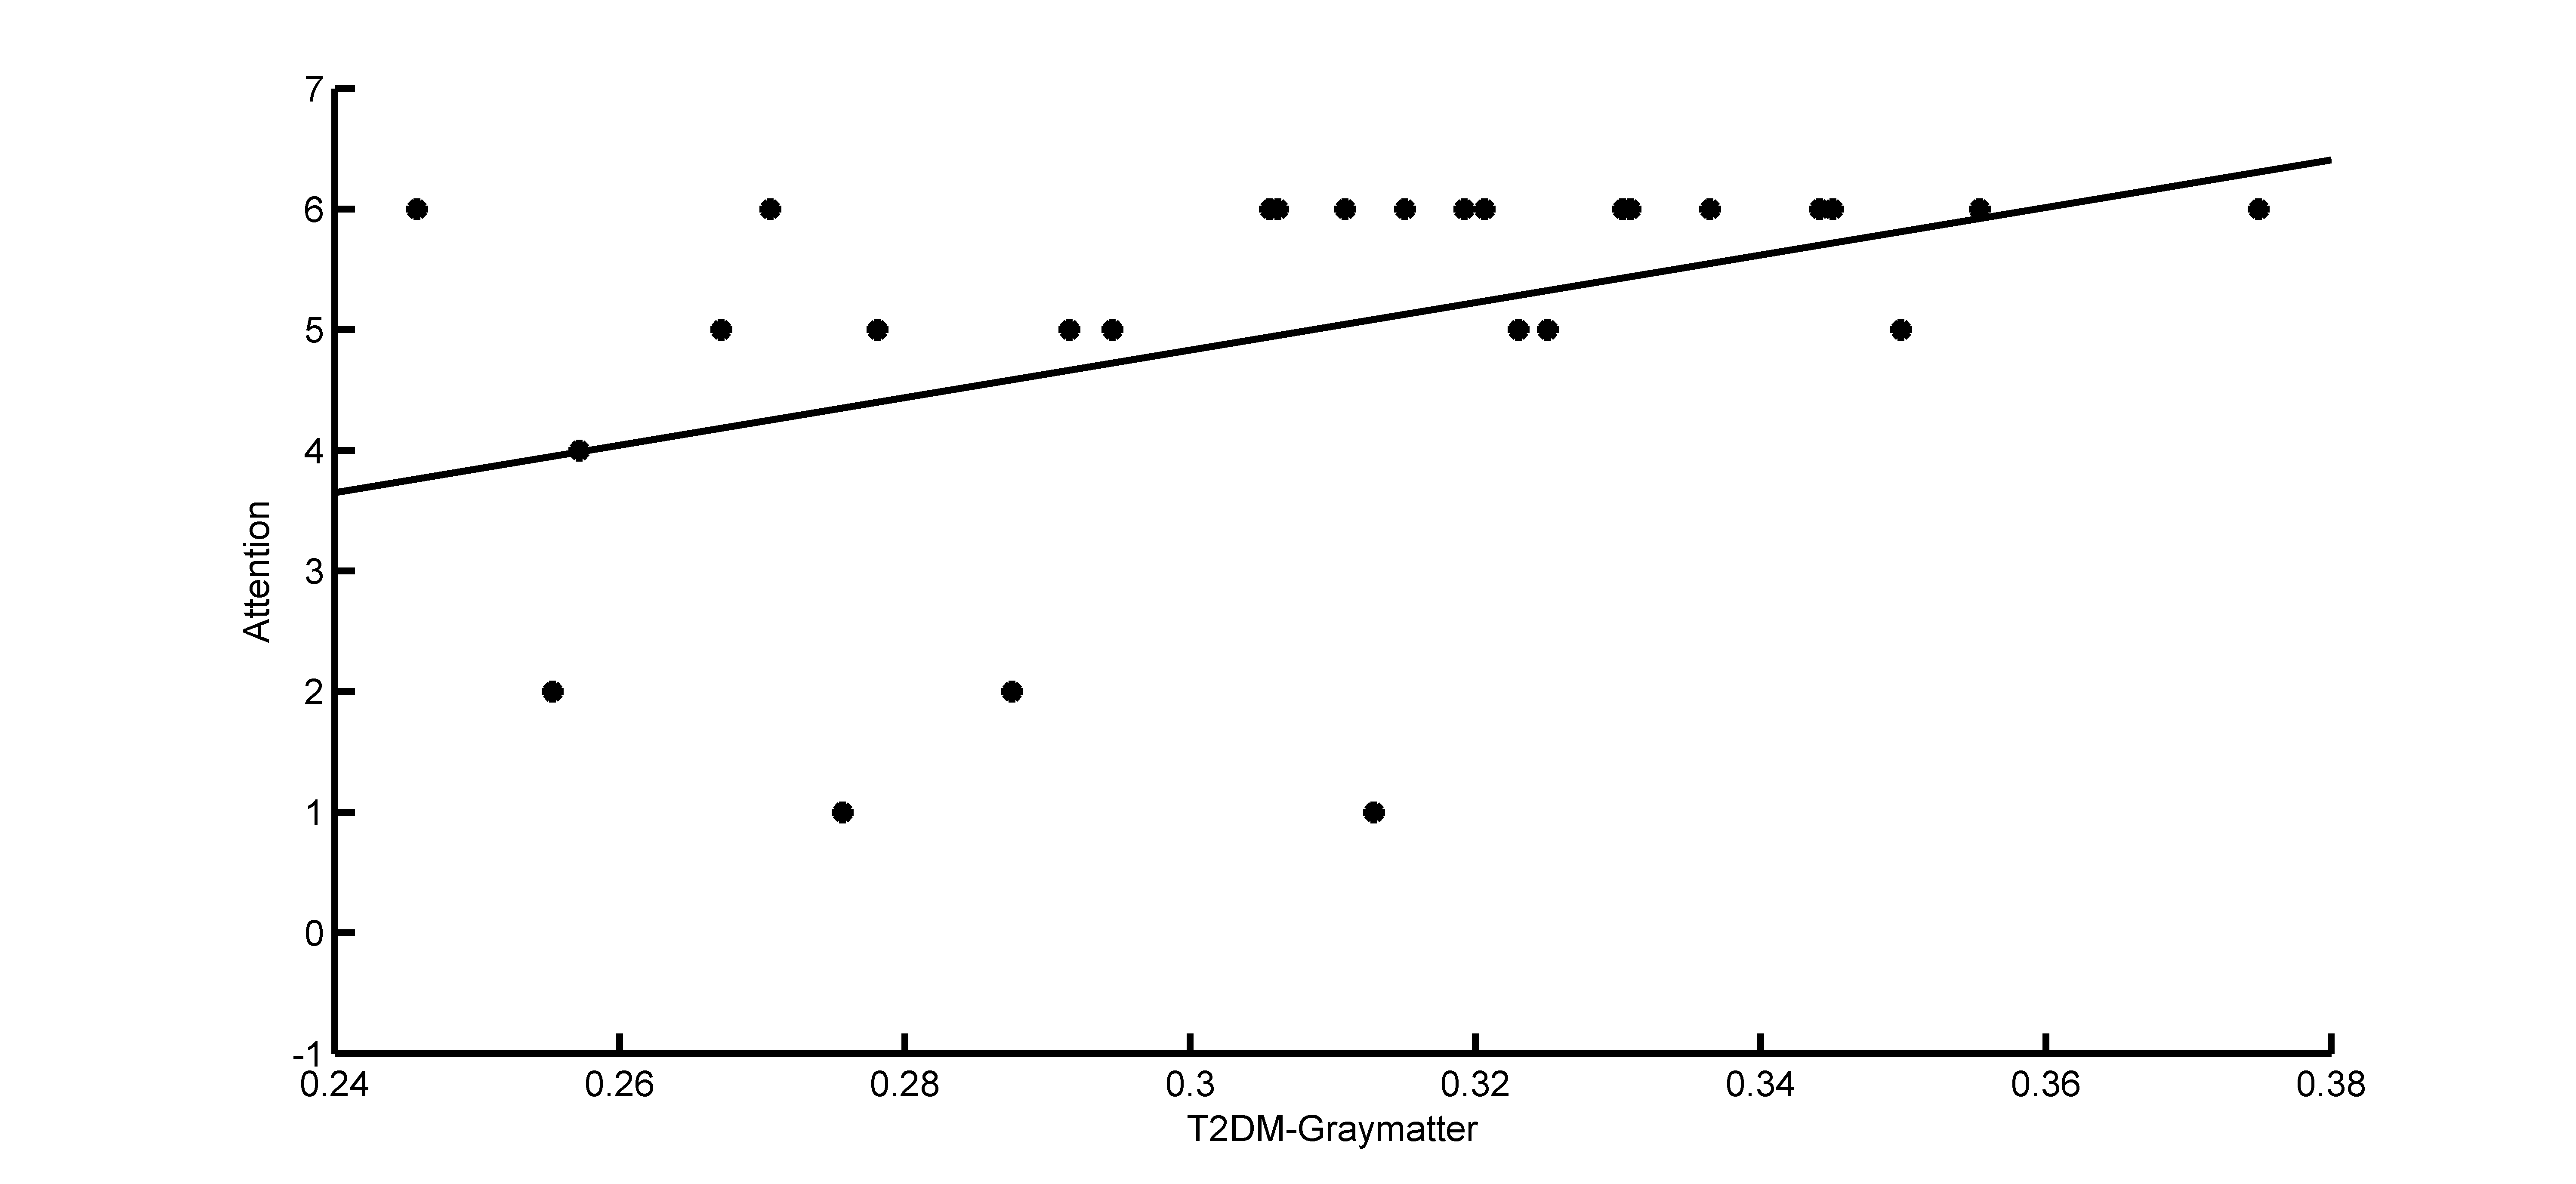
Correlation analysis results: There was a positive correlation between the attention levels and the decreased gray matter in T2DM from VBM results cluster 2(r = 0.49, P = 0.01) (Fig. 3). On the other hand, there was a negative correlation between the duration levels and the FC values in the cluster 3 from ROI2 analysis in T2DM patients compared with HC.
Discussion and conclusion
In this study, we used VBM and rs-fMRI to elucidate the neuropathogenesis in patients with T2DM. Firstly, the VBM analysis revealed lower GMV primarily in the postcentral and precentral gyrus, as well as superior frontal gyrus, which was associated with attention levels, which underlies cognitive dysfunction. Additionally, decreased FC values were observed in the Inferior frontal gyrus, furthermore, the reduced connectivity was negatively correlated with the duration time, indicating longer exposure to diabetes may injure the brain function. Notably, our study found the abnormalities in brain volume while extended the findings to brain functional connectivity. Our comprehensive research will add to our understanding of the mechanisms that may contribute to the damage present in type 2 diabetes.Acknowledgements
No acknowledgement found.References
1. Srikanth V, Sinclair AJ, Hill-Briggs F, et al. Type 2 diabetes and cognitive dysfunction-towards effective management of both comorbidities. Lancet Diabetes Endocrinol. 2020 Jun;8(6):535-545. doi: 10.1016/S2213-8587(20)30118-2.
2. Feng Y, Li Y, Tan X, et al. Altered Gray Matter Volume, Functional Connectivity, and Degree Centrality in Early-Onset Type 2 Diabetes Mellitus. Front Neurol. 2021;12:697349.
3. Chao-Gan Y, Yu-Feng Z. DPARSF: A MATLAB Toolbox for "Pipeline" Data Analysis of Resting-State fMRI. Front Syst Neurosci. 2010 May 14;4:13. doi: 10.3389/fnsys.2010.00013.
Figures