2855
Aberrant brain gray matter and functional networks topology in end stage renal disease patients with cognitive impairment1Department of Radiology, The Affiliated Changzhou NO.2 People’s Hospital of Nanjing Medical University, changzhou, China, 2GE Healthcare, MR Research China, Beijing, China
Synopsis
Keywords: Brain Connectivity, fMRI (resting state)
This study aimed to characterize the topological properties of gray matter (GM) and functional networks in end-stage renal disease (ESRD) patients undergoing maintenance hemodialysis to provide insights into the underlying mechanisms of cognitive impairment. Functional and GM networks were constructed based on resting-state functional magnetic resonance imaging (rs-fMRI) and diffusion kurtosis imaging (DKI), respectively. Disrupted topological organizations were observed, as indicated by significantly altered global measures, nodal efficiency, and degree centrality, which may account for the progression of cognitive dysfunction. And implementation of prediction models based on neuroimaging metrics may provide more objective information to promote early diagnosis and intervention.Introduction
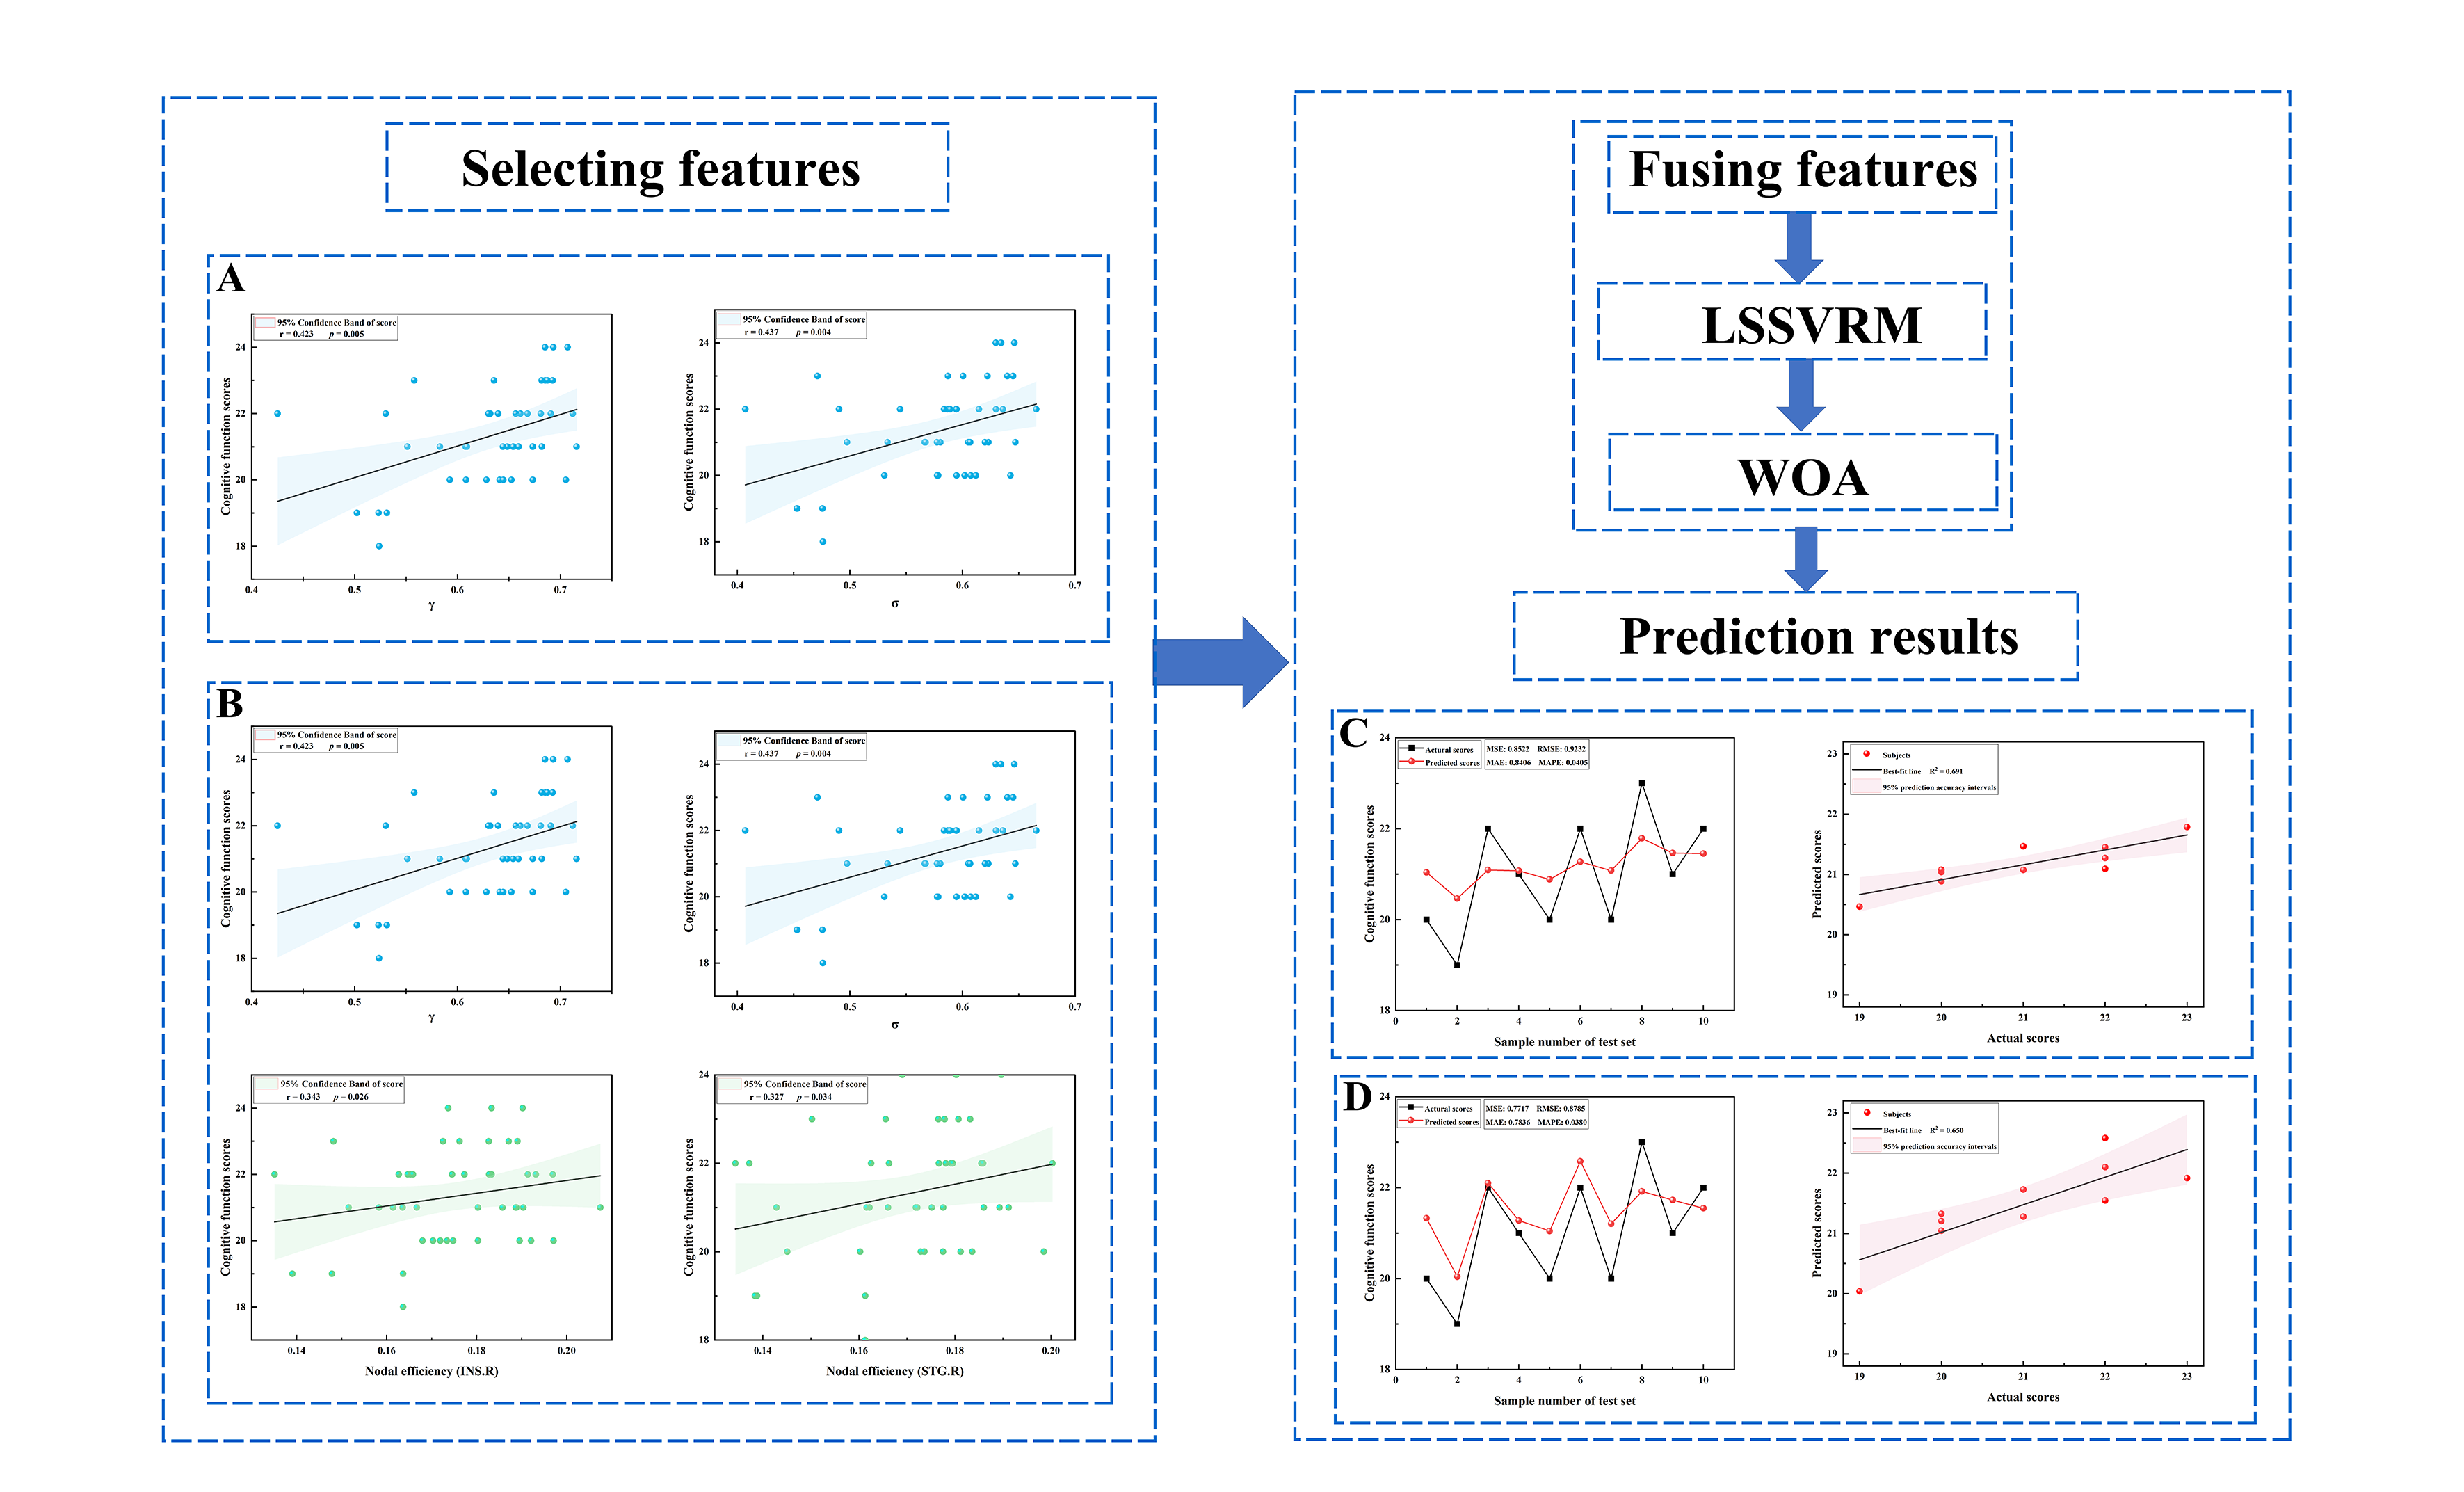
End-stage renal disease (ESRD) patients are at high risk of developing cognitive impairment (CI)1,2. CI in ESRD patients is associated with negative outcomes, including non-adherence to drug treatment and increased rate of suicide3,4. However, the underlying neuropathology of CI remains largely unknown. Therefore, investigating the neuropathological alterations leading to CI would help to understand the potential mechanisms contributing to CI.Complex structural and functional brain networks can provide a physiological basis for information processing among neural elements and mental representation. Currently, graph theory can be used to evaluate the architecture, development, and evolution of brain networks systematically and quantitatively. In this study, we used DKI and rs-fMRI to construct GM functional networks to investigate potential aberrant mechanisms leading to CI in ESRD patients. Further, the least squares support vector regression machine (LSSVRM) was used to build a prediction model, and the whale optimization algorithm (WOA) was used to optimize model parameters. In conclusion, our study attempted to improve the possibility of early diagnosis and neuroprotective treatments for ESRD patients by using predictive models based on neuroimaging techniques.
Materials and Methods
Subjects: Between February 2020 and December 2021, 45 ESRD patients were prospectively recruited into our patient group. In addition, 37 healthy controls without renal disease and other known disorders were enrolled as the control group. Both groups were matched based on age, gender, and education years.MR protocols: Imaging data were acquired using a 3.0T magnetic resonance scanner (Discovery MR750W, General Electric Medical Systems, United States, Milwaukee, WI), equipped with a standard 32-channel head and spine combined coil. High-resolution anatomic T1-weighted images were acquired with three-dimensional brain volume imaging (3D-BRAVO) sequence (152 slices; slice thickness = 1.2 mm (no gap); TR = 8.2 ms; TE = 3.2 ms; FA = 12°; matrix = 256×256; FOV = 240 mm×240 mm). rs-fMRI data were acquired with the gradient-recalled echo-planar imaging (GRE-EPI) sequence (33 slices; 240 time-points; slice thickness = 4 mm; TR= 2000 ms; TE=40 ms; FA = 90°; matrix = 64×64; FOV = 240 mm×240 mm). DKI data were acquired with a single-shot echo-planar imaging (SS-EPI) sequence (30 directions; 3 b values: 0, 1000, 2000 s/mm2, NEX = 2, slice thickness = 3.6 mm (no gap); TR=6500 ms; TE = 95.8 ms; matrix = 128×128; FOV= 240 mm×240 mm).
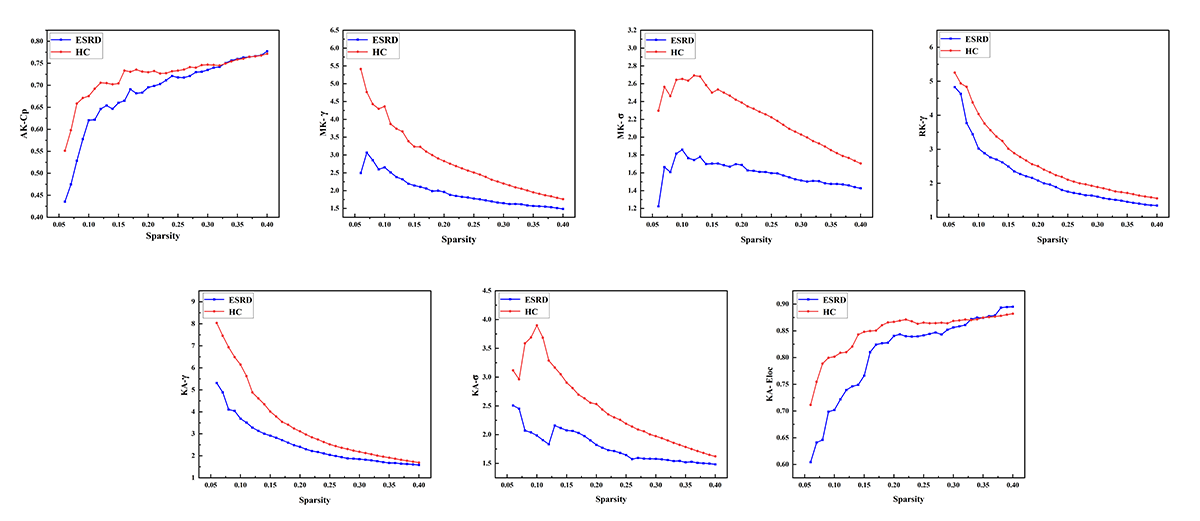
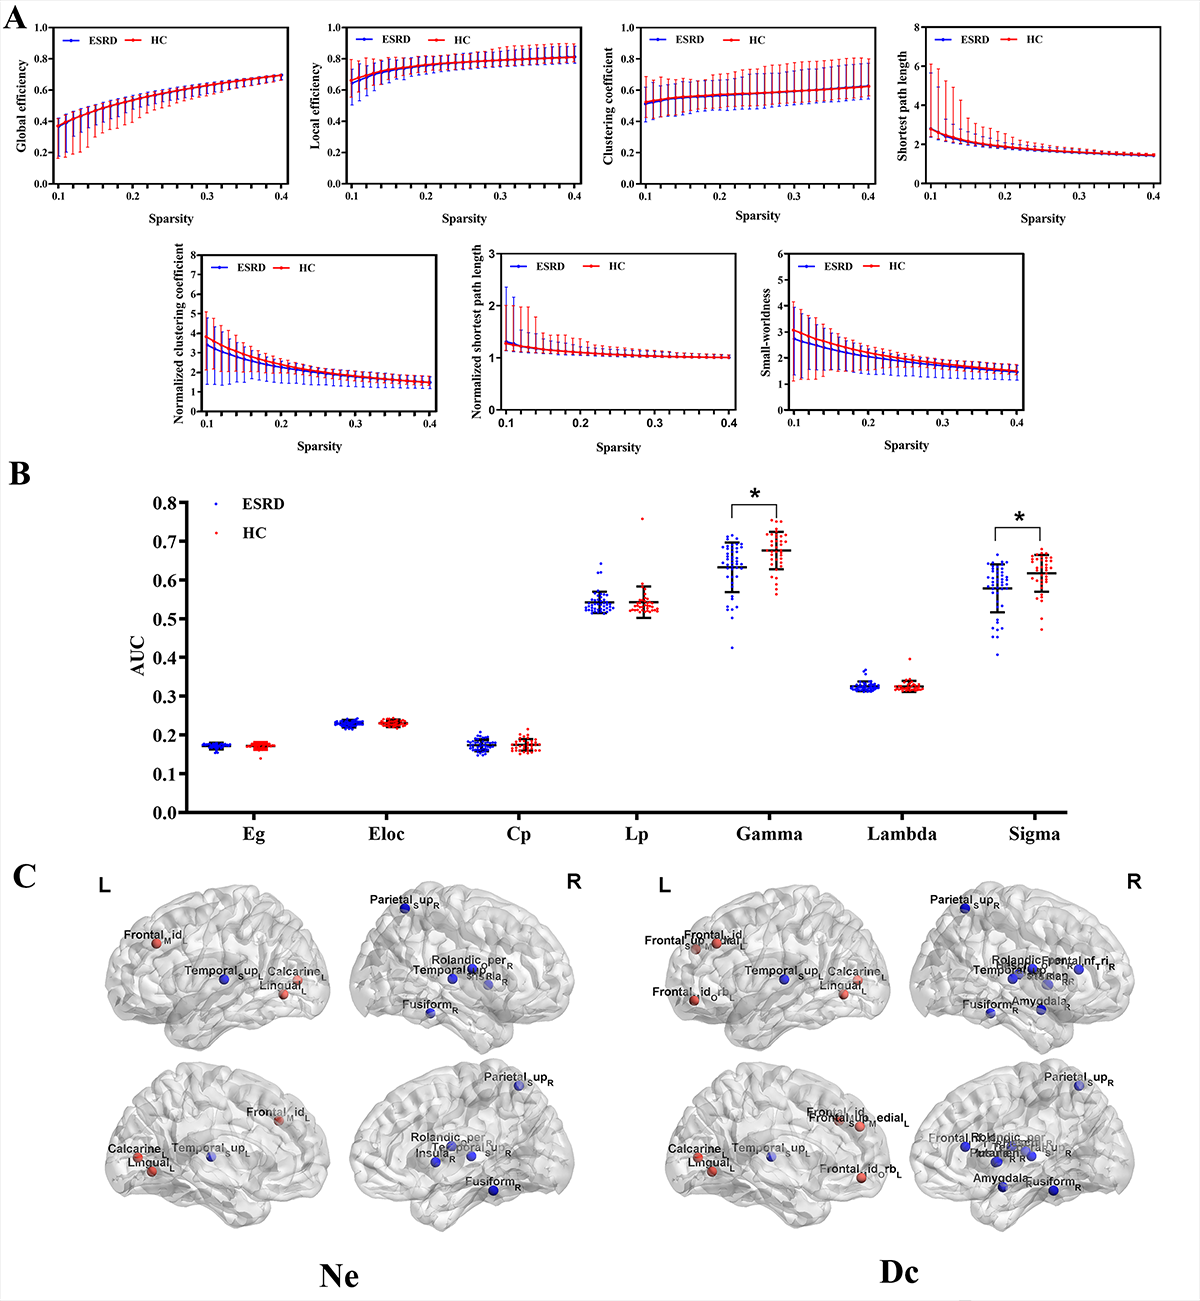
Data analysis: The DKI parameter metrics, including mean kurtosis (MK), axial kurtosis (AK), radial kurtosis (RK), kurtosis anisotropy (KA), were calculated using Diffusion Kurtosis Estimator (DKE) software. Resting-state functional magnetic resonance imaging data preprocessing was performed with the data processing assistant for resting-state fMRI (DPARSF-V2.3). Gray matter networks were constructed at the group level based on each DKI parameter measurement. Functional networks for each participant were constructed using the GRETNA toolbox. Global and nodal measures were calculated. Global measures included global efficiency (Eg), local efficiency (Eloc), mean clustering coefficient (Cp), characteristic path length (Lp), standardized clustering coefficient (γ), standardized characteristic path length (λ), and small-world properties (σ). Nodal measures included nodal efficiency (Ne) and degree centrality (Dc).
A two-sample t-test was performed based on GRETNA to detect differences in network measures between the two groups. Pearson’s correlation analysis was performed based on GRETNA to detect the relationships between significant topological parameters of the functional network and MoCA scores in ESRD patients. Finally, optimized LSSVRM was applied to predict cognitive function based on functional networks.
Results
For GM networks, in ESRD patients, decreased Cp was found in AK network; decreased γ and σ were found in MK network; decreased γ was found in RK network; and decreased γ, σ, and Eloc were found in KA network (Figure 1). For functional networks, decreased γ and σ were observed in ESRD patients. And regions with significantly changed Ne and Dc (9 and 15 regions, respectively) were identified and distributed laterally (Figure 2). Pearson correlation analysis revealed that decreased γ, σ, and Ne of the functional network positively correlated with MoCA scores in ESRD patients. Optimized LSSVRM based on functional networks predicted the cognitive function with great accuracy. When using selected global measures as features, MSE, RMSE, MAE, and MAPE between the actual scores and predicted scores were 0.85, 0.92, 0.84, and 4.05%, respectively, with an R-squared (R2) of 0.69. When both selected global and nodal measures were used as features, the MSE, RMSE, MAE, and MAPE between the actual scores and predicted scores were 0.77, 0.88, 0.78, and 3.80%, respectively, with an R2 value of 0.65 (Figure 3).Discussion and Conclusions
Our study demonstrated that disrupted GM and functional networks in ESRD patients on maintenance hemodialysis contribute to and can be used to predict CI. In contrast to most diffusion MRI studies that focus merely on WM networks, our study paid attention to GM networks. Moreover, related functional network metrics were found to be significant imaging markers capable of predicting cognitive function in ESRD patients.This study highlighted the feasibility and necessity of early diagnosis of CI in ESRD patients from the perspective of quantitative imaging parameters.
Acknowledgements
No acknowledgement found.References
1. Bugnicourt, J., Godefroy, O., Chillon, J., Choukroun, G., and Massy, Z. A. (2013). Cognitive disorders and dementia in CKD: The neglected kidney-brain axis. J. Am. Soc. Nephrol. 24, 353–363. doi: 10.1681/ASN.2012050536
2. Kalantar-Zadeh, K., Jafar, T. H., Nitsch, D., Neuen, B. L., and Perkovic, V. (2021). Chronic kidney disease. Lancet 398, 786–802. doi: 10.1016/S0140-6736(21) 00519-5
3. Agganis, B. T., Weiner, D. E., Giang, L. M., Scott, T., Tighiouart, H., Griffith, J. L., et al. (2010). Depression and cognitive function in maintenance hemodialysis patients. Am. J. Kidney Dis. 56, 704–712. doi: 10.1053/j.ajkd.2010.04.018
4. Natale, P., Palmer, S. C., Ruospo, M., Saglimbene, V. M., Rabindranath, K. S., and Strippoli, G. F. (2019). Psychosocial interventions for preventing and treating depression in dialysis patients.
Figures