2854
Altered functional hubs and connectivity in type 2 diabetes mellitus with and without mild cognitive impairment1Shaanxi Provincial People’s Hospital, Xi’an, China, 2Philips Healthcare, Xi’an, China
Synopsis
Keywords: Brain Connectivity, fMRI (resting state)
To investigate the functional abnormalities of brain networks and hub nodes damaged in T2DM patients with mild cognitive impairment (DMCI). We applied degree centrality (DC) and seed-based functional connectivity (FC) analysis to identify the abnormal hub nodes and the FC patterns of these hubs in DMCI patients. Our results indicated that DMCI patients showed extensive alterations in the visual and memory pathways, and these alterations were correlated with clinical/cognitive variables. These results suggested that vision and memory-related brain regions dysfunctions may be involved in the neuropathology of visuospatial and memory function impairment in DMCI patients.Introduction
Long-term hyperglycemia can lead to various cognitive dysfunctions involving attention, memory, and visual space in T2DM patients [1, 2]. Brain network dysfunction and abnormal neuronal activity are the basis of cognitive impairment, especially damage of hub nodes in brain networks [3]. Degree centrality (DC) is a powerful measure that reflects abnormalities in the most connected hub nodes in functional networks [4]. We used both DC analysis and seed-based FC analysis to explore the relationships among hub nodes and related network dysfunction and cognitive impairment in T2DM patients. The cognitive dysfunction associated with different stages of diabetes mellitus has different characteristics, and cognitive impairment caused by hyperglycemia may involve a complex process [5]. Therefore, we speculated that the patterns of abnormality are not exactly the same in T2DM patients with different cognitive states, but abnormalities of brain hub nodes and functional connections may be more extensive in DMCI patients. Furthermore, these abnormally altered hub nodes and functional connections may correlate with clinical/cognitive variables.Methods
Sixty-five T2DM patients and 34 healthy controls (HCs) underwent neuropsychological assessment. Then, degree centrality (DC) analysis and seed-based functional connectivity (FC) analysis were performed to identify the abnormal hub nodes and the FC patterns of these hubs in T2DM patients with mild cognitive impairment (DMCI group, N = 31) and without MCI (DMCN group, N = 34). Correlation analyses examined the relationship between abnormal DC and FC and clinical/cognitive variables.Results
Compared with HCs, both T2DM groups showed decreased DC values in the visual cortex, and the T2DM patients with MCI (DMCI) showed more extensive alterations in the right parahippocampal gyrus (PHG), posterior cingulate cortex (PCC), and left superior frontal gyrus (SFG) regions than T2DM patients with normal cognitive function. Seed-based FC analysis of PHG and PCC nodes showed that functional disconnection mainly occurred in visual and memory pathways in DMCI patientsDiscussion
In our study, we combined DC analysis and voxel-wise FC analysis to explore abnormal hub nodes and the FC patterns of these hubs in T2DM patients under different cognitive states. Our result found decreased DC values in the visual cortex of both T2DM groups, and the DMCI group showed more extensive alterations of brain hub regions in the right PHG, bilateral PCC, and left SFG regions than the DMCN group. Some studies have indicated that visual function impairment exists in the early stage of T2DM patients [6] and long-term hyperglycemia is the main factor leading to visual cognitive impairment [7]. The brain regions of PHG, PCC are the core nodes in declarative memory [8] and default mode network [9]. Chronic hyperglycemia can affect hub nodes and disrupt the topological integration of the brain [10], which may be the reason for the decreased DC values of these nodes in the DMCI group compared with the DMCN group. The results of this study suggest that patients with DMCI have more abnormal higher cognitive function brain regions. Furthermore, the seed-based FC analysis further demonstrated impaired functional connectivity of brain pathways related to visuospatial and memory in DMCI patients.Conclusions
This study found that the brain area of hub nodes and functional dysfunction in DMCI patients were mainly located in vision and memory-related brain regions. Visual-related regions dysfunctions and disconnection may be involved in the neuropathology of visuospatial function impairment in DMCI patients. This study provides valuable insights into the neurological underpinnings of T2DM-related cognitive impairment.Acknowledgements
This research was supported by the National Natural Science Foundation of China (82170820).
References
1. Sadanand, S., R. Balachandar, and S. Bharath, Memory and executive functions in persons with type 2 diabetes: a meta-analysis. Diabetes Metab Res Rev, 2016. 32(2): p. 132-42.
2. Zhou, Y., et al., Clinical Characteristics for the Relationship between Type-2 Diabetes Mellitus and Cognitive Impairment: A Cross-Sectional Study. Aging Dis, 2015. 6(4): p. 236-44.
3. Dai, Z. and Y. He, Disrupted structural and functional brain connectomes in mild cognitive impairment and Alzheimer's disease. Neurosci Bull, 2014. 30(2): p. 217-32.
4. Buckner, R.L., et al., Cortical hubs revealed by intrinsic functional connectivity: mapping, assessment of stability, and relation to Alzheimer's disease. J Neurosci, 2009. 29(6): p. 1860-73.
5. Kumar, R., J.C. Looi, and B. Raphael, Type 2 diabetes mellitus, cognition and brain in aging: A brief review. Indian J Psychiatry, 2009. 51 Suppl 1: p. S35-8.
6. Li, W., et al., Prevalence, Influence Factors and Cognitive Characteristics of Mild Cognitive Impairment in Type 2 Diabetes Mellitus. Front Aging Neurosci, 2019. 11: p. 180.
7. Gao, Y., et al., The characteristic of cognitive function in Type 2 diabetes mellitus. Diabetes Res Clin Pract, 2015. 109(2): p. 299-305.
8. Squire, L.R. and A.J. Dede, Conscious and unconscious memory systems. Cold Spring Harb Perspect Biol, 2015. 7(3): p. a021667.
9. Danielson, N.B., J.N. Guo, and H. Blumenfeld, The default mode network and altered consciousness in epilepsy. Behav Neurol, 2011. 24(1): p. 55-65.
10. Kim, D.J., et al., Hyperglycemia Reduces Efficiency of Brain Networks in Subjects with Type 2 Diabetes. PLoS One, 2016. 11(6): p. e0157268.
Figures
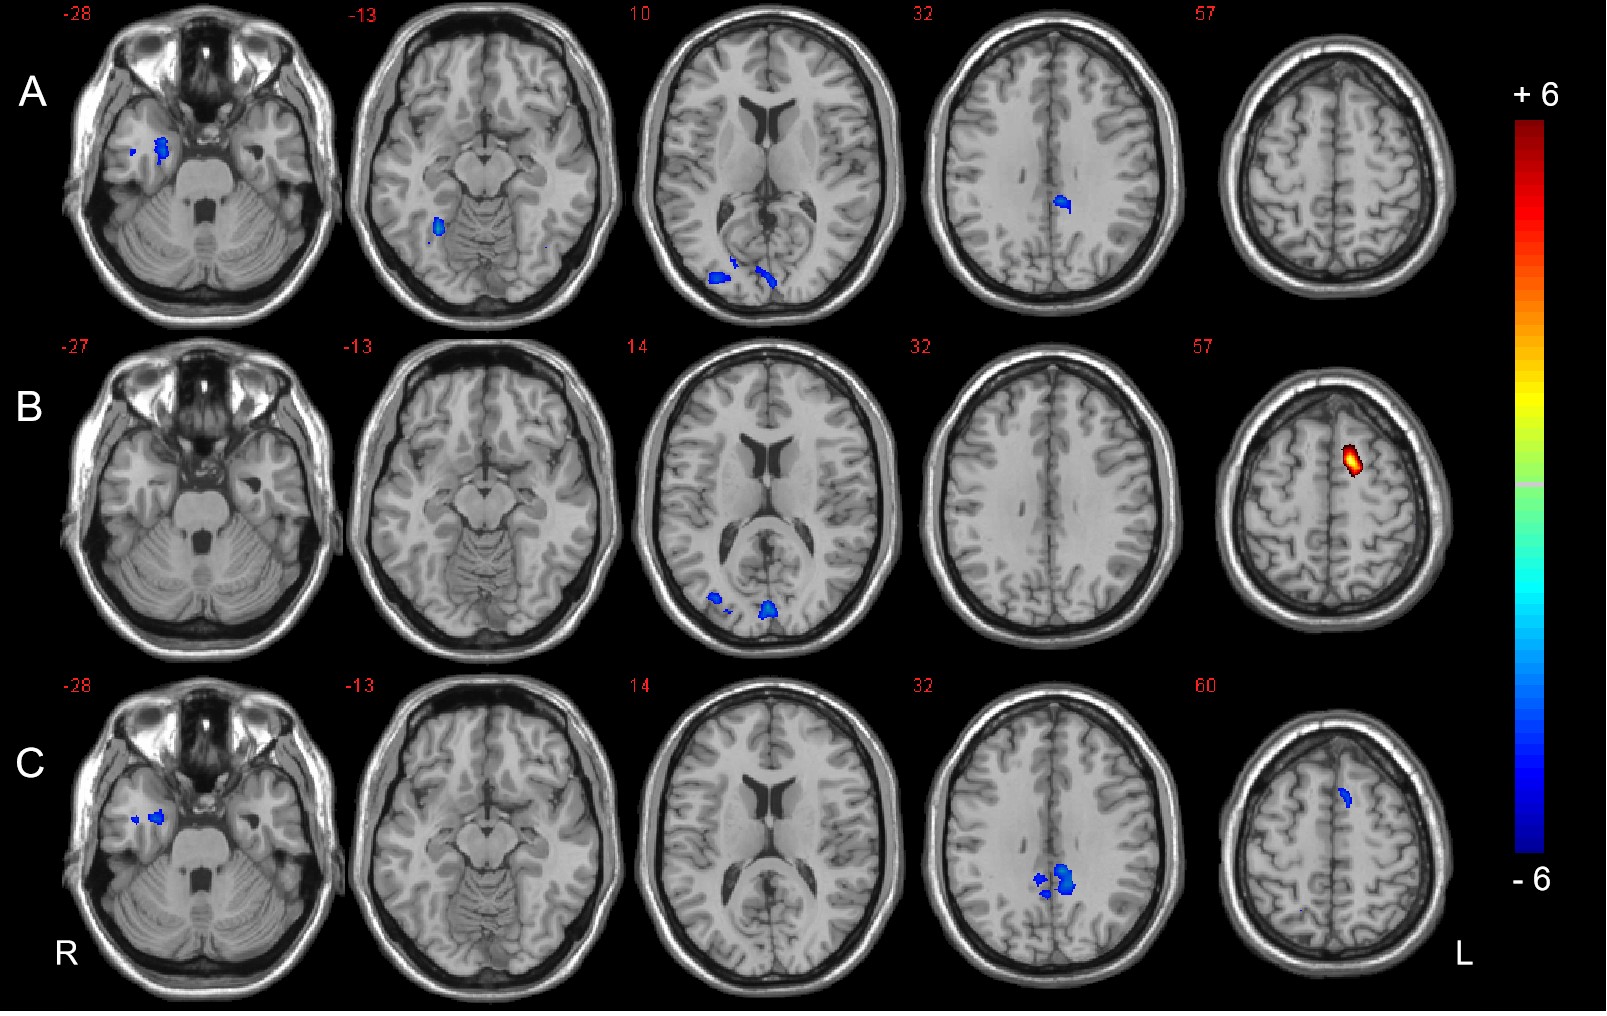
Figure 1: DC analysis of the three groups. A: Significant difference in DC between the DMCI and HC groups. B: Significant difference in DC between the DMCN and HC groups. C: Significant difference in DC between the DMCI and DMCN groups (P < 0.05, FDR corrected). Warm (cold) color indicates significantly increased (decreased) DC.
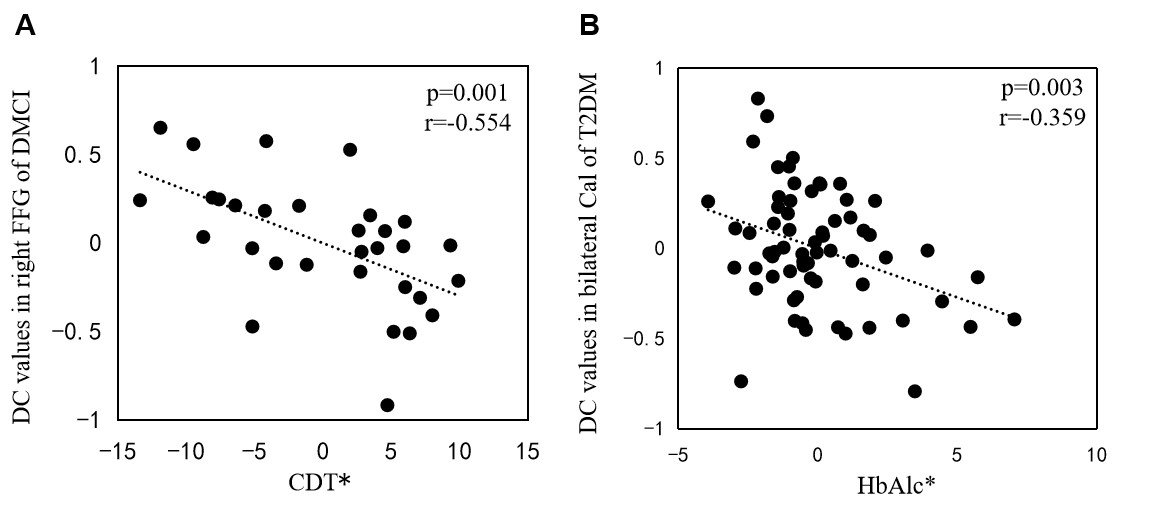
Figure 2: Correlations between DC values and clinical/cognitive variables. A: Correlation between DC values in the right FFG and CDT scores in DMCI patients (r = -0.554, P = 0.001); B: Correlation between DC values in the bilateral Cal and HbA1c scores of all T2DM patients (r = -0.359, P = 0.003). The asterisk (*) indicates coordinate values, controlling for the effects of gender, age, and years of education.
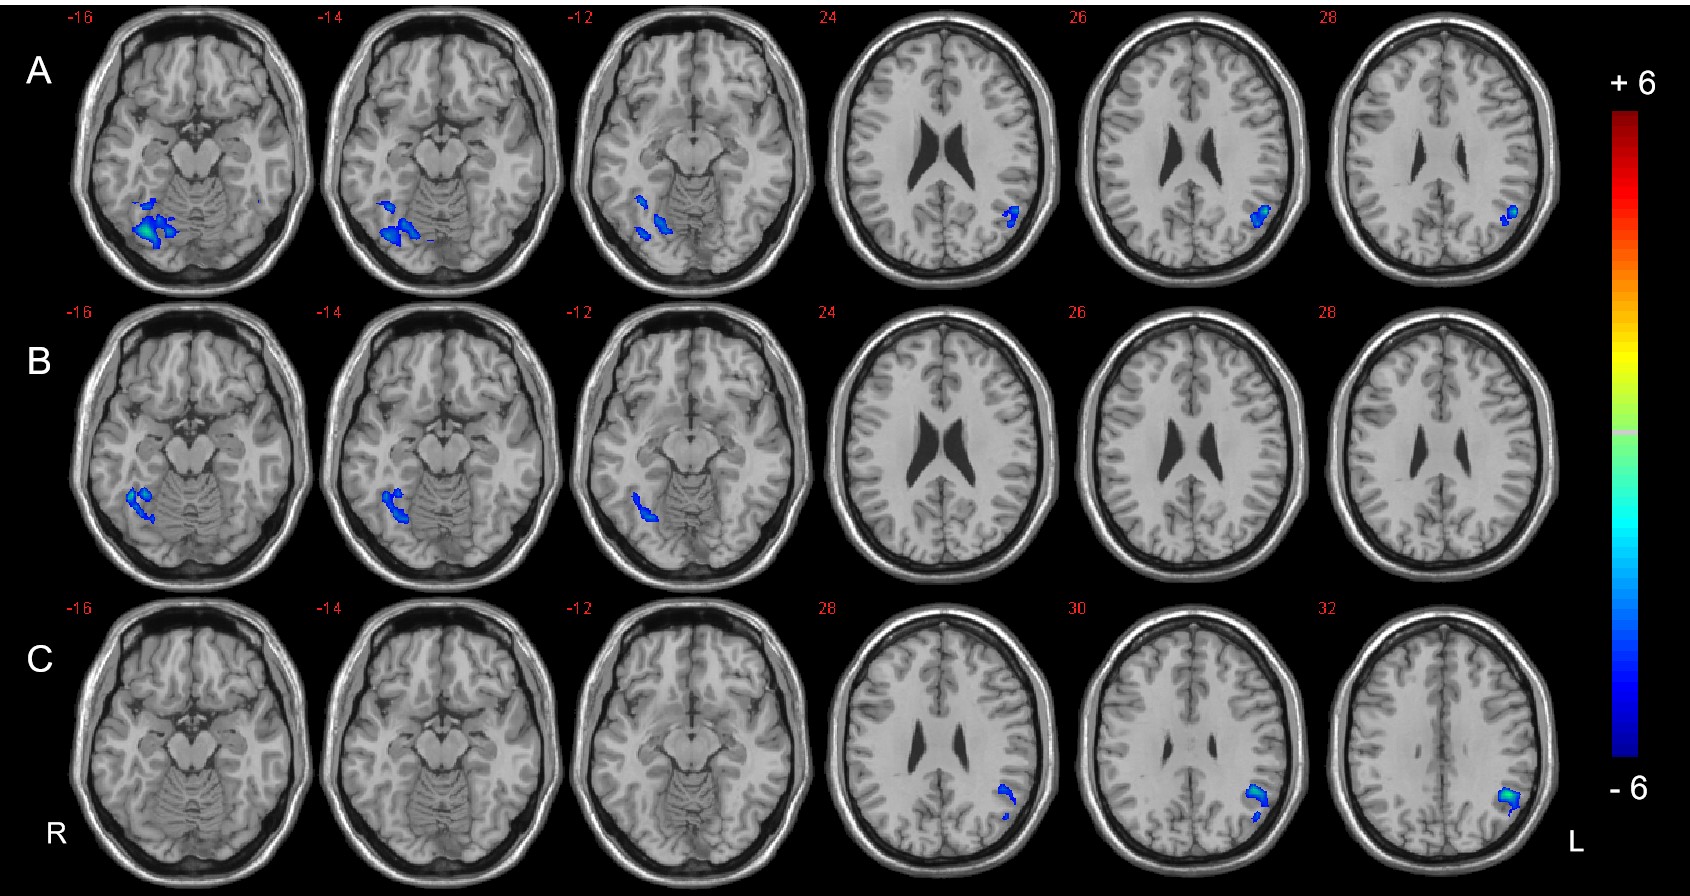
Figure 3: Seed-based FC analysis in the right PHG of the three groups, A: Significant difference in FC between the DMCI and HC groups. B: Significant difference in FC between the DMCN and HC groups. C: Significant difference in FC between the DMCI and DMCN groups (P < 0.05, FDR corrected). Warm (cold) color indicates significantly increased (decreased) FC.
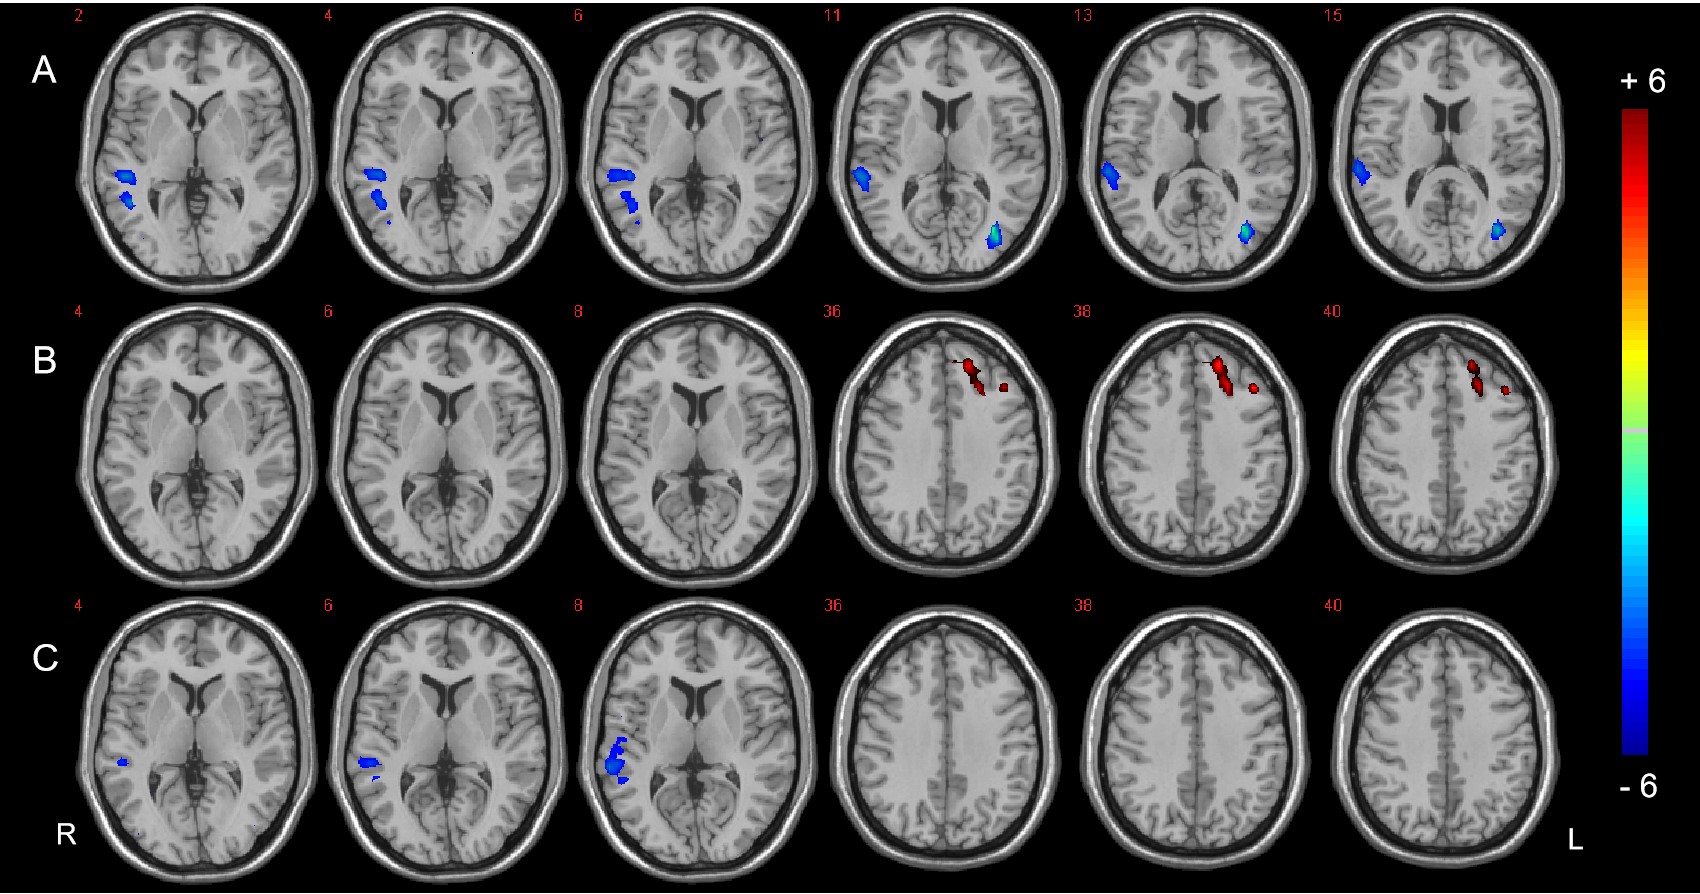
Figure 4: Seed-based FC analysis in the bilateral PCC of the three groups. A: Significant difference in FC between the DMCI and HC groups. B: Significant difference in FC between the DMCN and HC groups. C: Significant difference in FC between the DMCI and DMCN groups (P < 0.05, FDR corrected). Warm (cold) color indicates significantly increased (decreased) FC.