2853
Altered dynamic effective connectivity of the default mode network in T2DM
xu kun1, wang jun2, and zhang jing3
1medical, lanzhou unversity, lanzhou, China, 2lanzhou university, lanzhou, China, 3lanzhou university second hospital, lanzhou, China
1medical, lanzhou unversity, lanzhou, China, 2lanzhou university, lanzhou, China, 3lanzhou university second hospital, lanzhou, China
Synopsis
Keywords: Brain Connectivity, Brain Connectivity
Type 2 diabetes (T2DM) as one of the risk factors for developing Alzheimer's, however, the underlying pathogenesis of cognitive impairment in patients with T2DM was still unknown. our study combined the method of sliding-window approach and Granger causality analysis and found decreased dynamic effective connectivity (DEC) in T2DM compared with healthy people, and the decrease was associated with abnormal blood glucose level.synopsis
Type 2 diabetes (T2DM) as one of the risk factors for developing Alzheimer's, however, the underlying pathogenesis of cognitive impairment in patients with T2DM was still unknown. our study combined the method of sliding-window approach and Granger causality analysis and found decreased dynamic effective connectivity (DEC) in T2DM compared with healthy people, and the decrease was associated with abnormal blood glucose level.Introduction
Altered functional connectivity of resting-state fMRI(rs-fMRI)among the default mode network (DMN) nodal regions has been certificated to be associated with cognitive decline in patients with T2DM[1,2], but the underlying mechanism was still unknown. We therefore applied Granger causality analysis (GCA)[3] to study the DEC of DMN in patients with T2DM.Methods
We recruited 36 patients with T2DM and 40 matched healthy controls (HC). Rs-fMRI data were preprocessed using fMRIPrep. The process consists of the following steps: remover of the first 10 time points, realignment, time-slicing, head motion correction, registration and smoothing with the Gaussian kernel of 6 mm full width at half maximum. After preprocessing, the principal component analysis (PCA) compressed all subject-specific rs-fMRI data into 150 principal components and then connected the compressed data across time and decomposed into 100 independent components (ICs) using the infomax algorithm which repeated 100 times in ICASSO to ensure the reliability and stability, finally, reconstructing backward singer subject-specific spatial maps and corresponding time courses. All of the procedures above were completed by Spatial-temporal Regression on the GIFT software. Based on previous literatures[4], twelve ICs have been selected as regions of interest (ROI) of DMN. Next, we used the GCA module to explore DEC between DMN regions in DynamicBC software. First, the time courses were segmented by sliding windows approach to get the 76 causal influence matrices. Second, a k-means clustering method was performed on the windowed EC matrices to classify different clusters (corresponding different states) based on the similarity between matrices and cluster centroids and measured the DEC parameters (fractional windows (F), mean dwell time (MDT), number of transition (NT)). Third, we measured the difference of DEC between patients with T2DM and HC in state1 and state2 using two-sample t-test by using NBS. Spearman’s correlation analyses were applied to investigate the relationships between altered DEC parameters and clinical features. Statistical analyses were performed using SPSS 22 and results were corrected for multiple comparisons using false discovery rate (FDR; P < 0.05).Results
According to the result of clustering by K-means, we defined two distinct states that characterize the DEC patterns (i.e., a more frequent, weakly connected state (State1) and a less frequent, strongly connected state (State2). Patients with T2DM showed altered ECs within DMN subnetworks in the State1, finding that the ECs between medial prefrontal cortex (mPFC) and medial cingulate cortex (MCC), mPFC and left inferior parietal lobule(IPL_L) have decreased (t=2.7,p=0.037). In addition, fasting blood glucose (FBG), postprandial blood glucose(PBG), glycosylated hemoglobin (HbA1c) positively correlated with fractional windows of state1 (FBG: r² = 0.05141,p = 0.02739;PBG: r² = 0.05546,p = 0.02284;HbA1c: r² = 0.04625,p = 0.03455) .Discussion
Previous studies have confirmed that patients with T2DM had altered EC of resting state between hippocampus and the DMN, occipital cortex and cerebellum compared with HC[5], but there were no studies that explore DEC within DMN regions. Our study found Patients with T2DM shows altered ECs within DMN subnetworks in the State1 through combining the method of sliding-window approach and Granger causality analysis. In addition, this finding is accompanied with damaged blood glucose, which may help us further exploring the pathogenesis of cognitive impairment in patients with type 2 diabetes.Conclusion
Patients with T2DM exist altered DEC between DMN regions, and the alteration is associated with blood glucose abnormalities, which means blood glucose control may help patients with T2DM slowing down the procedure of cognitive impairment.Acknowledgements
we are grateful to all the participants for their cooperation and patience.References
[1] Zhou H, Lu W, Shi Y, et al. Impairments in cognition and resting-state connectivity of the hippocampus in elderly subjects with type 2 diabetes[J]. Neuroscience letters, 2010, 473(1): 5-10. [2] Chen Y C, Jiao Y, Cui Y, et al. Aberrant brain functional connectivity related to insulin resistance in type 2 diabetes: a resting-state fMRI study[J]. Diabetes Care, 2014, 37(6): 1689-96. [3] Liao W, Fan Y S, Yang S, et al. Preservation Effect: Cigarette Smoking Acts on the Dynamic of Influences Among Unifying Neuropsychiatric Triple Networks in Schizophrenia[J]. Schizophr Bull, 2019, 45(6): 1242-1250. [4] Zhang Z, Liu G, Zheng W, et al. Altered dynamic effective connectivity of the default mode network in newly diagnosed drug-naive juvenile myoclonic epilepsy[J]. Neuroimage Clin, 2020, 28: 102431. [5] Liu T, Bai Y, Ma L, et al. Altered Effective Connectivity of Bilateral Hippocampus in Type 2 Diabetes Mellitus[J]. Front Neurosci, 2020, 14: 657.Figures
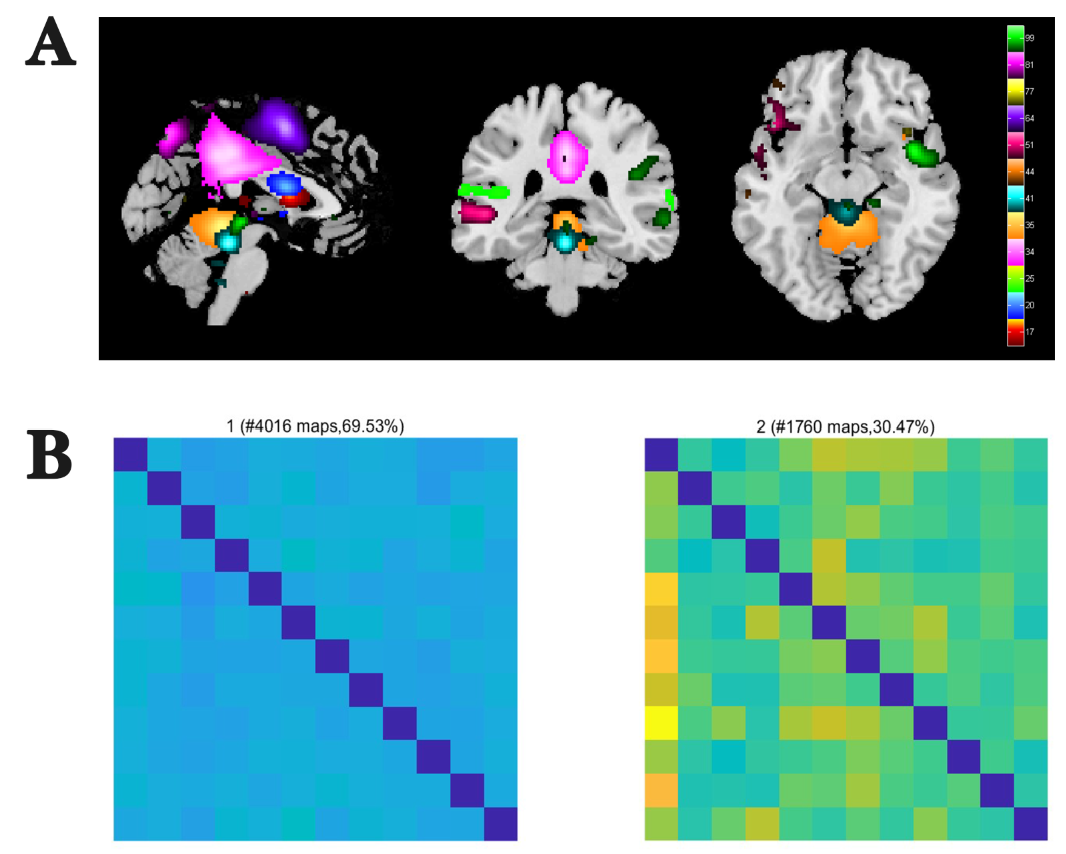
A. The anatomical distribution of 12 ICs, 12 independent
components (ICs) were defined as default mode components according to their
spatial activation maps. B. Centroid matrices for two states. The total number
of occurrences and the percentage of total occurrences are listed above each
centroid matrix.
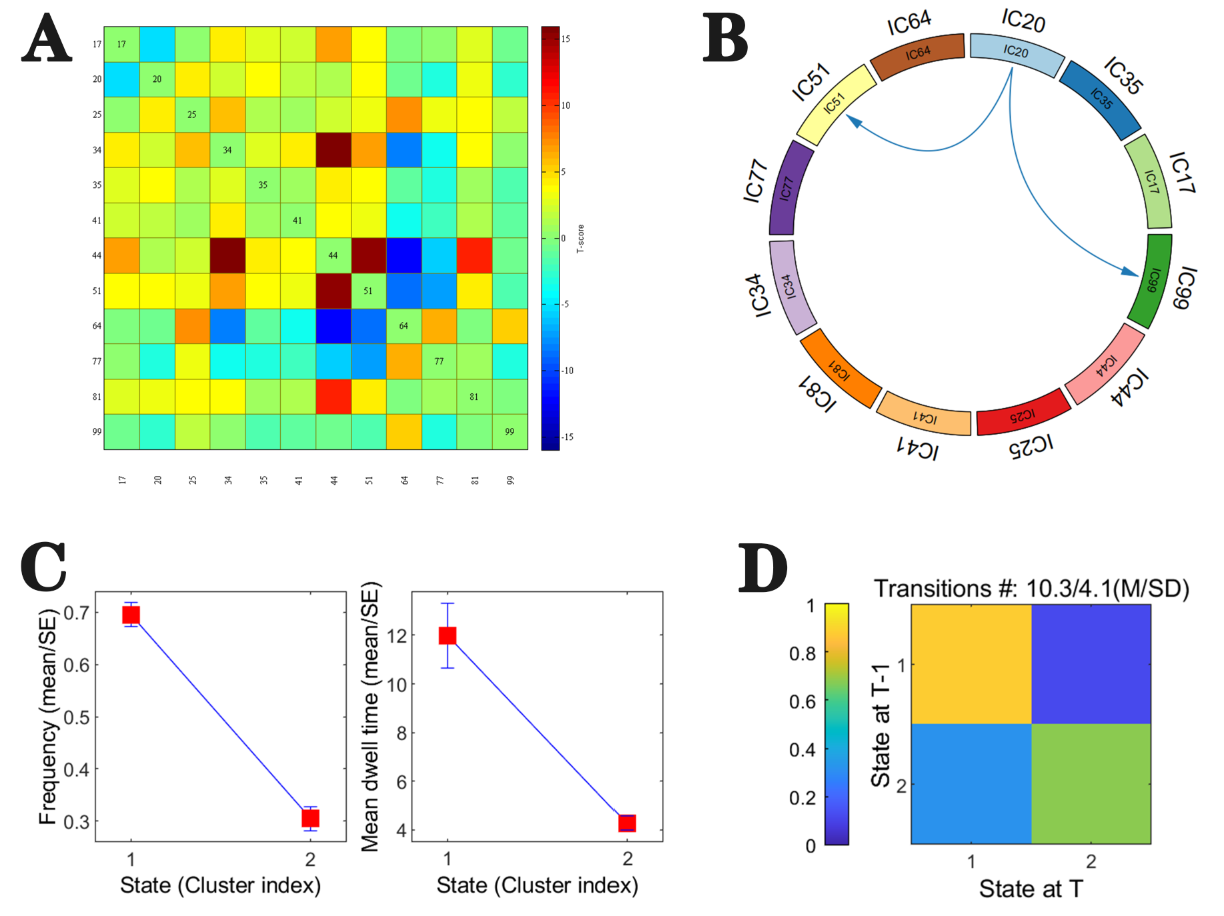
A.Group averaged static effective connectivity (EC) between
default mode component pairs was computed using an entire scan. B. State-specific
group differences in centroid matrices (P < 0.05, FDR corrected). The arrows
indicate the directions of causal influences. The lines with cool color
indicate the decreased effective connectivity (EC) in T2DM patients compared
with HCs. C. The difference of frequency and MDT between state1 and state2. D.
The transition’s probability between state1 and state2.
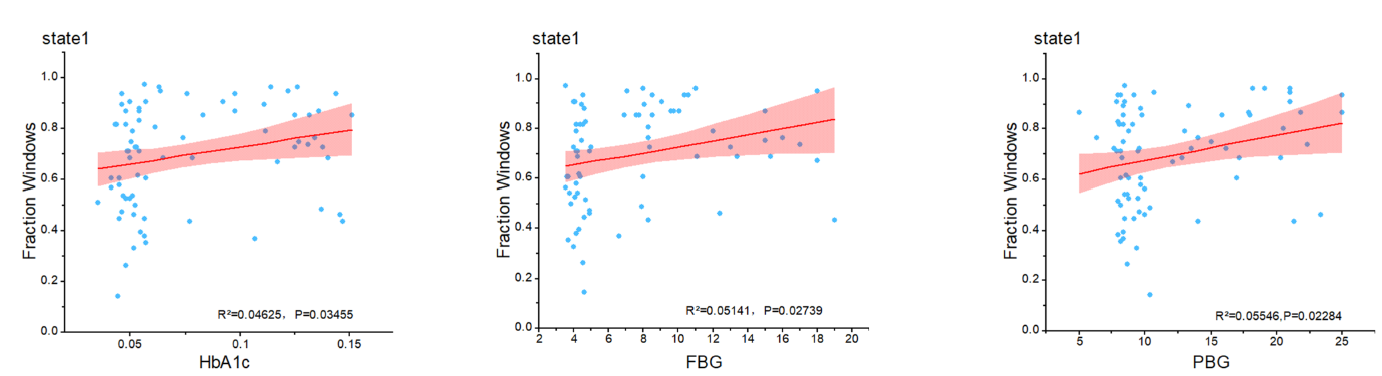
The correlation between fasting blood
glucose (FBG), postprandial blood glucose(PBG), glycosylated hemoglobin (HbA1c)
and fractional windows of state1.
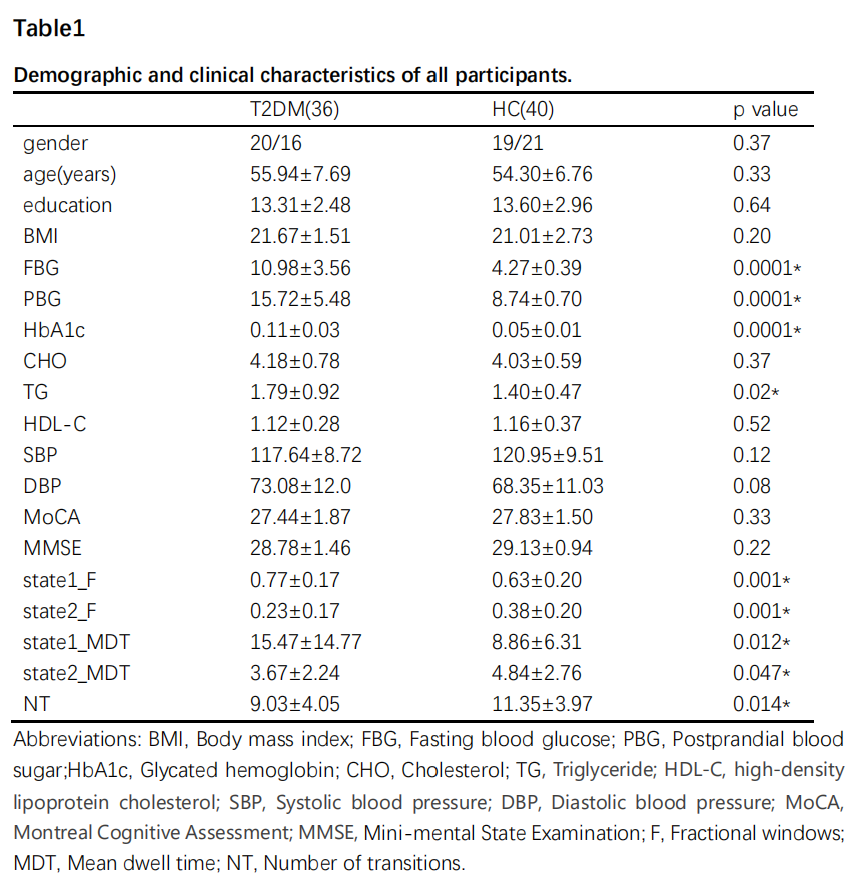
Demographic and clinical characteristics
of all participants.
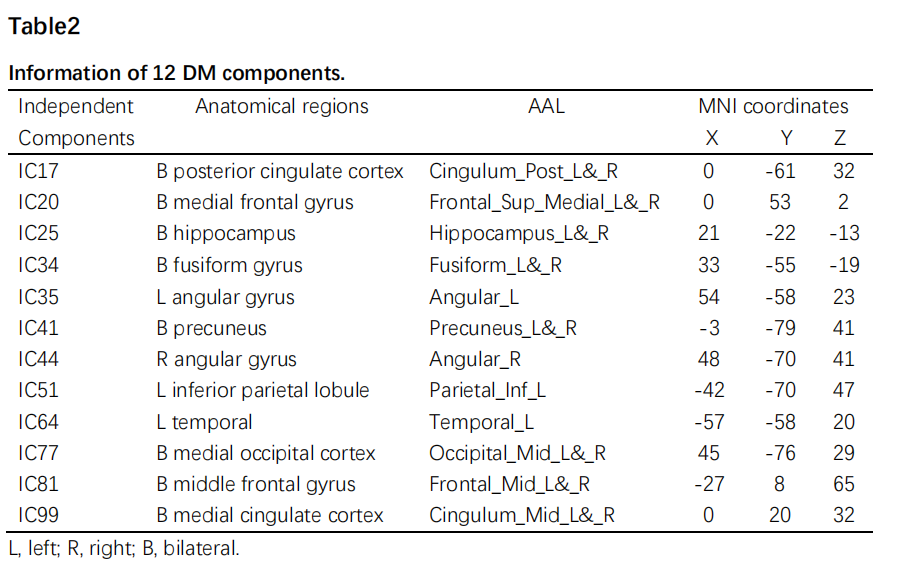
Information of 12 DM components.
DOI: https://doi.org/10.58530/2023/2853