2851
Dysregulated brain dynamics in visual-motor network of type 2 diabetes and its relation to cognitive impairment1Department of Radiology & Functional and Molecular Imaging Key Lab of Shaanxi Province, Tangdu Hospital, Fourth Military Medical University (Air Force Medical University), Xi’an, China
Synopsis
Keywords: Brain Connectivity, Diabetes
To screen type 2 diabetes mellitus(T2DM)-specific effective connective (EC) network, the dynamic features of which may contribute to distinguishing T2DM patients with mild cognitive impairment (T2DM-MCI) from controls. Screening of resting-state functional MRI (rs-fMRI) data from early T2DM, T2DM-related static causality network mainly consisted of nodes in visual and sensorimotor network. In the visual-motor network, the fractional windows and mean dwell time of strong dEC state in T2DM-MCI patients were significantly higher than controls. The sum of dECs (sumdEC) could effective distinguish the mT2DM-MCI indicating sumdEC to be a promising biomarker for the early cognitive impairment in T2DM.Background
Type 2 diabetes mellitus (T2DM) is a significant risk factor for mild cognitive impairment (MCI)1. The mainly impaired executive function and memory lead to the poorer performance of the rather demanding glucose monitoring tasks2-4. Yet, the susceptible directed network and its dynamic features remain poorly understood. Here, we screen T2DM-specific effective connective (EC) network, the dynamic features of which make contribution to distinguishing T2DM patients with cognitive impairment from controls and were correlated with cognitive performance in T2DM patients.Methods
Twenty-eight local T2DM patients with normal cognition (lT2DM-CN) and 30 age, sex and education matched healthy controls (lHC-CN) were recruited. Resting-state functional MRI (rs-fMRI) data were subsequently acquired to screen the directed susceptible network for early cognitive impairment in T2DM using network-based statistic. Then, 31 multi-centered T2DM patients with MCI (mT2DM-MCI), 28 T2DM patients with normal cognition (mT2DM-CN) and 28 age, sex and education matched healthy controls (mHC-CN) were obtained from ADNI3 database to explore the directed dynamic temporal heterogeneity of the susceptible network in the three groups. The relationship between connectome characteristics and cognitive performance were also evaluated using Pearson correlation analysis and the binary logistic regression analysis.Results
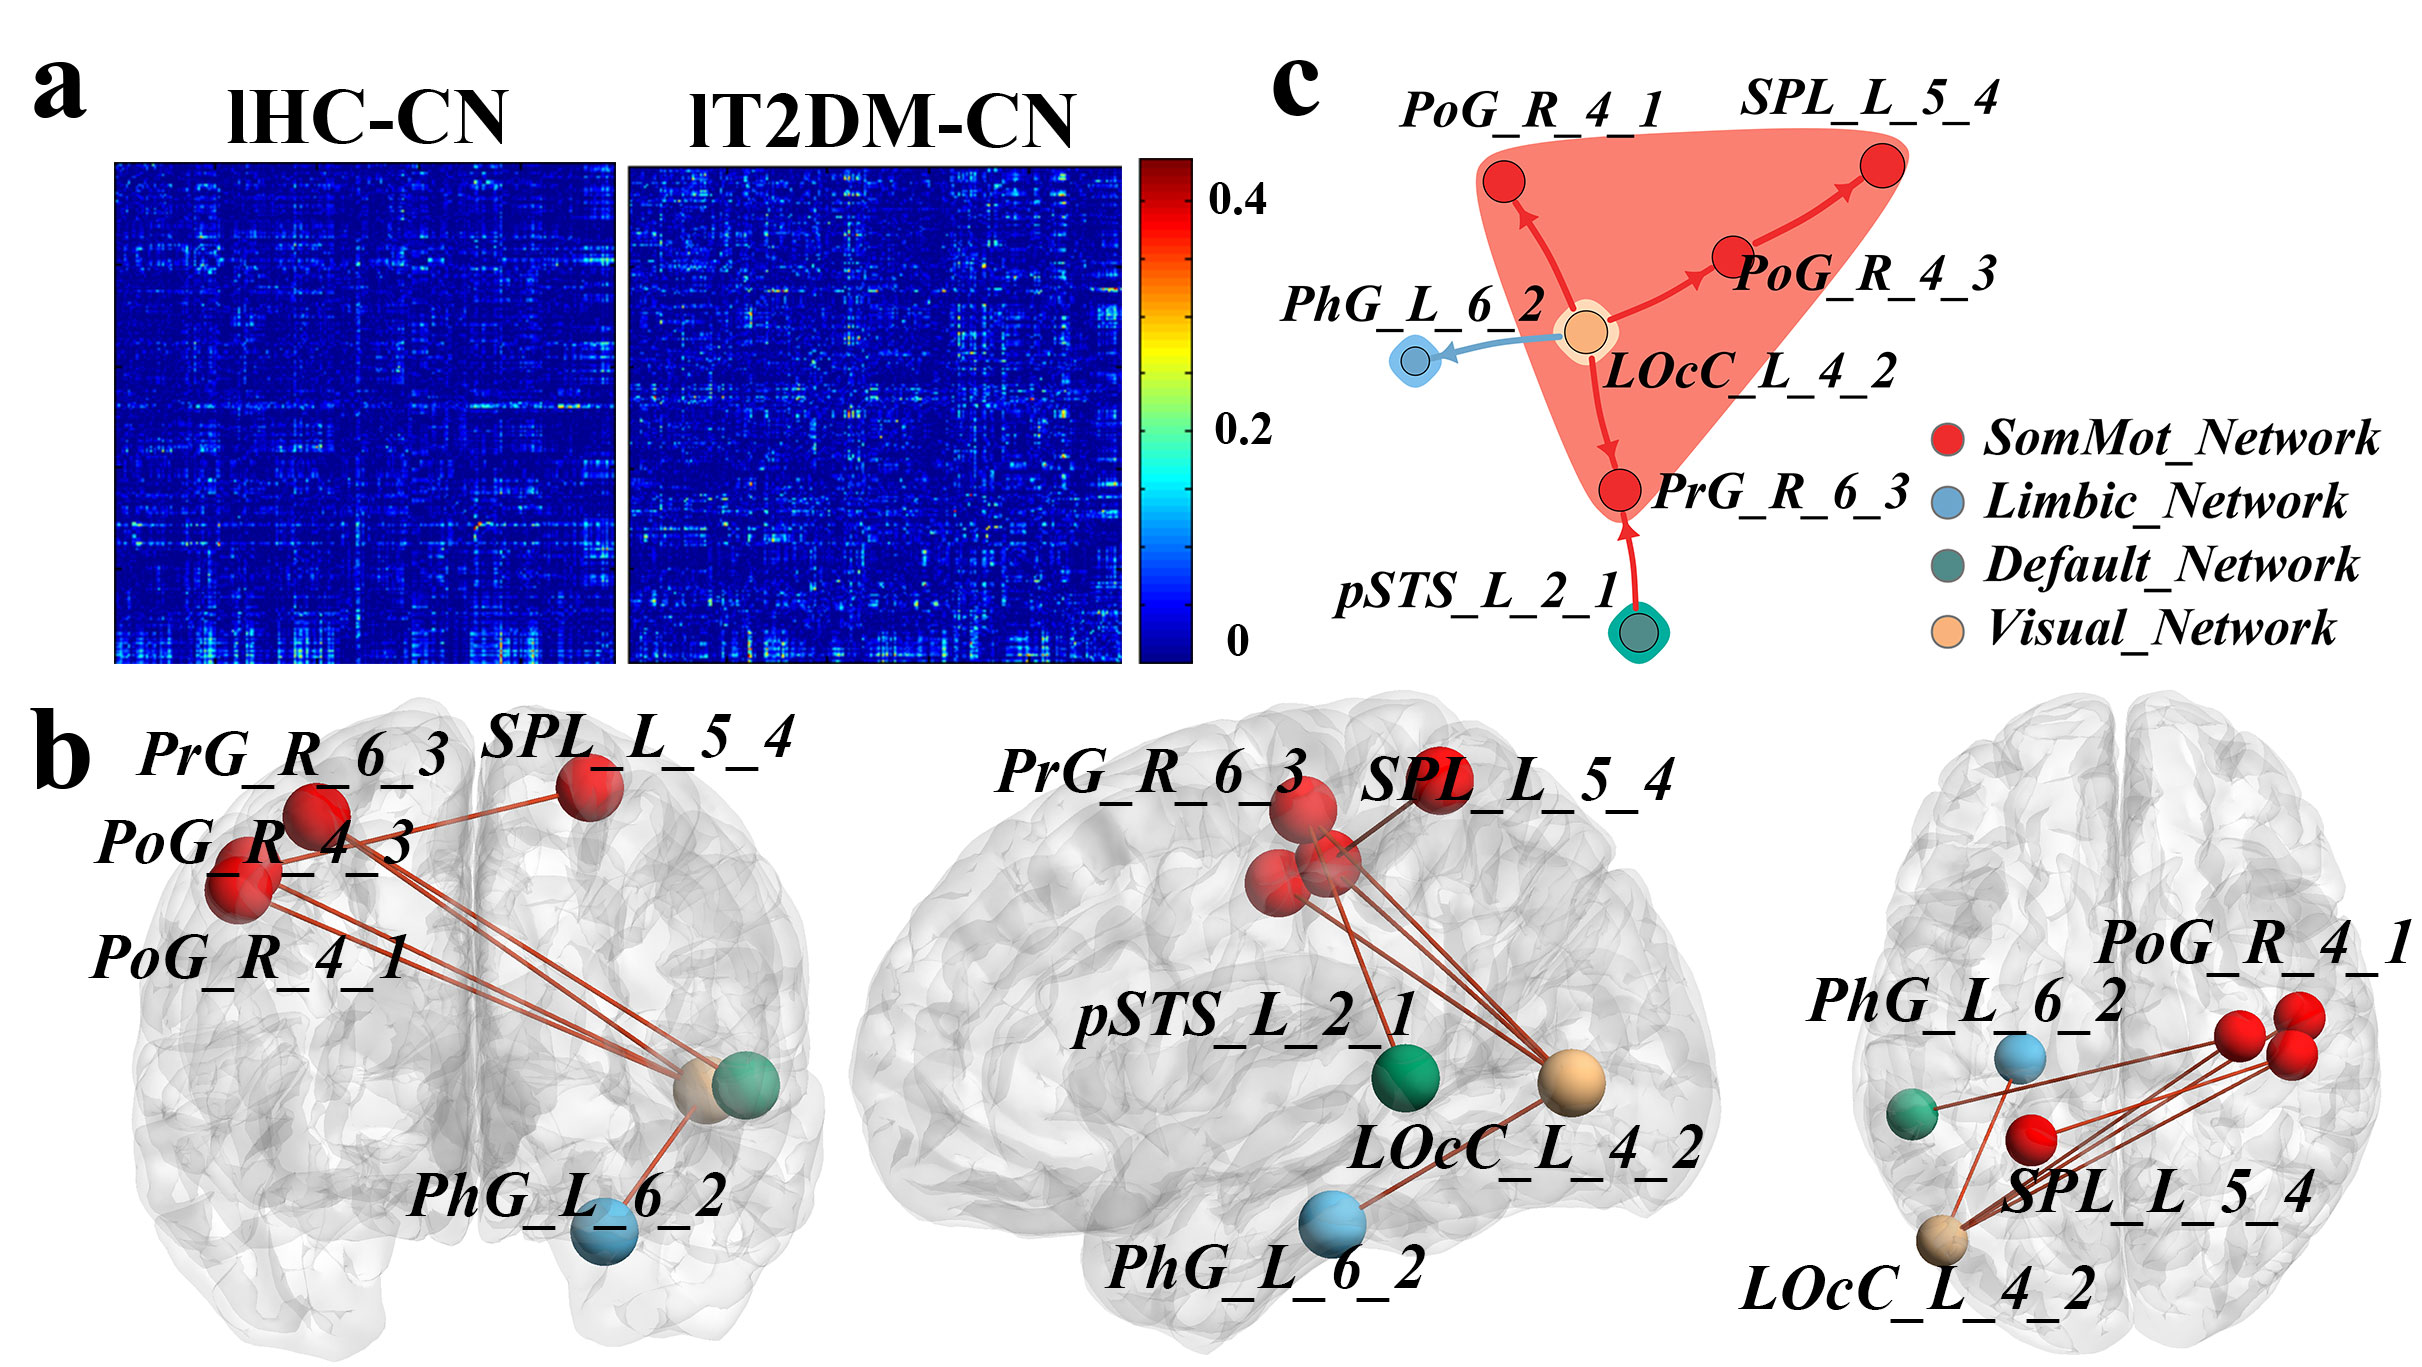
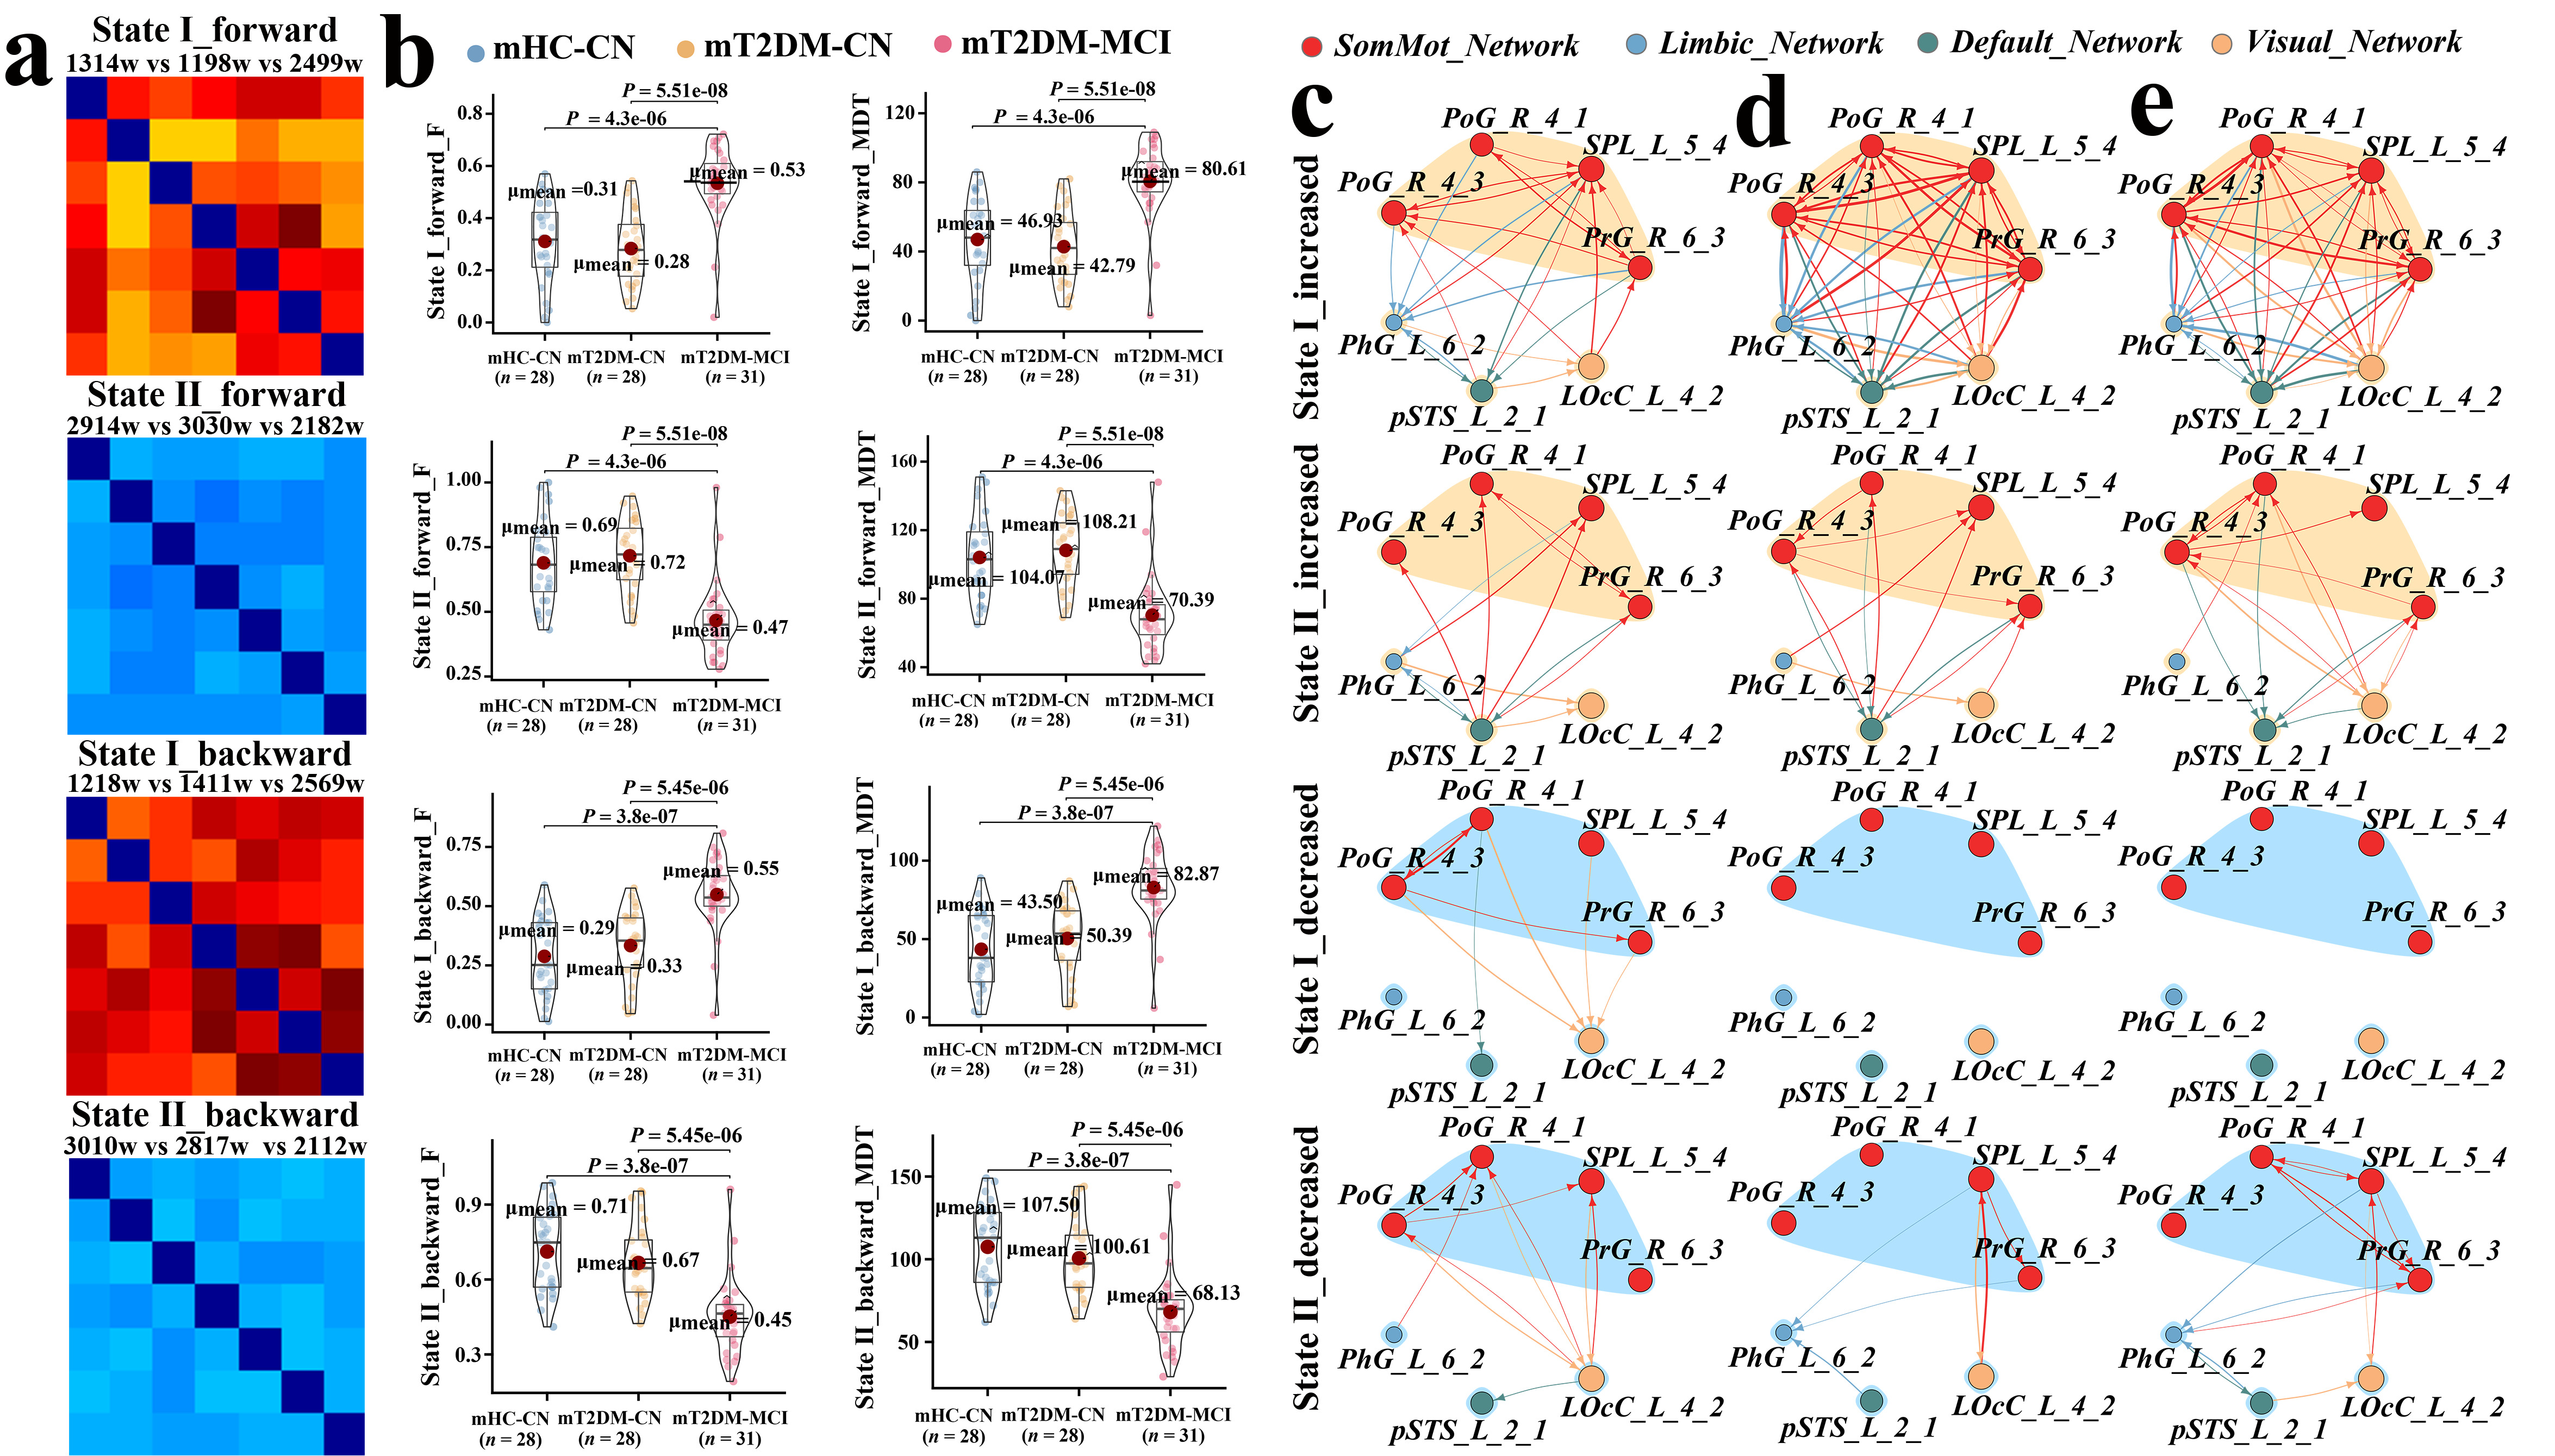
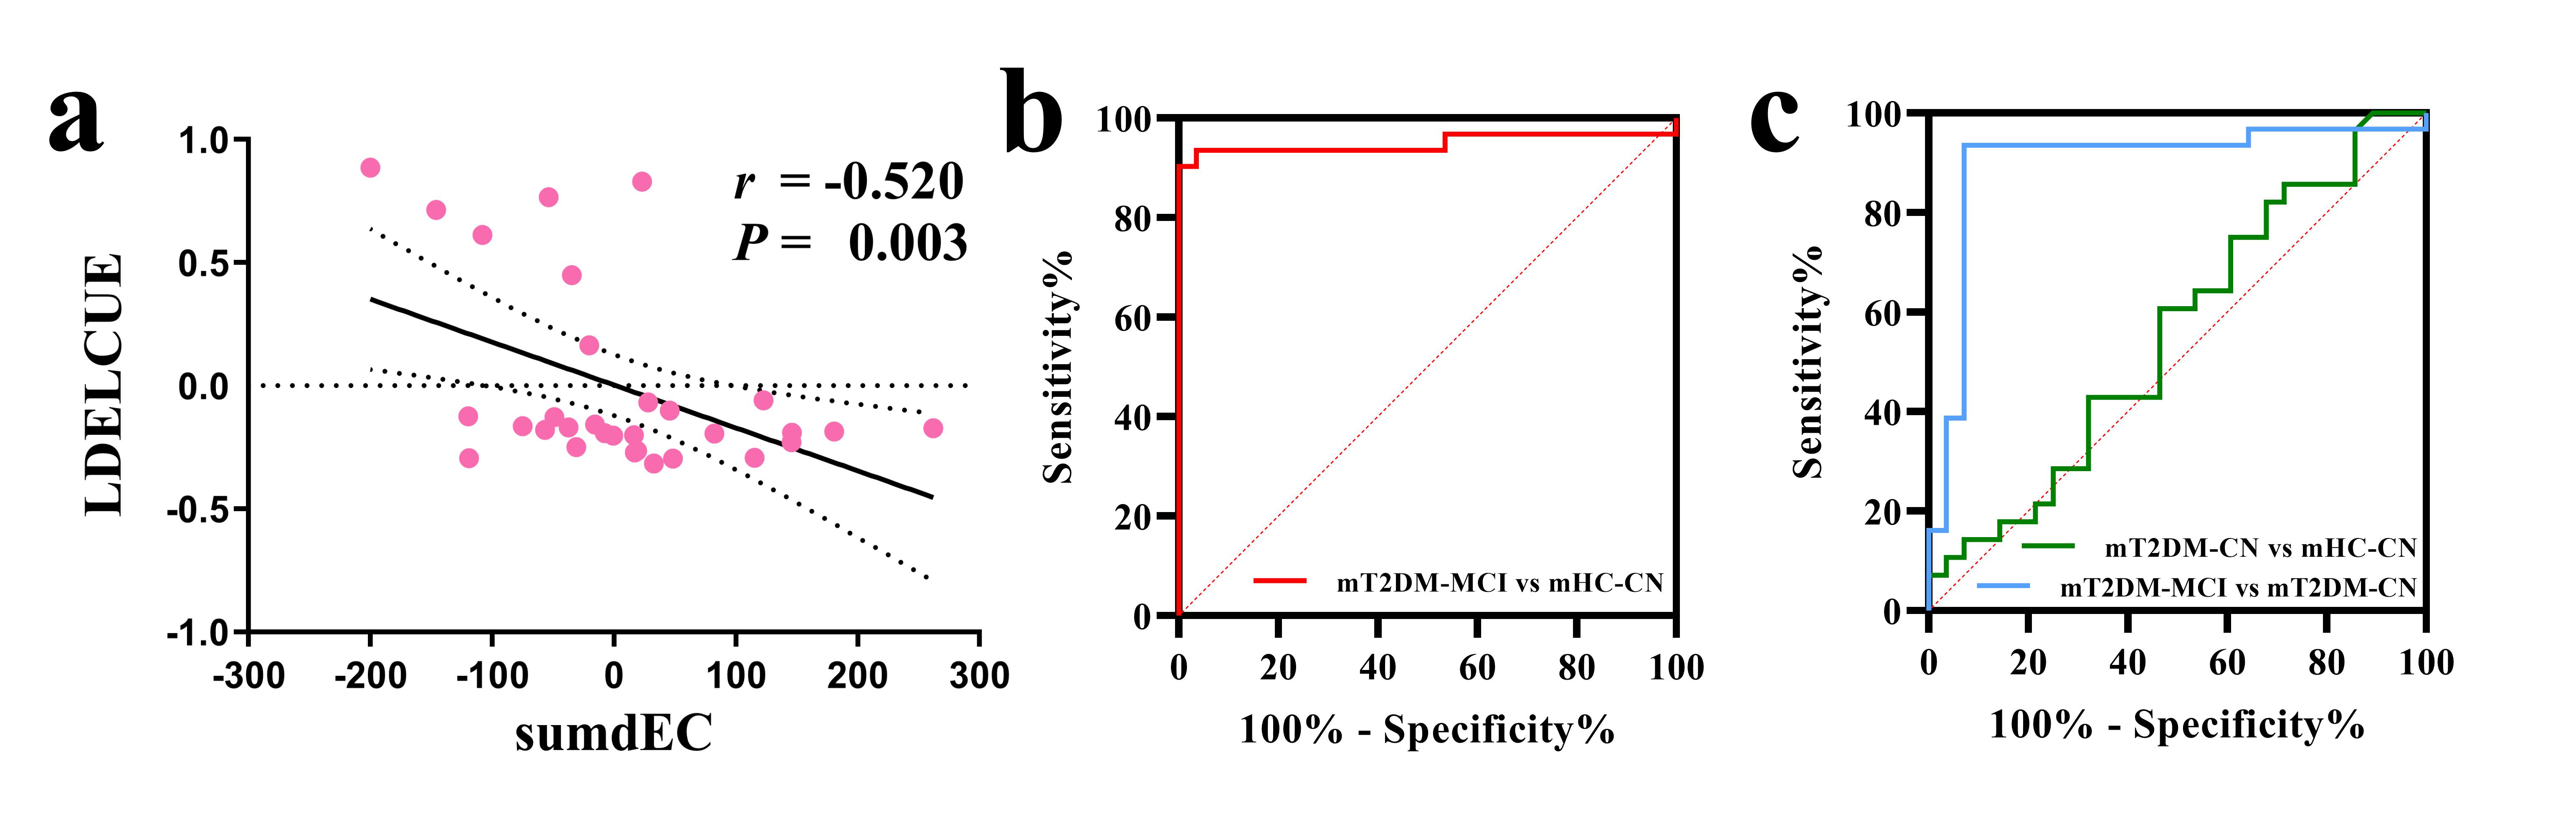
Poorer performance was found in lT2DM-CN in subitems of scales assessing executive and memory function. Extracted from cognitive declined lT2DM-CN, the T2DM-related static causality network mainly consisted of nodes in visual and sensorimotor network, including left area V5/MT of occipital gyrus (LOcC _L_4_2), right area 1/2/3 upper limb of postcentral gyrus (PoG_R_4_1), right area 2 of postcentral gyrus (PoG_R_4_3), right area 4 upper limb of precentral gyrus (PrG_R_6_3), left caudal area 35/36 of parahippocampal gyrus (PhG_L_6_2), left postcentral area 7 of superior parietal lobule (SPL_L_5_4), and left rostroposterior superior temporal sulcus (pSTS_L_2_1) (Figure 1b-c). V5/MT region of visual cortex was the core. The main positive ECs were from visual network to sensorimotor network. Verified in different window widths, the dynamic network mode among multi-centered groups can be divided into stronger interconnected State I and relatively sparsely connected State II (Figure 2a). While, the fractional windows (F) and mean dwell time (MDT) of State Ⅰ in mT2DM-MCI were significantly higher than those in mT2DM-CN and mHC-CN groups, the F and MDT of State Ⅱ in mT2DM-MCI were significantly lower than those in the two control groups. No significant different F and MDT was found between mT2DM-CN and mHC-CN groups (Figure 2b). Comparing the strength of connections between each pair of the multi-centered groups, the predominantly altered dynamic ECs (dECs) were found in State I with more altered dECs in the mT2DM-MCI group (Figure 2c-e). The sum of dECs (sumdECs) was negatively correlated with number of cues in Logical Memory test (LDELCUE) (Figure 3a). The sumdECs could effective distinguish the mT2DM-MCI from mHC-CN and mT2DM-CN with the accuracy to be 0.949 and 0.898, respectively (Figure 3b-c).Conclusions
Cognitive, EC and dEC alterations were detectable in lT2DM-CN and mT2DM-MCI patients. Early and subtle cognitive alterations in T2DM, underpinned by increased EC, may represent an early harmful effect of T2DM to working memory system. The high differential diagnostic efficiency of sumdECs in visual-motor network was further evidence that sumdEC were more sensitive to the cognitive impairment in early T2DM. Our results contribute to a better understanding of the mechanism for the cognitive impairment in T2DM and its promising neuroimaging biomarkers.Acknowledgements
The authors want to thank the clinical and the nursing team of the Endocrinology Department in Tangdu Hospital for their cooperation with working on patients' recruiting. Our gratitude also goes to the team of Shen Zhen Sinorad Medical Electronics Co., Ltd and Mr. Wei Xiao-Cheng (MR research, GE Healthcare China) for their continuous technique support.References
1. You Y, Liu Z, Chen Y, et al. The prevalence of mild cognitive impairment in type 2 diabetes mellitus patients: a systematic review and meta-analysis. 2021;58(6):671-685.
2. Peña-González P, Mondragón-Maya A, Silva-Pereyra J, Roa-Rojas P. Cognitive Reserve and Executive Functions in Adults with Type 2 Diabetes. 2020;2020:7941543.
3. Wu CY, Ouk M, Wong YY, et al. Relationships between memory decline and the use of metformin or DPP4 inhibitors in people with type 2 diabetes with normal cognition or Alzheimer's disease, and the role APOE carrier status. Alzheimer's & dementia : the journal of the Alzheimer's Association. 2020;16(12):1663-1673.
4. Munshi MN. Cognitive Dysfunction in Older Adults With Diabetes: What a Clinician Needs to Know. Diabetes care. 2017;40(4):461-467.
Figures