2850
Brain Micro-Structural and Functional Alterations for Cognitive Function Prediction in the End-Stage Renal Disease Patients
Jiahui Zheng1, Weiqiang Dou2, Xiangxiang Wu1, and Haifeng Shi1
1Department of Radiology, The Affiliated Changzhou NO.2 People’s Hospital of Nanjing Medical University, changzhou, China, 2GE Healthcare, MR Research China, Beijing, China
1Department of Radiology, The Affiliated Changzhou NO.2 People’s Hospital of Nanjing Medical University, changzhou, China, 2GE Healthcare, MR Research China, Beijing, China
Synopsis
Keywords: Brain Connectivity, Brain, DKI FC
The goal of this study was to investigate the relationships of altered brain micro-structure and function, and cognitive function for ESRD patients undergoing maintenance hemodialysis. Specifically, diffusion kurtosis imaging (DKI), the resting-state functional connectivity (FC) algorithm, and the least squares support vector regression machine (LSSVRM) were utilized to conduct our study. Brain micro-structural and functional changes were found in ESRD patients, which may account for the onset of cognitive impairment in affected patients. These quantitative parameters combined with our optimized prediction model may be helpful to establish reliable imaging markers to detect and monitor cognitive impairment associated with ESRD.Introduction
Cognitive impairment (CI) is extremely prominent in end-stage renal disease (ESRD) patients, and involves deterioration in overall cognition, executive function, and attention1,2. However, its underlying pathogenesis remains poorly understood. Recently, tentative quantitative analyses on cerebral impairment have been performed on ESRD patients using diverse MRI techniques. Previous imaging studies in ESRD patients have been based solely on a single modality, which provided limited benefit in establishing early clinical diagnosis and treatment. In this current study, we aimed to apply diffusion kurtosis imaging (DKI) to detect brain microstructure alterations, and explored the usage of resting-state functional connectivity (FC) algorithm based on seed regions, which showed significantly altered values of DKI derived parameters. Finally, the optimized the least squares support vector regression machine (LSSVRM) combined with these quantitative imaging were used to predict cognitive function in ESRD patients.Materials and Methods
Subjects: Fifty ESRD patients who received maintenance hemodialysis treatment in the hemodialysis center from February 2020 to June 2021 were recruited as the patient group. 36 healthy subjects without known renal disease and other systemic disorders were enrolled as healthy controls. Both groups were matched based on age, gender, and education years.MRI acquisition: All MRI experiments were performed on a 3.0T MRI (Discovery MR750, General Electric Healthcare, USA) equipped with a standard 32-channel head and a spine combined coil. High-resolution anatomic T1-weighted images were acquired with three-dimensional brain volume imaging (3D-BRAVO) sequence (152 slices; slice thickness = 1.2 mm (no gap); TR = 8.2 ms; TE = 3.2 ms; FA = 12°; matrix = 256×256; FOV = 240 mm×240 mm). rs-fMRI data were acquired with the gradient-recalled echo-planar imaging (GRE-EPI) sequence (33 slices; 240 time-points; slice thickness = 4 mm; TR= 2000 ms; TE=40 ms; FA = 90°; matrix = 64×64; FOV = 240 mm×240 mm). DKI data were acquired with a single-shot echo-planar imaging (SS-EPI) sequence (30 directions; 3 b values: 0, 1000, 2000 s/mm2, NEX = 2, slice thickness = 3.6 mm (no gap); TR=6500 ms; TE = 95.8 ms; matrix = 128×128; FOV= 240 mm×240 mm).
Image analysis: The DKI parameter metrics, including mean kurtosis (MK), axial kurtosis (AK), radial kurtosis (RK), kurtosis anisotropy (KA), were calculated using Diffusion Kurtosis Estimator (DKE) software. Based on the Resting-state fMRI data analysis Toolkit (RESTplus_V1.2), the functional connectivity calculations were performed with selected seed regions, which showed significantly altered DKI parameters.
Data analysis: The demographic, clinical data and neuropsychological test scores were analyzed using SPSS (SPSS version 23.0). The chi-squared test and two-sample independent Student’s t test compared the gender-based differences and quantitative data between patient and control groups, respectively. Two-sample t-test was performed in SPM8 to detect differences of DKI parameters and FC values between the two groups with p < 0.01 (DKI was corrected by family-wise error criterion [FWE]; FC was corrected by cluster level FWE). Pearson correlation analysis was performed using GRETNA software to explore the relationship among DKI parameters, FC values, and MoCA scores with p < 0.05 and corrected by false discovery rate criterion (FDR). Finally, LSSVRM was used to perform regression predictions of MoCA scores in ESRD patients, and the whale optimization algorithm (WOA) was applied to improve prediction accuracy.
Results
In ESRD patients, DKI parameters changed significantly in 12 brain regions. Among these regions, nine brain regions had decreased MK and AK values, and three brain regions had increased RK values. However, there were no significant differences observed in KA between the two groups. FC values were significantly altered in nine brain regions, with decreased FC observed in five brain regions and increased FC observed in four brain regions (Tables 1, 2, and Fig. 1). Pearson correlation analysis revealed that altered FC values correlated with changed DKI values. In addition, FC values in three brain regions involved in the temporal and frontal lobes positively correlated with MoCA scores, while DKI values in two other brain regions involved in the lingual gyrus positively correlated with MoCA scores (Fig. 2). The prediction models were capable of predicting cognitive function with great accuracy in ESRD patients. Based on FC values, the mean square error (MSE), root mean square error (RMSE), mean absolute error (MAE), mean absolute percentage error (MAPE), and R-squared (R2) values between the actual scores and predicted scores were 0.72, 0.85, 0.75, 3.57%, and 0.55, respectively. Based on DKI values, the MSE, RMSE, MAE, MAPE, and R2 values between the actual scores and predicted scores were 0.57, 0.75, 0.64, 3.10%, and 0.59, respectively (Fig. 3).Discussion and Conclusions
Our study demonstrated that widespread brain microstructural and functional alterations in ESRD patients undergoing maintenance hemodialysis do not occur independently. Most regions with disrupted structural and functional integrity were mainly involved in default model network, frontoparietal network and limbic system regions, and were associated with multi-dimensional CI. More importantly, prediction models based on these multimodal findings were able to predict cognitive function in our cohort of ESRD patients. In conclusion, this study demonstrated the feasibility of predicting disease progression and compensation in ESRD patients based on brain microstructure and function alterations.Acknowledgements
No acknowledgement found.References
1. Kalantar-Zadeh K, Jafar TH, Nitsch D, et al. Chronic kidney disease. Lancet 2021; 398:786–802.
2. van Zwieten A, Wong G, Ruospo M, et al. Prevalence and patterns of cognitive impairment in adult hemodialysis patients: the COGNITIVE-HD study. Nephrol Dial Transpl 2018; 33:1197–1206.
Figures

Table 1: AAL
Automated Anatomical Labeling; MNI Montreal Neurological Institute.
MK,
mean kurtosis; AK, axial kurtosis; RK, radial kurtosis.
Corrected
by family wise error (FWE) criterion and set at P< 0.01.

Table 2: AAL Automated
Anatomical Labeling; MNI Montreal Neurological Institute.
All ROIs were brain
regions with altered DKI values, which included in the table 2. (ROI-1,
SMG.R[AK]; ROI-2, LING.R[AK]; ROI-3, LING.L[AK]; ROI-4, MOG.L[AK]; ROI-5,
ROL.L[AK]; ROI-6, MOG.L[MK]; ROI-7, ROL.L[RK])
Corrected by
cluster level family wise error (FWE) criterion and set at P< 0.01.
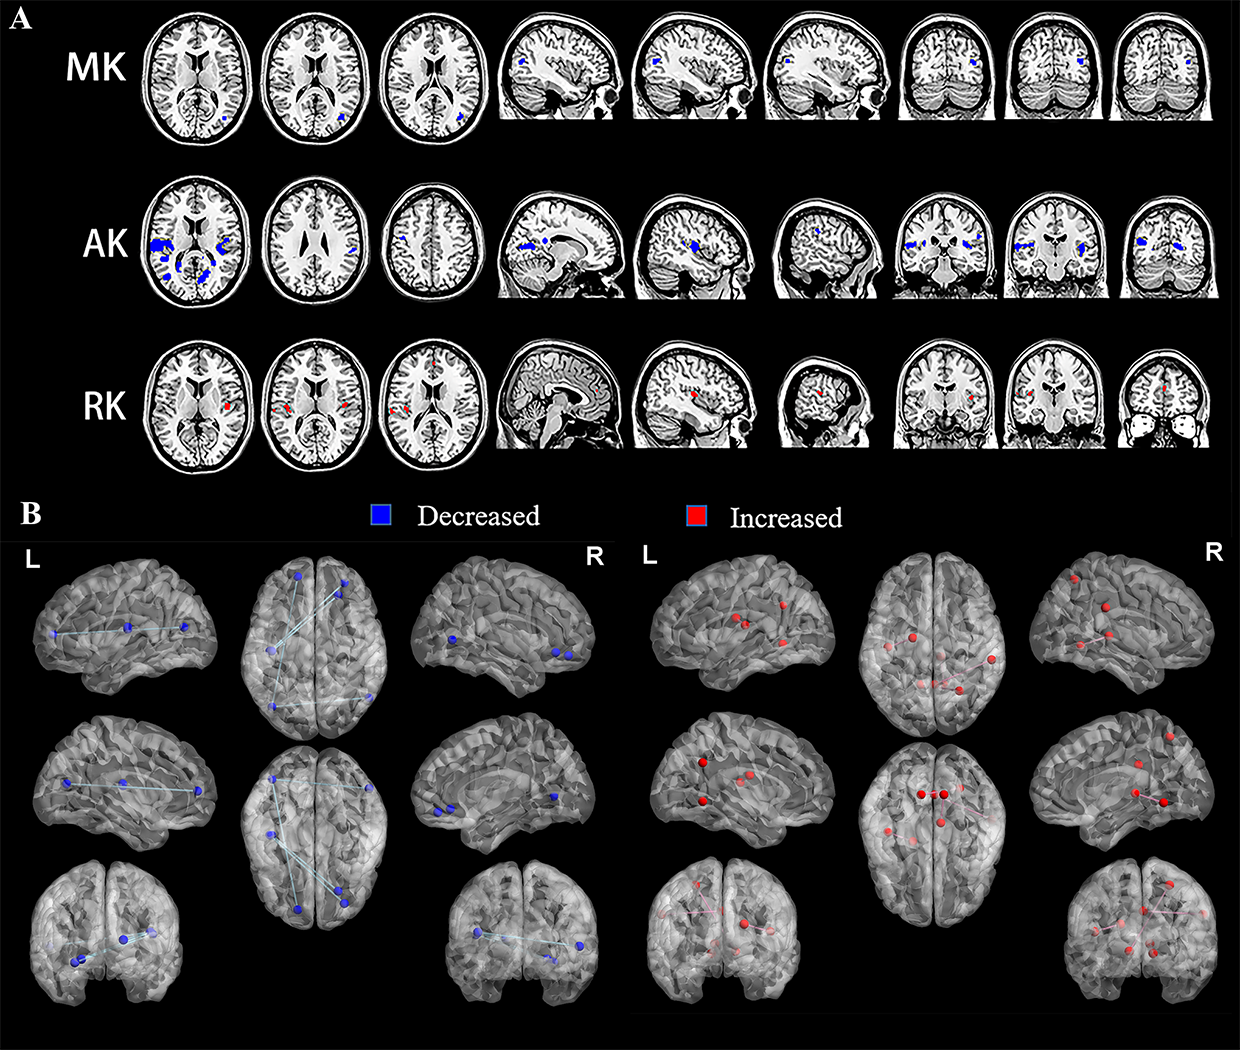
Figure 1: Brain regions with
altered DKI values and FC values of ESRD patients are shown in panel A and B,
respectively. Blue patches and dots indicate regions with significantly
decreased DKI values and FC values, while red patches and dots indicate regions
with significantly increased DKI values and FC values.
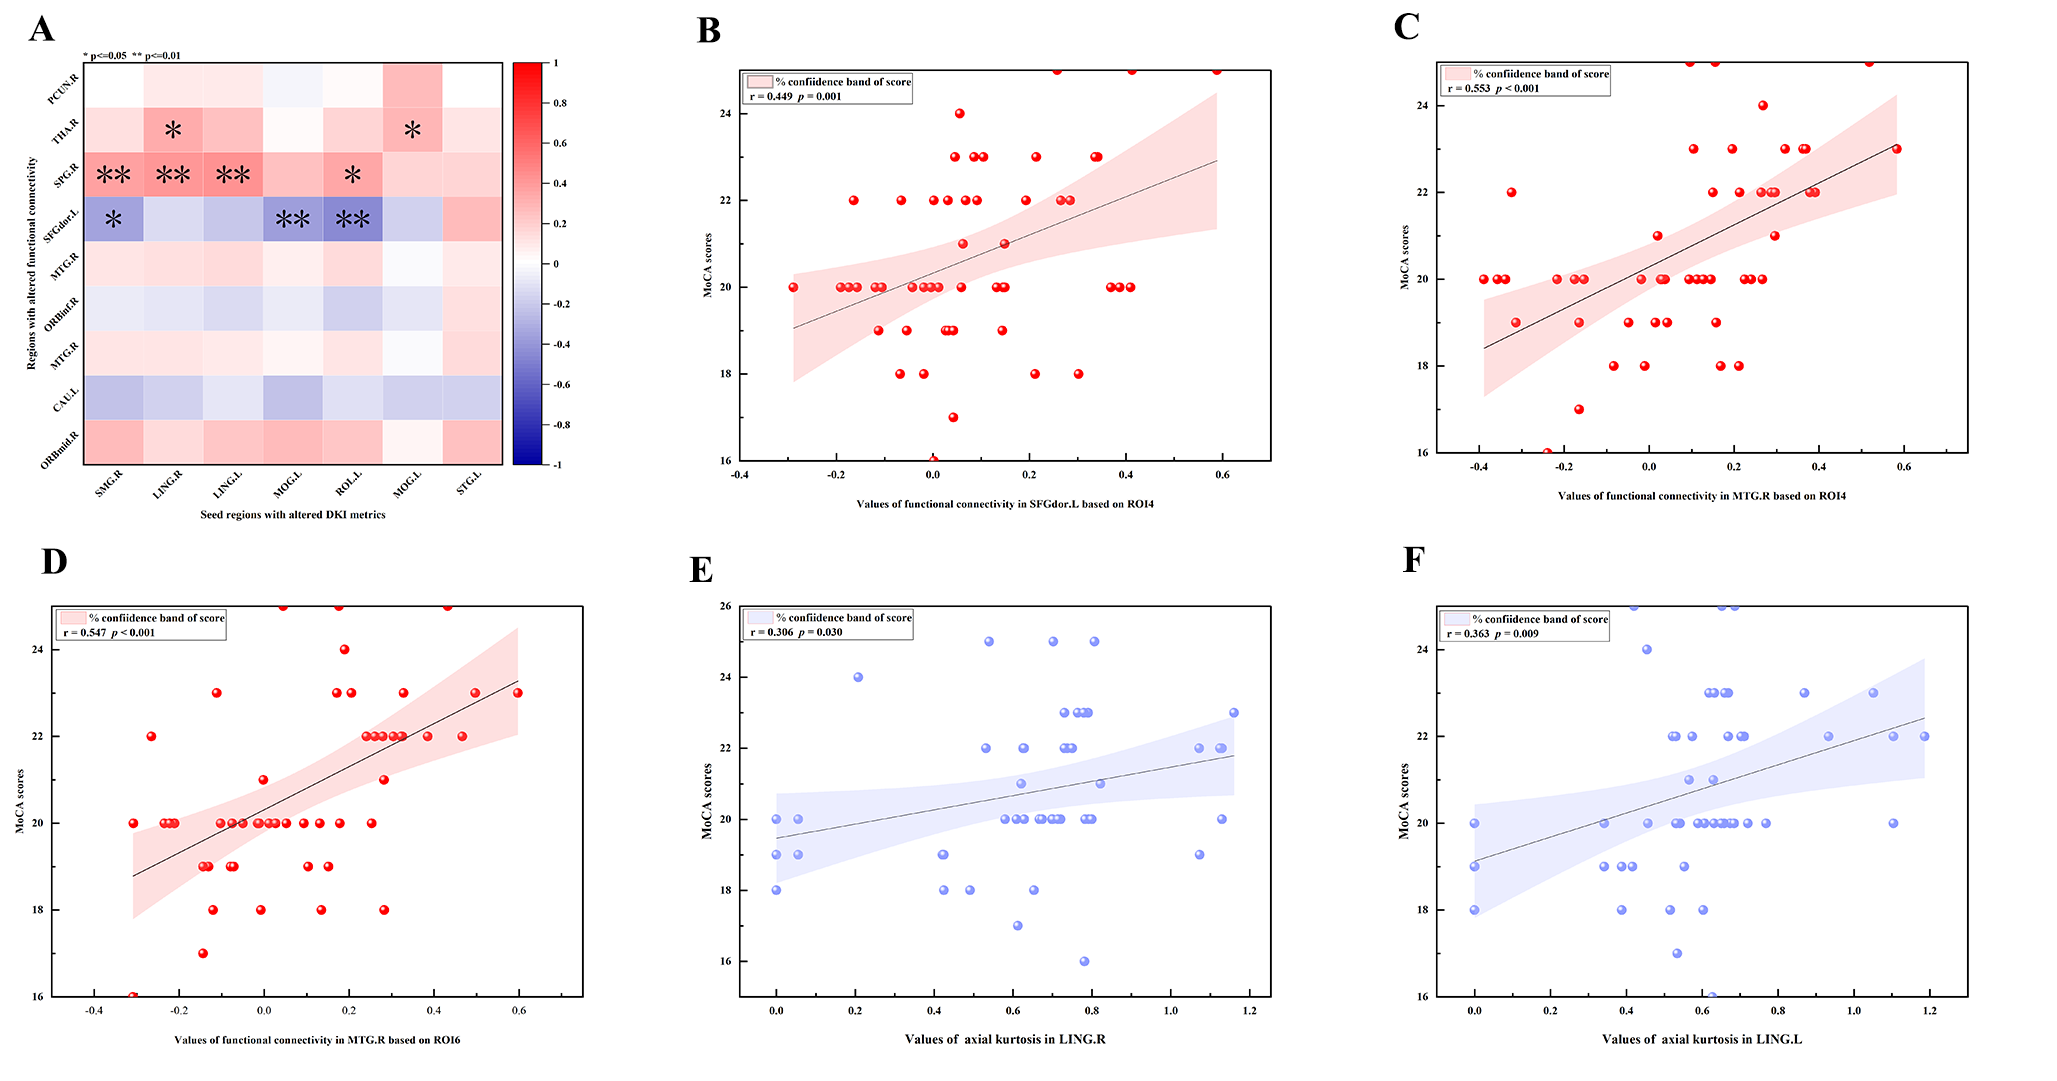
Figure 2: Correlation analysis results. A,
correlation matrix diagram of DKI values and FC values of ESRD patients. B-C,
significant positive correlation between FC values in three brain regions and
MoCA scores of ESRD patients. E-F, significant positive correlation between AK
values in two brain regions and MoCA scores of ESRD patients.
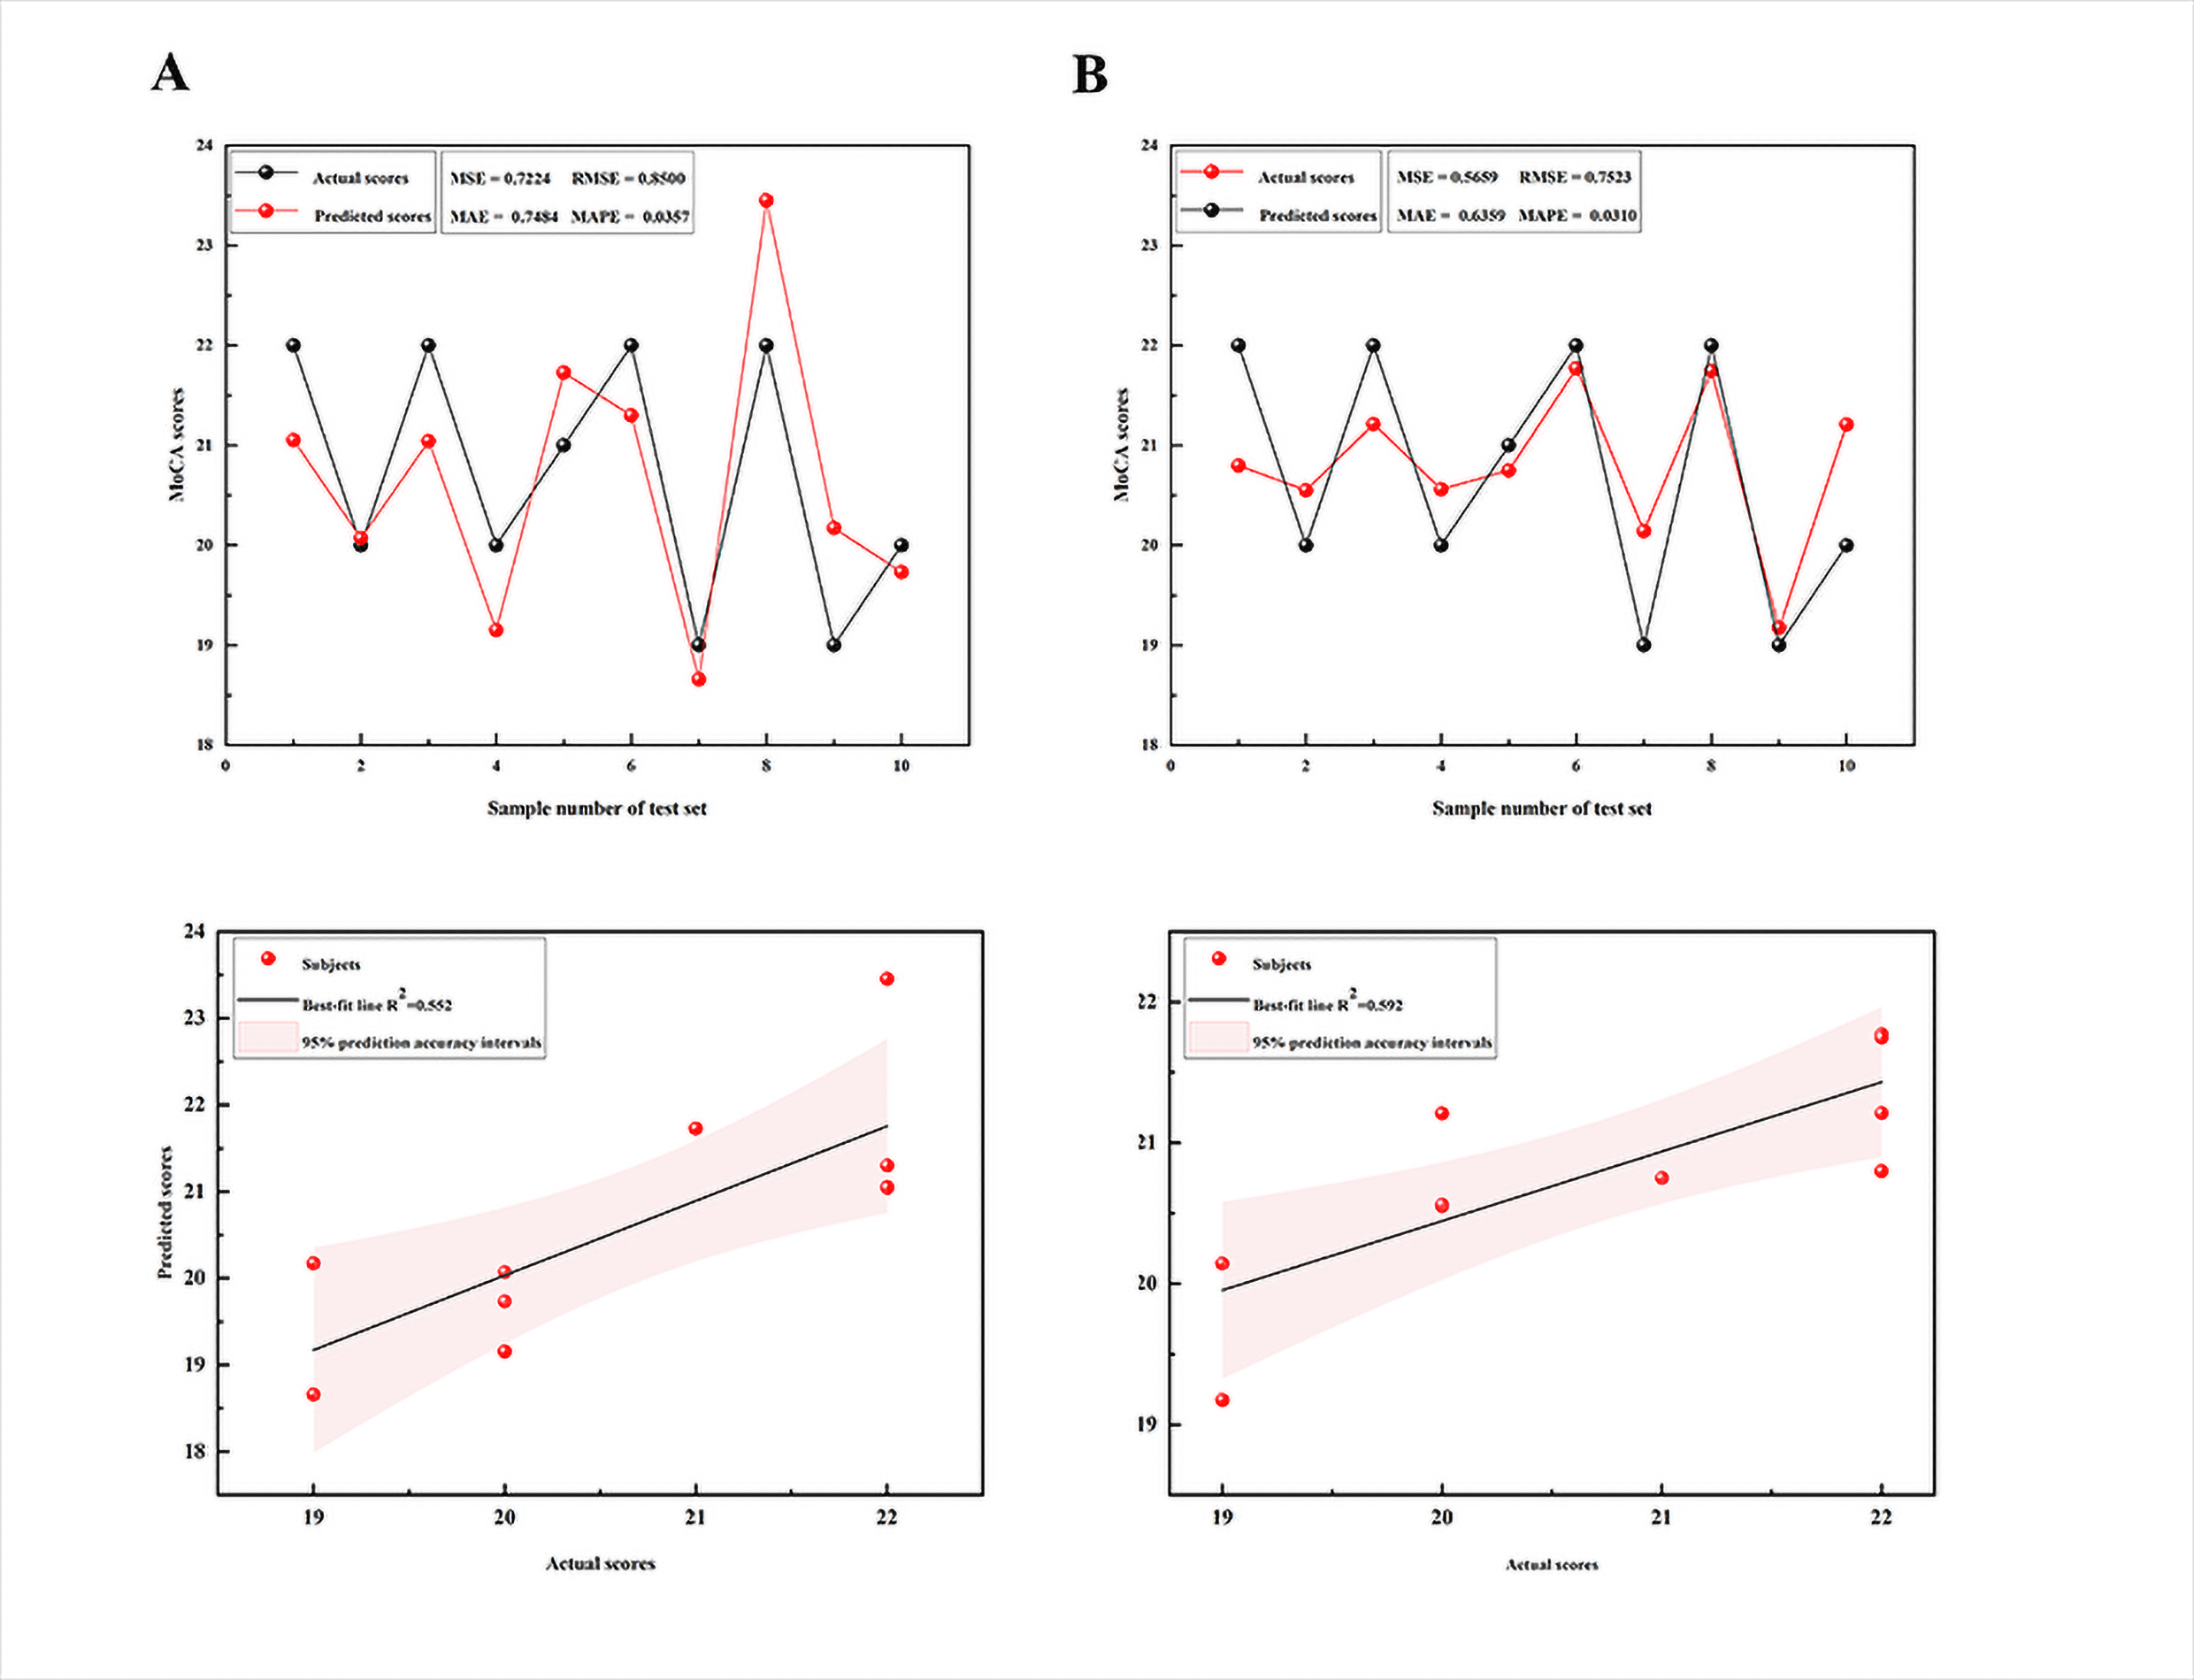
Figure 3: Predictive ability
of microstructural and functional alterations in identifying cognitive
dysfunction. A, actual scores and predicted scores of LSSVRM based on FC
values. B, actual scores and predicted
scores of LSSVRM based on DKI values. The dots in the figures indicate the
subjects included in the test set of prediction models. The dots in the figures
below are partially overlapped because the differences of predicted scores of
some included subjects are less than 0.1.
DOI: https://doi.org/10.58530/2023/2850