2849
Disrupted topological organization of hubs in Parkinson’s disease patients with freezing of gait.1Cleveland Clinic Lou Ruvo Center for Brain Health, Las Vegas, NV, United States, 2Department of Neurosciences, University of California San Diego, La Jolla, CA, United States, 3Department of Physical Therapy and Athletic Training, Saint Louis University, St. Louis, MO, United States, 4Memory & Cognitive Disorders Program Hoag, Pickup Family Neurosciences Institute, Newport Beach, CA, United States, 5Chambers-Grundy Center for Transformative Neuroscience, Department of Brain Health, School of Integrated Health Sciences, University of Nevada, Las Vegas, NV, United States, 6Department of Neurology, The University of Alabama at Birmingham, Birmingham, AL, United States, 7Central California Movement Disorders, Pismo Beach, CA, United States, 8Department of Radiology, The University of Alabama at Birmingham, Birmingham, AL, United States
Synopsis
Keywords: Brain Connectivity, Parkinson's Disease
Neuroimaging studies, including resting-state functional MRI (rs-fMRI), have implicated altered resting-state functional connectivity (rs-FC) in PD patients with freezing of gait (PD-FOG) and showed that the disruption of connectivity between the resting state networks (RSNs) was correlated with FOG. However, the network organization in PD-FOG remains poorly understood. In this study, we use rs-fMRI data and graph theoretical approaches to explore the reorganization of functional networks in PD-FOG. The results of our study suggest that there is a substantial reorganization of regional brain hubs and disruption in the higher-order functional network topology in PD-FOG participants compared to PD-nFOG.Introduction
Neuroimaging studies, including resting-state functional MRI (rs-fMRI), have implicated altered resting-state functional connectivity (rs-FC) involving the frontoparietal network and visual network in PD patients with freezing of gait (PD-FOG) and showed that the disruption of connectivity between the resting state networks (RSNs) was correlated with FOG [1]. Recent studies have augmented these findings and have shown the involvement of the sensorimotor, dorsal attention, and default mode networks [2, 3]. Although most studies show a correlation between the severity of FOG symptoms and aberrant or altered regional functional connectivity, whether these observed changes in resting-state functional connectivity alter the network organization in PD-FOG remains poorly understood. In this study, we use rs-fMRI data and graph theoretical approaches to explore the reorganization of resting-state network topology in PD-FOG when compared to those without FOG (PD-nFOG) and to understand whether these topological changes, if any, are associated with any clinical measures of FOG that may inform about the FOG severity with disease progression.Methods
Data used for this study were obtained from the Center for Neurodegeneration and Translational Neuroscience (CNTN) database (www.nevadacntn.org). Resting-state fMRI (rs-fMRI) data were obtained from 16 PD-nFOG (6 Females; Age: 67.56 ± 6.63 years; Years of Education (YOE): 16.19 ± 2.19 years), 16 PD-FOG participants (3 Females; Age: 69.43±7.22 years; Years of Education (YOE): 14.93±2.41 years) and 16 healthy controls (HC) (7 Females; Age: 68.50±4.29 years; Years of Education (YOE): 16.19±1.47 years). PD participants were evaluated for FOG with a self-report measure (FOGQ) and a comprehensive battery of clinical tests (FOG score [4] including Timed Up and Go and Movement Disorders Society-Unified Parkinson’s Disease Rating Scale (MDS-UPDRS III)). These assessments were recorded and reviewed by three members of the research team to confirm the presence or absence of FOG. All participants underwent resting-state functional magnetic resonance imaging (rs-fMRI) and 850 volumes were acquired at a TR of 700 ms on a 3T MRI scanner. All data for participants with PD were obtained in the clinically defined ON state. After standard preprocessing, time series were obtained from 246 different ROIs identified based on the Brainnetome atlas [5]. The connectivity between two ROIs was estimated using Pearson’s correlation between their time series, and a 246 x 246 connectivity matrix was obtained for each subject. Graph-theoretical measures were used to compare group differences using custom Matlab® scripts and graph-theoretical network analysis (GRETNA) toolbox [6]. We also computed and compared hub (hub-disruption index [7]) and rich-club measures to understand whether there is a topological reorganization of hubs in PD-FOG participants. Nonparametric statistical analyses of group differences between global network properties and their association with clinical variables were then conducted using the permutation analysis of linear models (PALM) toolbox in FSL [8]. All statistical measures were considered significant at family-wise error corrected pcorr<0.05.Results
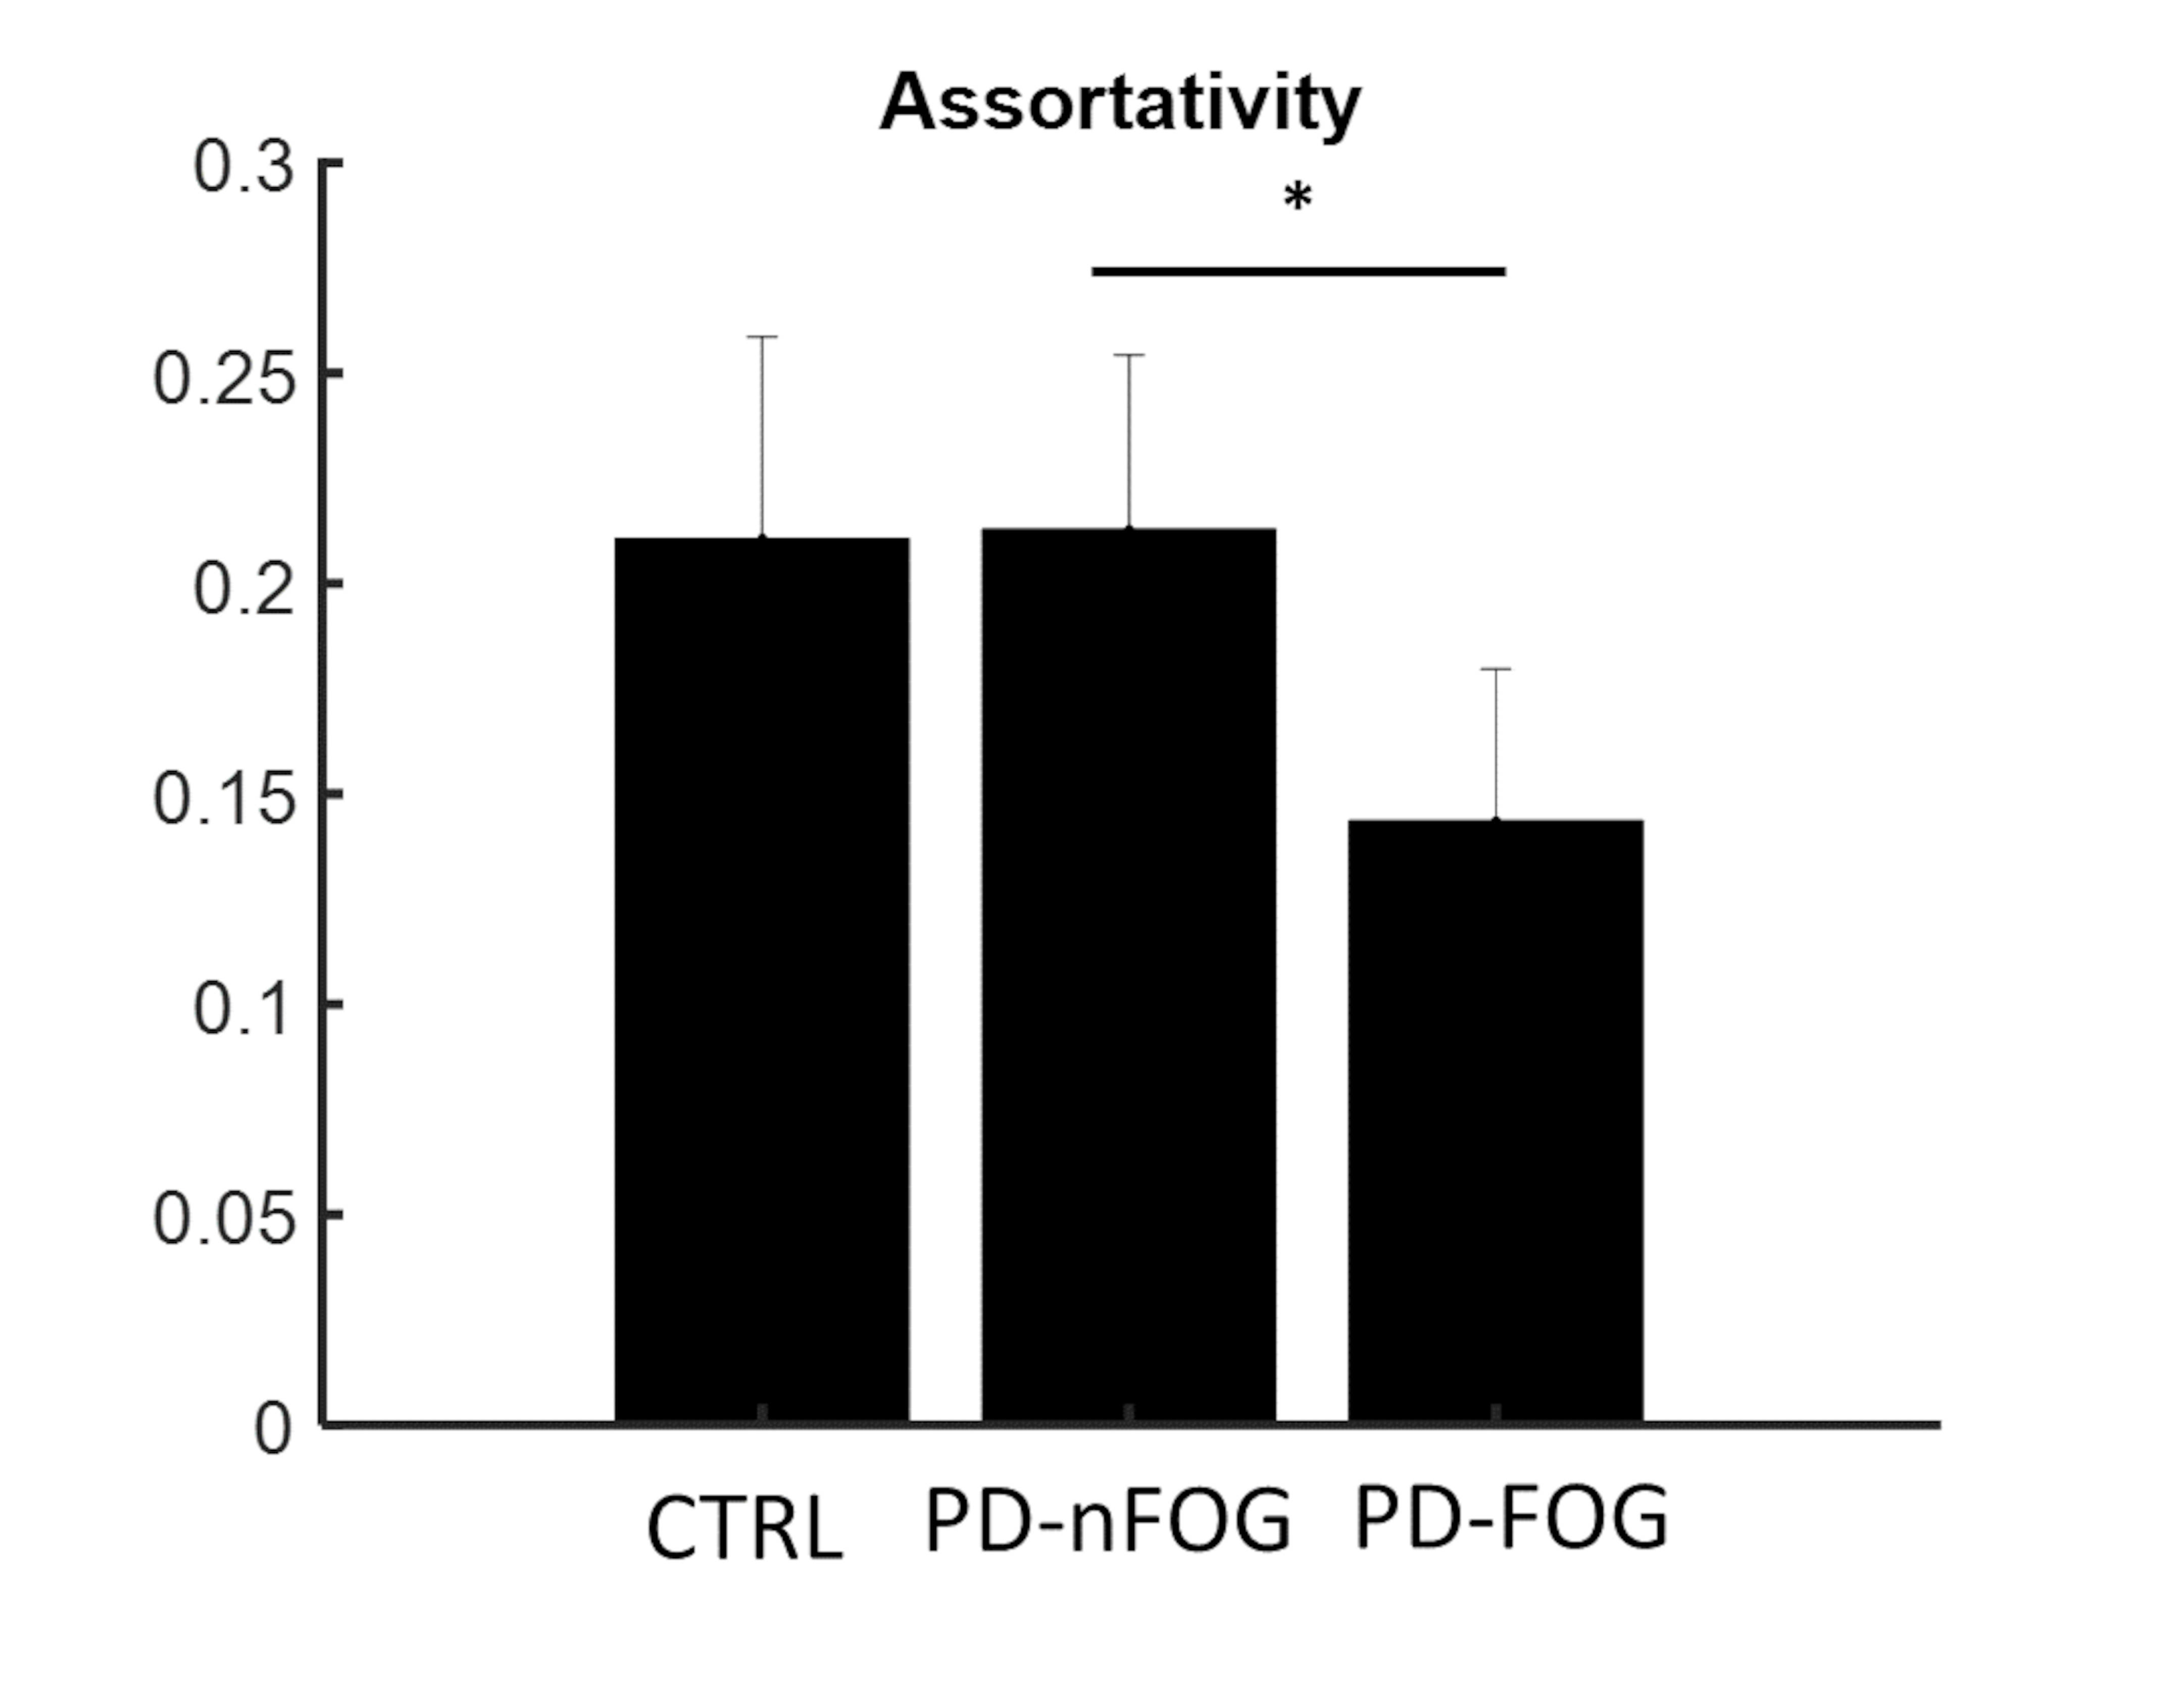
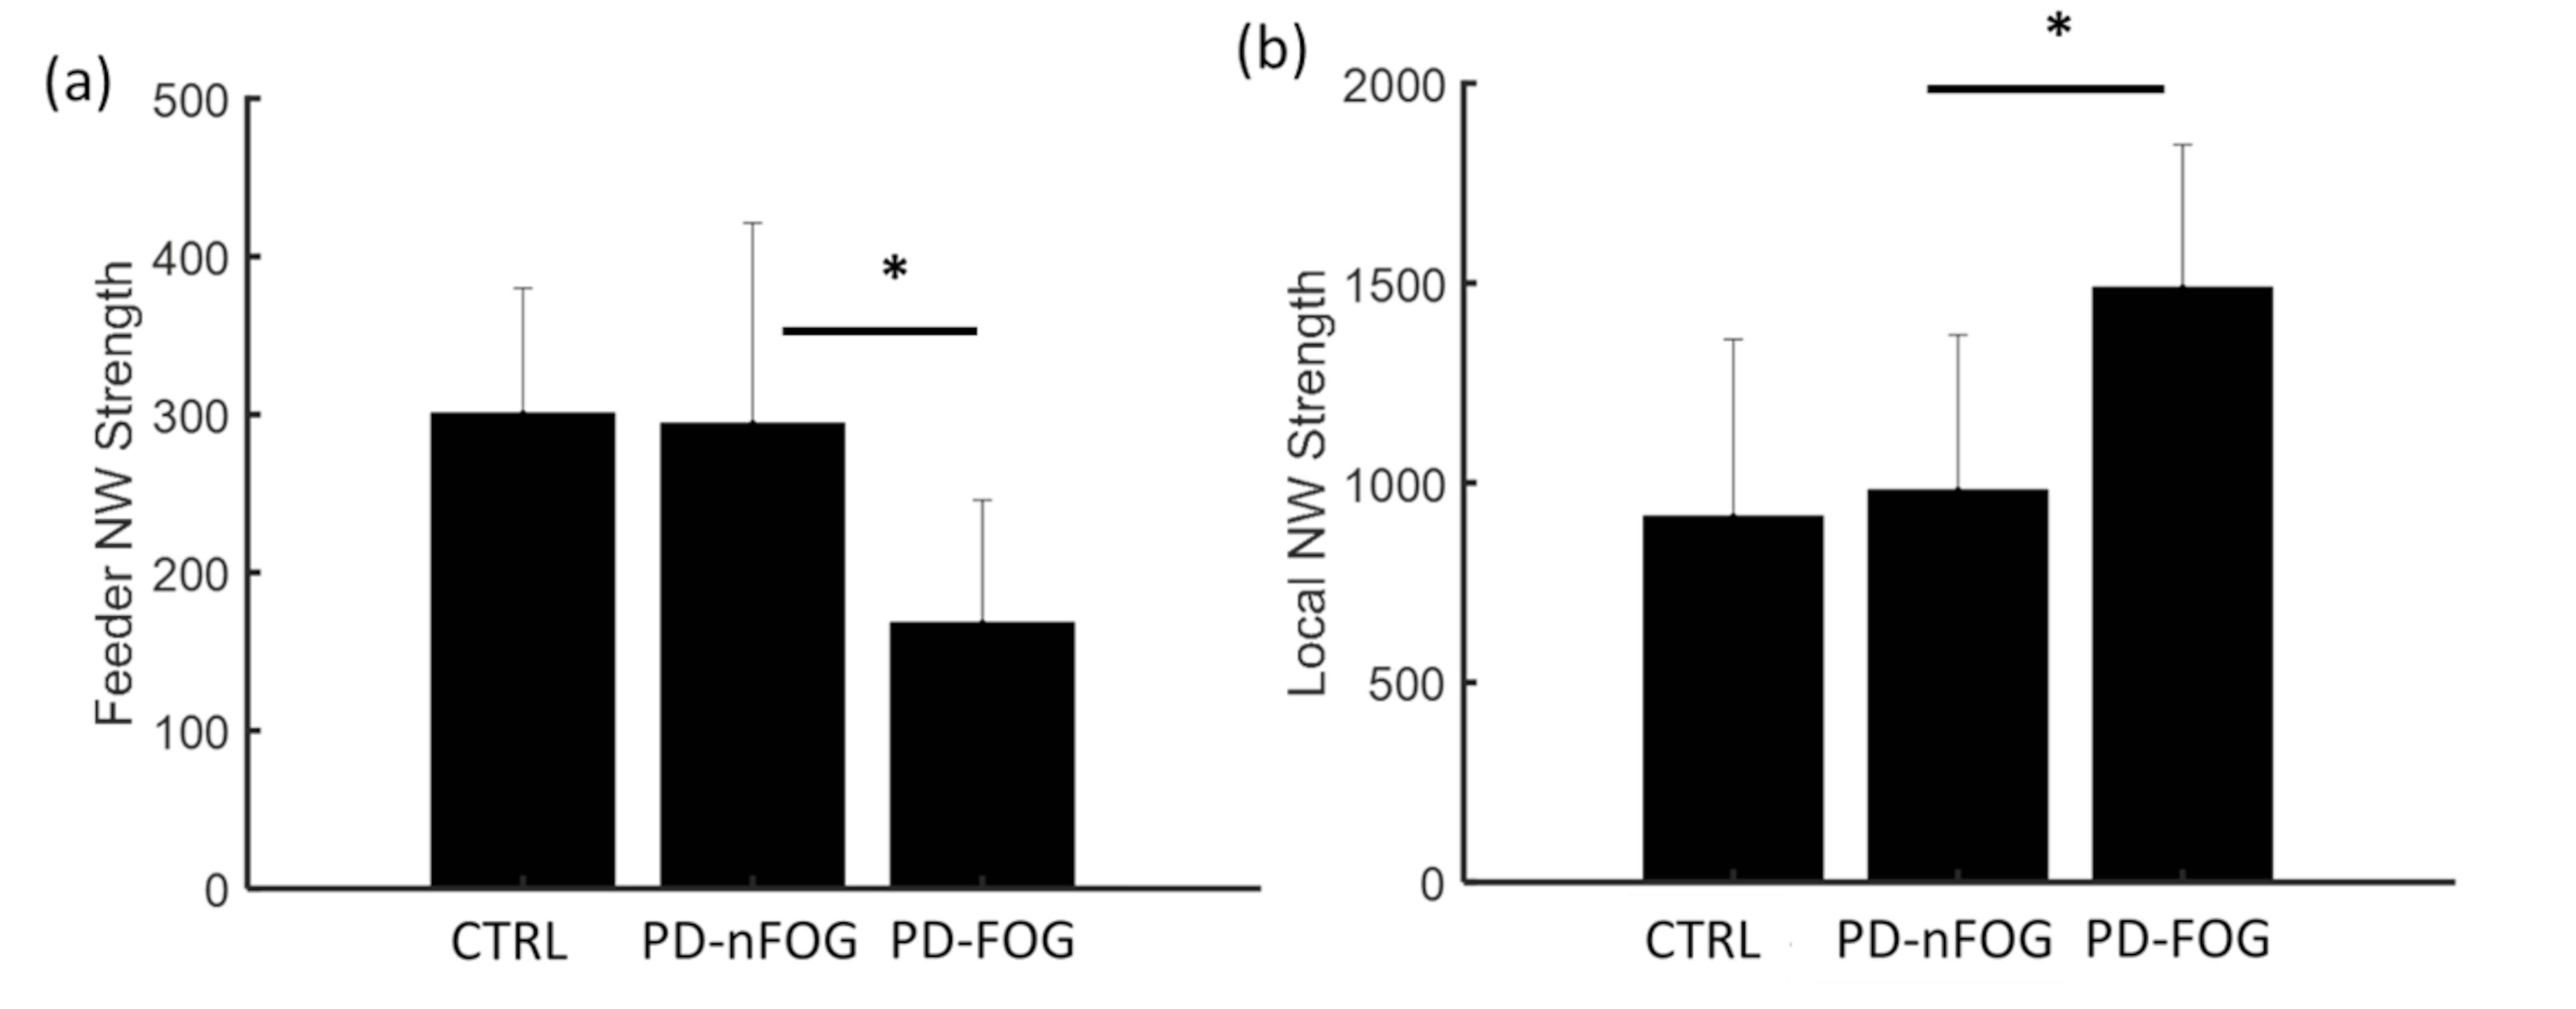
Participants with PD-FOG showed significantly reduced assortativity when compared to the PD-nFOG group (Fig. 1). None of the other global measures showed statistically significant differences. When compared to the HCs, both PD-FOG and PD-nFOG participants exhibited a significant reorganization of functional hubs as evaluated through the hub disruption index (Fig. 2). The group average hub disruption index showed a significant negative slope for the NC v/s PD-FOG (Fig. 2a) and PD-nFOG v/s PD-FOG comparisons (Fig. 2c). The comparison between PD-nFOG and the NCs did not show significant differences (Fig. 2 b). Significantly weaker feeder edge strength (Fig. 3a) was found in PD-FOG when compared to PD-nFOG participants. The PD-FOG participants had a significantly higher local edge strength compared to the PD-nFOG group (Fig. 3b). No other differences were observed between the groups. There were no statistically significant findings when assessing the relationship between functional network measures and disease duration, FOGQ score, or LEDD.Discussion
The key findings of this study were: 1) assortativity is significantly reduced in the PD-FOG group indicating altered connectivity between similar nodes (eg: hubs); 2) altered feeder network and local network measures in the PD-FOG group; and 3) significant reorganization of the functional hubs in the PD-FOG group when compared to PD-nFOG and NCs. The results of our study suggest that PD-FOG participants exhibit different pathophysiology compared to PD-nFOG and NC due to the substantial reorganization of regional brain hubs. In addition, there was a significant reduction in the rich-club connectivity strength in the PD-FOG participants suggestive of disruptions in the higher-order functional network topology. However, none of the topological changes showed any associations with clinical variables of FOG suggesting that the brain topological reorganizations within participants with PD-FOG are highly heterogeneous. Hence, future studies with larger sample sizes are needed to gain a further understanding of the relationship between these alterations and the clinical measures.Acknowledgements
This study is supported by the National Institutes of Health (grant 1R01EB014284, R01NS117547, P20GM109025, and P20AG068053), a private grant from the Peter and Angela Dal Pezzo funds, a private grant from Lynn and William Weidner, a private grant from Stacie and Chuck Matthewson and the Keep Memory Alive-Young Investigator Award (Keep Memory Alive Foundation).References
[1] Bharti, K., Suppa, A., Tommasin, S., Zampogna, A., Pietracupa, S., Berardelli, A., Pantano, P., 2019. Neuroimaging advances in Parkinson’s disease with freezing of gait: A systematic review. NeuroImage Clin. 24, 102059. https://doi.org/10.1016/j.nicl.2019.102059
[2] Maidan, I., Jacob, Y., Giladi, N., Hausdorff, J.M., Mirelman, A., 2019. Altered organization of the dorsal attention network is associated with freezing of gait in Parkinson’s disease. Park. Relat. Disord. 63, 77–82. https://doi.org/10.1016/j.parkreldis.2019.02.036
[3] Ruan, X., Li, Y., Li, E., Xie, F., Zhang, G., Luo, Z., Du, Y., Jiang, X., Li, M., Wei, X., 2020. Impaired Topographical Organization of Functional Brain Networks in Parkinson’s Disease Patients With Freezing of Gait. Front. Aging Neurosci. 12, 337. https://doi.org/10.3389/fnagi.2020.580564
[4] Ziegler, K., Schroeteler, F., Ceballos-Baumann, A.O., Fietzek, U.M., 2010. A new rating instrument to assess festination and freezing gait in Parkinsonian patients. Mov. Disord. 25, 1012–1018. https://doi.org/10.1002/mds.22993
[5] Fan L, Li H, Zhuo J, Zhang Y, Wang J, Chen L, Yang Z, Chu C, Xie S, Laird AR, Fox PT, Eickhoff SB, Yu C, Jiang T. The Human Brainnetome Atlas: A New Brain Atlas Based on Connectional Architecture. Cereb Cortex. 2016 Aug;26(8):3508-26. doi: 10.1093/cercor/bhw157. Epub 2016 May 26. PMID: 27230218; PMCID: PMC4961028.
[6] Wang, J., Wang, X., Xia, M., Liao, X., Evans, A., He, Y., 2015. GRETNA: A graph theoretical network analysis toolbox for imaging connectomics. Front. Hum. Neurosci. 9, 386.
[7] Achard, S., Delon-Martin, C., Vértes, P.E., Renard, F., Schenck, M., Schneider, F., Heinrich, C., Kremer, S., Bullmore, E.T., 2012. Hubs of brain functional networks are radically reorganized in comatose patients. Proc. Natl. Acad. Sci. U. S. A. 109, 20608–20613. https://doi.org/10.1073/pnas.1208933109
[8] Winkler AM, Ridgway GR, Webster MA, Smith SM, Nichols TE. Permutation inference for the general linear model. Neuroimage 2014; 92: 381–397.
Figures