2845
Altered response of the functional network during pain stimulus in small fiber neuropathy1Department of Radiology & Nuclear Medicine, School for Mental Health and Neuroscience, Maastricht University Medical Center, Maastricht, Netherlands, 2Department of Neurology, Maastricht University Medical Center, Maastricht, Netherlands, 3Boston Children's Hospital, Boston, MA, United States, 4School for Mental Health & Neuroscience, Maastricht University Medical Center, Maastricht, Netherlands
Synopsis
Keywords: Brain Connectivity, fMRI (task based), Chornic pain
Small fiber neuropathy (SFN) is a neuropathic disorder that is associated with chronic pain, which may have an effect on the functional organization of the brain network. Here, we study the effect of pain on the functional network by applying a painful stimulus block-design during an fMRI acquisition. We show global changes in the functional network for patient with idiopathic and genetic SFN compared to controls. Moreover, self-reported pain scores correlated with nodal importance of the somatosensory cortex (postcentral gyrus) in the pain-evoked cerebral functional network, indicating that the functional network takes an important role in the perception of pain.Introduction
Small fiber neuropathy (SFN) is a neuropathic disorder associated with chronic pain [1]. Around 5% of SFN patients harbour a mutation in SCN9A, the gene encoding for voltage-gated sodium channel Nav1.7, which is essential in generating and conducting action potentials in the physiological pain pathway [2]. Chronic pain may affect the functional organization of the brain network and, moreover, the SCN9A-associated SFN (SCN9A-SFN) may lead to specific pain-associated patterns. Little is known on the neuronal correlates of pain perception in SFN, and therefore, this study aims to investigate the functional brain network during a painful stimulus in idiopathic SFN (iSFN), SCN9A-SFN patients and healthy controls (HCs).Methods
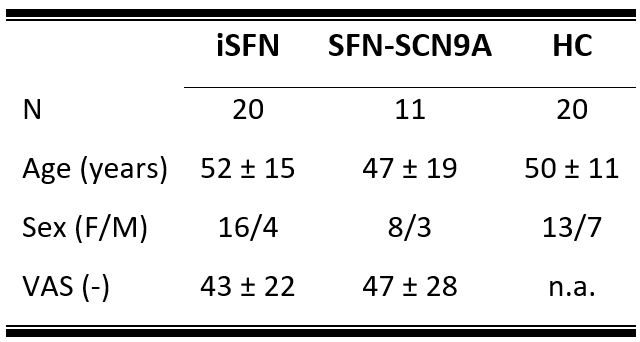
Study populationThree diagnostic subject groups comprising eleven SFN-SCN9A patients, twenty iSFN patients, and twenty HCs were included (table 1).
Image acquisition
All subjects underwent 3T-MRI (Philips Achieva, Best, the Netherlands) using a 32-element phased-array coil. For anatomical reference, 3D T1-weighted images (TR/TE=9.7/4ms; flip angle=12°; matrix=256x256; voxel size=1mm3) were acquired. Next, a gradient-echo echo-planar imaging (EPI) fMRI scan (38 transverse 5-mm thick slices; matrix=64x64; voxel size=3.5x3.5mm; TR/TE=2000/30ms, flip angle=90°, 195 volumes) was acquired during which seven 12-second heat stimuli (subject-specific temperature threshold, ranging from 44 to 50°C) were given alternated with 36-seconds periods of rest. An fMRI scan with the same parameters but using non-painful cold stimuli (15°C) was also acquired. Besides MRI, for the SFN patients, current self-reported pain was also collected using a visual analog scale (VAS) score.
Preprocessing
The structural images were automatically parcellated into 68 cortical and 14 sub-cortical regions using Freesurfer based on the Desikan-Killiany atlas [3]. The functional images were, slice-time corrected, aligned to the mean of the functional images, and band-pass filtered (0.01-0.1Hz). Next, to ensure steady-state longitudinal magnetization the first 5 dynamics were discarded. To cope with EPI distortions, the T1w images and corresponding Freesurfer atlas were non-linearly co-registered to the functional images.
Graph Analysis
The functional network was quantified using Pearson's correlation coefficients between all sets of regions, correcting for head motion parameters, and WM and CSF signals. Only positive and significant connections were considered. Furthermore, only networks with the same number of nodes and edges (i.e., the networks are equally sparse) were compared. Moreover, only the nodes, and edges in the network of at least half of the subjects were considered in the graph analysis (i.e., group thresholding) [4]. The number of edges in each network was varied such that they were 67-90% sparse, with intervals of 1%. The functional networks were quantitatively described by two of the most robust and widely applied global graph metrics, the characteristic path length (L/Lrand = λ) and clustering coefficient (C/Crand = γ), both normalized with respect to 100 random networks with similar degree distribution [5]. To study potential local differences in the pain-invoked functional networks, the betweenness centrality (BC) that evaluates nodal importance, was calculated [6]. The BC relates to how many times a node is included in the shortest path.
Statistics
Differences in the global graph measures between the three diagnostic groups and also between SFN patients and HCs were assessed using multivariable linear regression with age and sex added as covariates. These analyses were repeated for the cold-stimulus dataset. Potential differences of the BC between the hot and cold stimuli were evaluated for four predefined regions known to be involved in pain processing (postcentral gyrus, insular cortex, anterior cingulate cortex, and thalamus [7]) using the nonparametric Wilcoxon rank-sum test. Subsequently, a nonparametric Spearman's correlation was used to investigate whether the BC of these regions relates to VAS scores.
Results
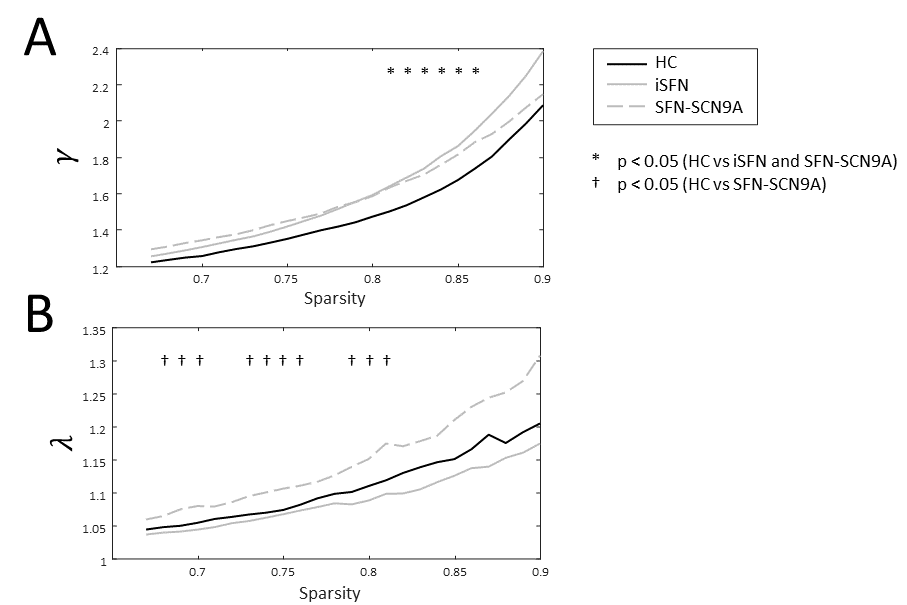
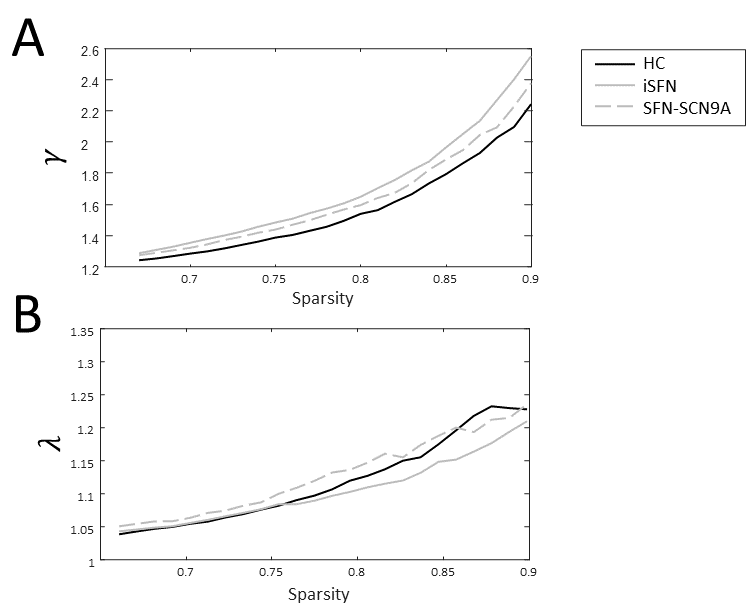
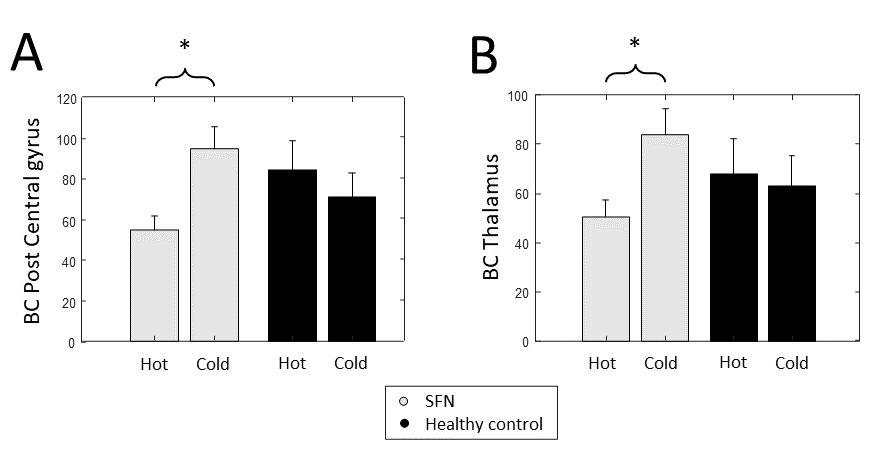
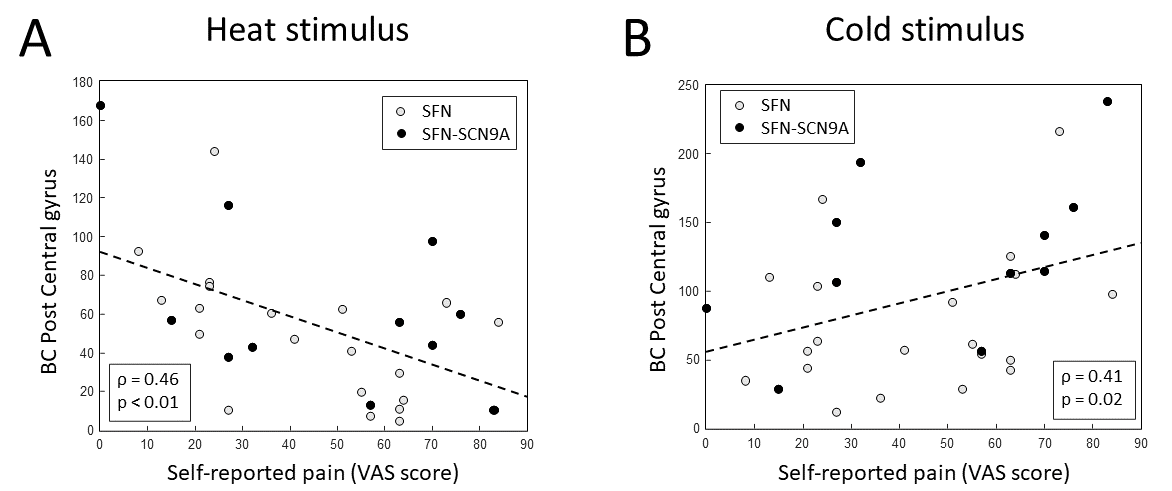
The γ is significantly higher in patients with SFN compared to HCs in the sparsity range 81-87% (Figure 1A). The λ of the combined SFN group did not differ from HCs. However, the SFN-SCN9A group had an increased λ compared to HCs for sparsity levels 68-70%, 73-76% and 79-81% (Figure 1B). Similar patterns for γ and λ were observed, although not significant (Figure 2). For the combined SFN group, the BC of the postcentral gyrus and thalamus are significantly lower during the painful heat stimulus than during the non-painful cold stimulation (Figure 3). This is not observed in the control group. A significant negative correlation was found between the BC of the postcentral gyrus and the VAS score for the heat-stimulated network (Figure 4A), while a significant positive correlation was reported for the cold-stimulated network (Figure 4B).Discussion & Conclusion
We showed functional cerebral network differences between SFN patients and HCs and also phenotypical differences between idiopathic and SFN-SCN9A patients. Self-reported pain scores correlated with nodal importance of the somatosensory cortex (postcentral gyrus) in the cerebral network for both heat and cold stimulation. The non-painful cold stimulus showed no significant differences between SFN groups and HC, indicating that our results are not driven by only sensory input. Interestingly, a recent study showed that the functional brain network of subjects without pain disorders exhibits less segregation and more integration during a painful stimulus [8]. Therefore, combined with our results, this indicates that cerebral networks play an essential role in the perception of pain, and neuronal correlates were revealed in terms of increased segregation and decreased integration in patients with chronic pain.Acknowledgements
No acknowledgement found.References
[1] Devigili G, Rinaldo S, Lombardi R, et al. Diagnostic criteria for small fibre neuropathy in clinical practice and research. Brain 2019;142:3728–3736 doi: 10.1093/brain/awz333.
[2] Eijkenboom I, Sopacua M, Hoeijmakers JGJ, et al. Yield of peripheral sodium channels gene screening in pure small fibre neuropathy. J. Neurol. Neurosurg. Psychiatry 2019;90:342–352 doi: 10.1136/jnnp-2018-319042.
[3] Desikan RS, Ségonne F, Fischl B, et al. An automated labeling system for subdividing the human cerebral cortex on MRI scans into gyral based regions of interest. Neuroimage 2006;31:968–980 doi: 10.1016/j.neuroimage.2006.01.021.
[4] Reus MA De, Heuvel MP Van Den. Estimating false positives and negatives in brain networks. Neuroimage 2013;70:402–409 doi: 10.1016/j.neuroimage.2012.12.066.
[5] Drenthen GS, Fasen F, Fonseca Wald ELA, et al. Functional brain network characteristics are associated with epilepsy severity in childhood absence epilepsy. NeuroImage Clin. 2020;27:102264 doi: 10.1016/j.nicl.2020.102264.
[6] Drenthen GS, Backes WH, Rouhl RPW, et al. Structural covariance networks relate to the severity of epilepsy with focal-onset seizures. NeuroImage Clin. 2018 doi: 10.1016/j.nicl.2018.09.023.
[7] Witting N, Kupers RC, Svensson P, Jensen TS. A PET activation study of brush-evoked allodynia in patients with nerve injury pain. Pain 2006;120:145–154 doi: 10.1016/j.pain.2005.10.034.
[8] Kastrati G, Thompson WH, Schiffler B, Fransson P, Jensen KB. Brain network segregation and integration during painful thermal stimulation. Cereb. Cortex 2022;32:4039–4049 doi: 10.1093/cercor/bhab464.
Figures