2842
White Matter Myelin Content and Motor Function in Radiologically Isolated Syndrome and Multiple Sclerosis1Radiology, University of British Columbia, Vancouver, BC, Canada, 2Medicine, University of British Columbia, Vancouver, BC, Canada, 3Neuroscience, University of British Columbia, Vancouver, BC, Canada, 4Medicine, University of Toronto, Toronto, ON, Canada, 5Physics and Astronomy, University of British Columbia, Vancouver, BC, Canada
Synopsis
Keywords: Multiple Sclerosis, Relaxometry, radiologically isolated syndrome, normal-appearing, myelin water fraction, myelin heterogeneity index white matter, motor function
Regional myelin water fraction (MWF) in radiologically isolated syndrome (RIS) white matter were compared to relapsing-remitting (RR) and primary-progressive (PP) multiple sclerosis (MS). Results showed myelin damage in some white matter regions of RIS. Early myelin damage in RIS may be associated with subclinical ambulatory dysfunction. Manual dexterity correlated with myelin content in the cortical spinal tract and corpus callosum in PPMS whereas it correlated with myelin heterogeneity in RRMS. These findings suggest that myelin changes in critical white matter tracts have differing impact in gross and fine motor function in RIS and MS subtypes.Introduction
Radiologically Isolated Syndrome (RIS) is defined by white matter lesions characteristic of multiple sclerosis (MS) on magnetic resonance imaging (MRI) in the absence of clinical symptoms1. Existing studies have shown that brain volume is lower in RIS vs healthy controls (HCs) and that high lesion volume is associated with poor cognitive performance2,3. However, few studies have evaluated myelin content in RIS. Myelin water imaging (MWI) is a pathologically validated advanced magnetic resonance technique for the visualization and quantification of myelin in vivo4. Myelin water fraction (MWF), which quantifies myelin water signal and histologically correlates with myelin content5, can be characterised within a region of interest (ROI) with the mean, standard deviation (SD), and myelin heterogeneity index (MHI = SD / mean). Previous studies have shown that people living with MS have a lower mean MWF and higher MHI than HCs, with progressive forms of MS being the most abnormal6.Objective
1) To compare regional myelin changes in white matter of RIS compared to MS subtypes and HCs. 2) To evaluate the correlation between regional myelin changes and motor function performance in RIS, relapsing-remitting MS (RRMS) and primary-progressive MS (PPMS).Methods
Subjects and MR Experiments: Twenty-eight participants with RIS (mean age: 45 years, 23 females), 116 participants with RRMS (mean age: 36 years, 84 females), 27 participants with PPMS (mean age: 52 years, 12 females) and 21 HCs (mean age: 43 years, 14 females) were recruited. Scanning on Philips Elition 3T (Best, The Netherlands) scanners at two sites both included a 48 echo GRASE T2 relaxation sequence7 (TE=8ms, TR=1073ms, FOV=230x192x100mm3, acquired voxel size=1x2x5mm3, reconstructed voxel size=1x1x2.5mm3) and a 3DT1 sequence (TE=3.72ms, TR=3000ms, FOV=240x240x184mm3, voxel size=1x1x1mm3). Each participant also completed a Timed 25ft Walk (T25FW) for ambulatory function and the 9 Hole Peg Test (9HPT) for manual dexterity.Data Analysis: Voxel-wise T2 distributions were calculated using non-negative least squares8,9. MWF was the fraction of signal with T2<40ms. The 3DT1 images were registered to the 1st echo of the GRASE sequence10. Normal-appearing white matter (NAWM) masks were created using FAST11 on the registered 3DT1. Three regions of interest (ROIs), the corticospinal tract (CST), corpus callosum (CC) and superior longitudinal fasciculus (SLF), were extracted from the JHU atlas and registered to GRASE. MWF mean and standard deviation (SD) and MHI were calculated for the NAWM mask and ROIs.
Statistics: Measures from each subtype were compared using a Kruskal Wallis and Wilcoxon Rank Sum test with Bonferroni-Holms correction. Correlations between MWI metrics of each ROI and the clinical measures were evaluated using Spearman correlation (ρ).
Results
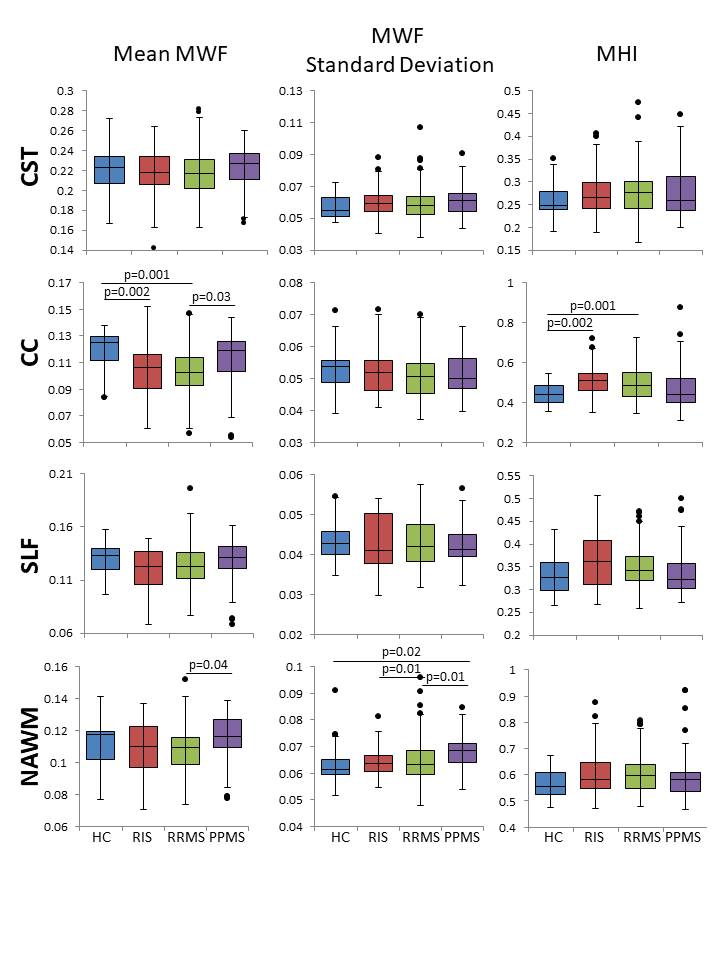
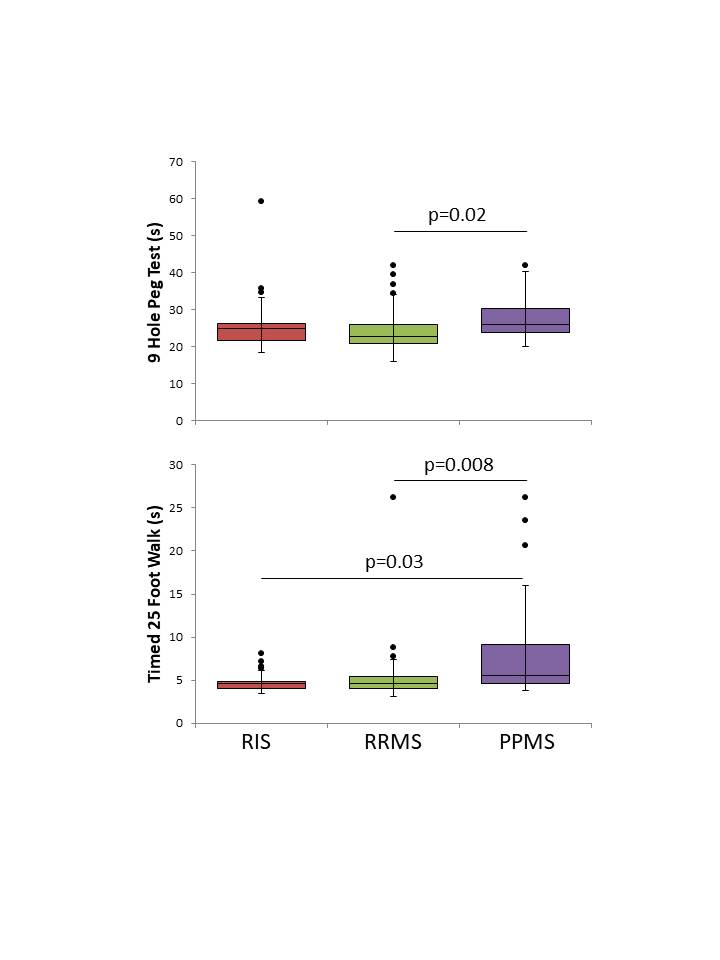
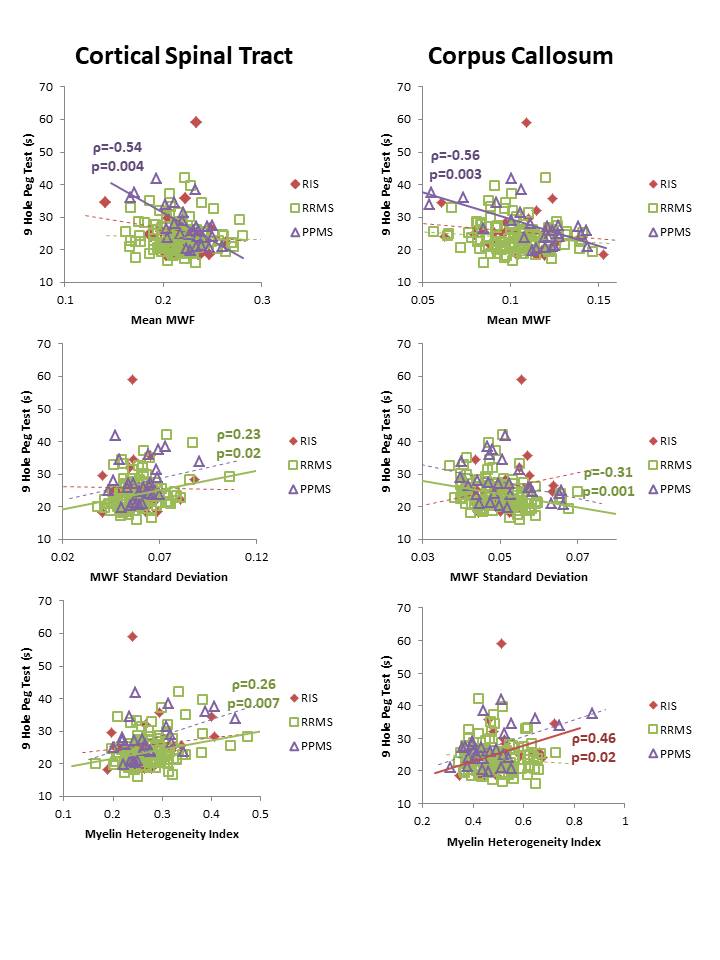
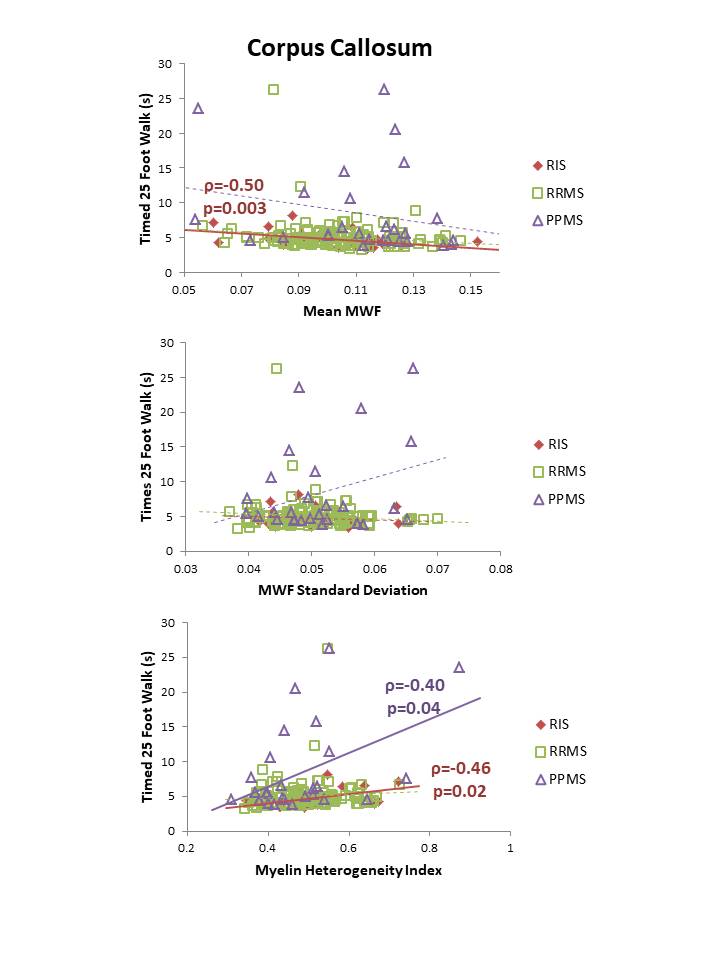
MWI metrics in RIS were similar to HC except for a decrease in mean MWF (0.11 vs 0.12, p=0.002) and increase in MHI (0.51 vs 0.44, p=0.002) within the CC (Figure 1). No differences between MWI metrics were found between RIS and HC for CST or SLF. Compared to MS, RIS had a larger standard deviation in NAWM MWF compared to RRMS (0.063 vs 0.064, p=0.01) (Figure 1).Performance on the T25FW was better for RIS than PPMS (4.8s vs 8.4s, p=0.03) (Figure 2). Significant correlations between the mean MWF in CST and CC, and the 9HPT were found in PPMS (Figure 3). RIS was the only group to have a significant correlation between the T25FW and mean MWF, in this case for the CC (Figure 4). Significant correlations between MWF standard deviation and 9HPT were found for RRMS in the CST and CC (Figure 3). No correlations were found between the clinical measures and MWI metrics from the SLF.
Discussion
MWI reveals diffuse myelin damage in the normal-appearing white matter across the spectrum of MS. Decreased mean MWF and increased heterogeneity was detected in the CC of RIS (as well as RRMS) before evident in other regions such as the CST and SLF. These changes might reflect selective vulnerability of CC white matter in early stages of MS. Alternatively, it might reflect differences in regional sensitivity of this technique. As expected, for several measures, PPMS had more significant damage than RIS and RRMS. Early myelin damage in RIS may be associated with motor performance as seen with increasing CC heterogeneity with slower performance on the 9HPT and with T25FW times increasing with decreased CC mean MWF and increased CC myelin heterogeneity. Manual dexterity correlated with MWF in the CST and CC in PPMS whereas it correlated with myelin heterogeneity in RRMS. Earlier in the disease course (such as RIS or RRMS), focal or patchy demyelination may be the mechanism for disability and in later stages (during PPMS), diffuse demyelination could be the main driver of disability. These findings suggest that myelin changes in these critical white matter tracts have differing impact in gross and fine motor function in different subtypes of MS.Conclusion
In radiologically isolated syndrome (RIS), myelin water imaging detects myelin damage within the corpus callosum that is similar in extent to what is seen in relapsing-remitting MS. Corpus callosum MWF is also related to motor function in RIS. Longitudinal evaluation of MWI metrics may inform the prognostication of motor function in MS and provide early insight into the mechanisms of progression in MS.Acknowledgements
We would like to thank the MS volunteers and the staff at the UBC MRI Research Centre and UBC MS Clinic. This study was funded by the Multiple Sclerosis Society of Canada, Biogen, the Government of Alberta, Brain Canada, and Roche. This work was conducted on the traditional, ancestral, and unceded territories of Coast Salish Peoples, including the territories of the xwməθkwəy̓əm (Musqueam), Skwxwú7mesh (Squamish), Stó:lō and Səl̓ílwətaʔ/Selilwitulh (Tsleil- Waututh) Nations.References
1. Okuda DT, Mowry EM, Beheshtian A, et al. Incidental MRI anomalies suggestive of multiple sclerosis: the radiologically isolated syndrome. Neurology 2009;72:800–05.
2. George IC, El Mendili MM, Inglese M, et al. Cerebellar volume loss in radiologically isolated syndrome. Mult Scler 2021; 27(1):130-133.
3. Amato MP, Hakiki B, Goretti B, et al. Association of MRI metrics and cognitive impairment in radiologically isolated syndromes. Neurology 2012;78(5):309-14.
4. MacKay A, Whittall K, Adler J, et al. In vivo visualization of myelin water in brain by magnetic resonance. Magn Reson Med. 1994; 31(6): 673-677.
5. Laule C, Kozlowski P, Leung E, et al. Myelin water imaging of multiple sclerosis at 7 T: correlations with histopathology. Neuroimage. 2008; 40(4): 1575-1580.
6. Johnson P, Vavasour IM, Abel S, et al. Beyond the Mean: Myelin Heterogeneity Index as a Sensitive Metric for Assessing Myelin Damage in Multiple Sclerosis. ISMRM 2021: p.2816.
7. Zhang J, Vavasour I, Kolind S, et al. Advanced Myelin Water Imaging Techniques for Rapid Data Acquisition and Long T2 Component Measurements. ISMRM. 2015; p824.
8. Prasloski T, Mädler B, Xiang Q-S, et al. Applications of stimulated echo correction to multicomponent T2 analysis. Magn Reson Med. 2012; 67: 1803–1814.
9. Whittall KP and MacKay AL. Quantitative interpretation of NMR relaxation data. J Magn Reson. 1989; 84: 134–152.
10. Jenkinson M, Bannister PR, Brady JM, and Smith SM. Improved optimisation for the robust and accurate linear registration and motion correction of brain images. NeuroImage. 2002; 17(2):825-841.
11. Zhang Y, Brady M, Smith S. Segmentation of brain MR images through a hidden Markov random field model and the expectation-maximization algorithm. IEEE Trans Med Imag. 2001; 20(1):45-57.
Figures