2840
Assessment of multiple sclerosis pathology with quantitative magnetic resonance imaging1Department of Diagnostic and Interventional Neuroradiology, Klinikum rechts der Isar, Technical University of Munich, Munich, Germany, 2Department of Neurology, Klinikum rechts der Isar, Technical University of Munich, Munich, Germany, 3MR Clinical Science, Philips Healthcare, Mississauga, ON, Canada, 4Department of Radiology, University of British Columbia, Vancouver, BC, Canada, 5Philips Research Europe, Hamburg, Germany
Synopsis
Keywords: Multiple Sclerosis, Brain
Quantitative MRI in patients with multiple sclerosis (MS) allows for the objective identification of even subtle pathological changes in lesional, perilesional, NAGM, and NAWM tissue. Routine clinical scan protocols need to be tailored to the most diagnostically relevant MR biomarkers, however, to date only a few studies have investigated the particular diagnostic sensitivity of different MR biomarkers to different structural alterations of brain tissue affected by MS. Therefore, we studied 13 MS patients and 14 healthy controls using multiparametric, quantitative MR: we evaluated and compared the ability of nine different MR biomarkers to detect and characterize MS pathology.Purpose:
A variety of different structural alterations can be found in affected brain parenchyma of patients with multiple sclerosis (MS). While the presence of inflammatory lesions is the pathological hallmark of MS [1], the surrounding normal-appearing grey and white matter (NAGM, NAWM) are affected by complex microstructural alterations due to diffuse microglia activation and Wallerian degeneration [2]. Additionally, in the perilesion (PL) region, a narrow ring surrounding lesions, pathological changes reflecting myelin and axonal damage are present [3]. Although qualitative magnetic resonance imaging (MRI) is the major tool in the diagnostic work-up of MS patients [4], the detection of subtle changes within lesions and NAGM/NAWM remains challenging. Recent advances in the development of quantitative MRI, in particular with respect to acquisition time, facilitate the extraction of biomarkers in clinical studies [5]. Thereby, different quantitative MRI contrasts offer different, often complementary, insights into MS pathology. Although clinical routine scan protocols need to be particularly tailored to the most diagnostically significant MR biomarkers, to date only a few studies have evaluated how the different quantitative measures compare to each other regarding their ability to detect and describe MS pathology [6-9]. Therefore, we assessed nine different quantitative MR biomarkers in MS patients and healthy controls (HC) in a pilot study. We analyzed which biomarkers best separate NAGM/NAWM from HCGM/HCWM and which allow for an accurate differentiation between lesion, PL, and NAWM tissue, consequently representing the most promising candidates to be implemented in clinical scan protocols.Methods:
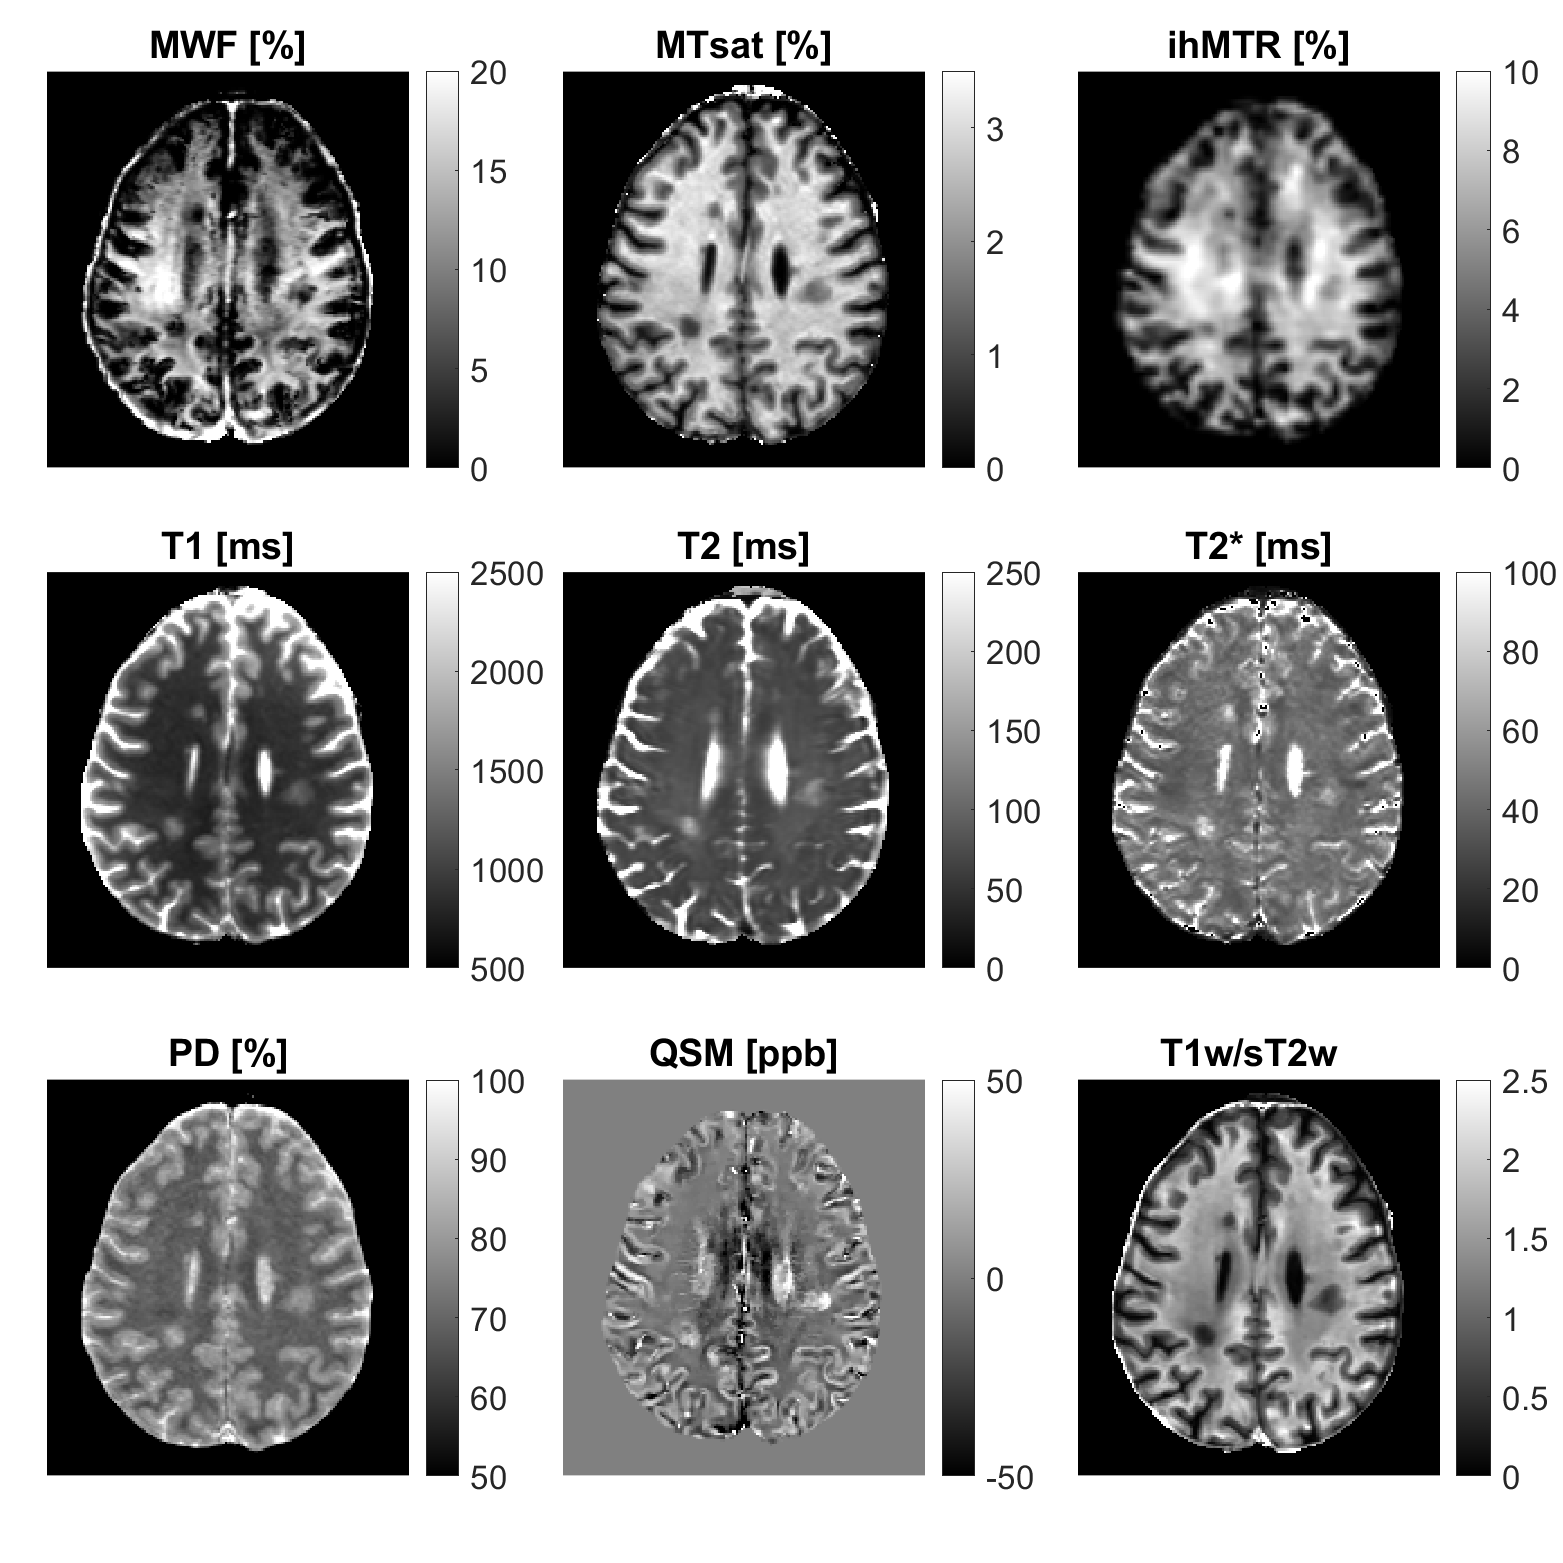
MRI measurements and postprocessing: Brain scans of 13 patients with MS and 14 age-matched HC were performed on a 3T system (Ingenia Elition X, Philips Healthcare). The scan protocol included a magnetization prepared rapid gradient echo (MPRAGE), which was used as T1w, a fluid-attenuated inversion recovery (FLAIR), and the following sequences for quantitative MR biomarker determination: 3D gradient and spin echo (GRASE) with 48 echoes for mapping of myelin water fraction (MWF) [10] and T2, and the 15th echo (TE = 120 ms) as T2w, 3D gradient echo with three echoes and ten magnetization transfer (MT)-pulses for calculating the inhomogeneous MT ratio (ihMTR) [11], three 3D multi-echo gradient echo data sets with T1-, proton density (PD)-, and MT-weighting, including B1-mapping, to calculate MT saturation (MTsat), T1, T2*, and PD using the hMRI toolbox [12], and a 3D gradient echo sequence with six echoes for quantitative susceptibility mapping (QSM) using the MEDI toolbox [13] (Figure 1).Volume of interest definition and MR biomarker extraction: In total, four different volumes of interest (VOIs) were defined in every study participant: NA/HCGM, NA/HCWM, lesion, and PL. Lesions were automatically segmented using a U-Net algorithm [14] resulting in n = 322 lesion segmentations. A two-voxel-wide shell of NAWM surrounding each lesion was defined as PL. Whole-brain GM and WM masks were derived from lesion-filled MPRAGE data using SPM12. Quantitative biomarker maps were co-registered to the participant’s MPRAGE data and mean values within each VOI were extracted. For each MS patient, an average lesion and PL value was calculated across all lesion segmentations.
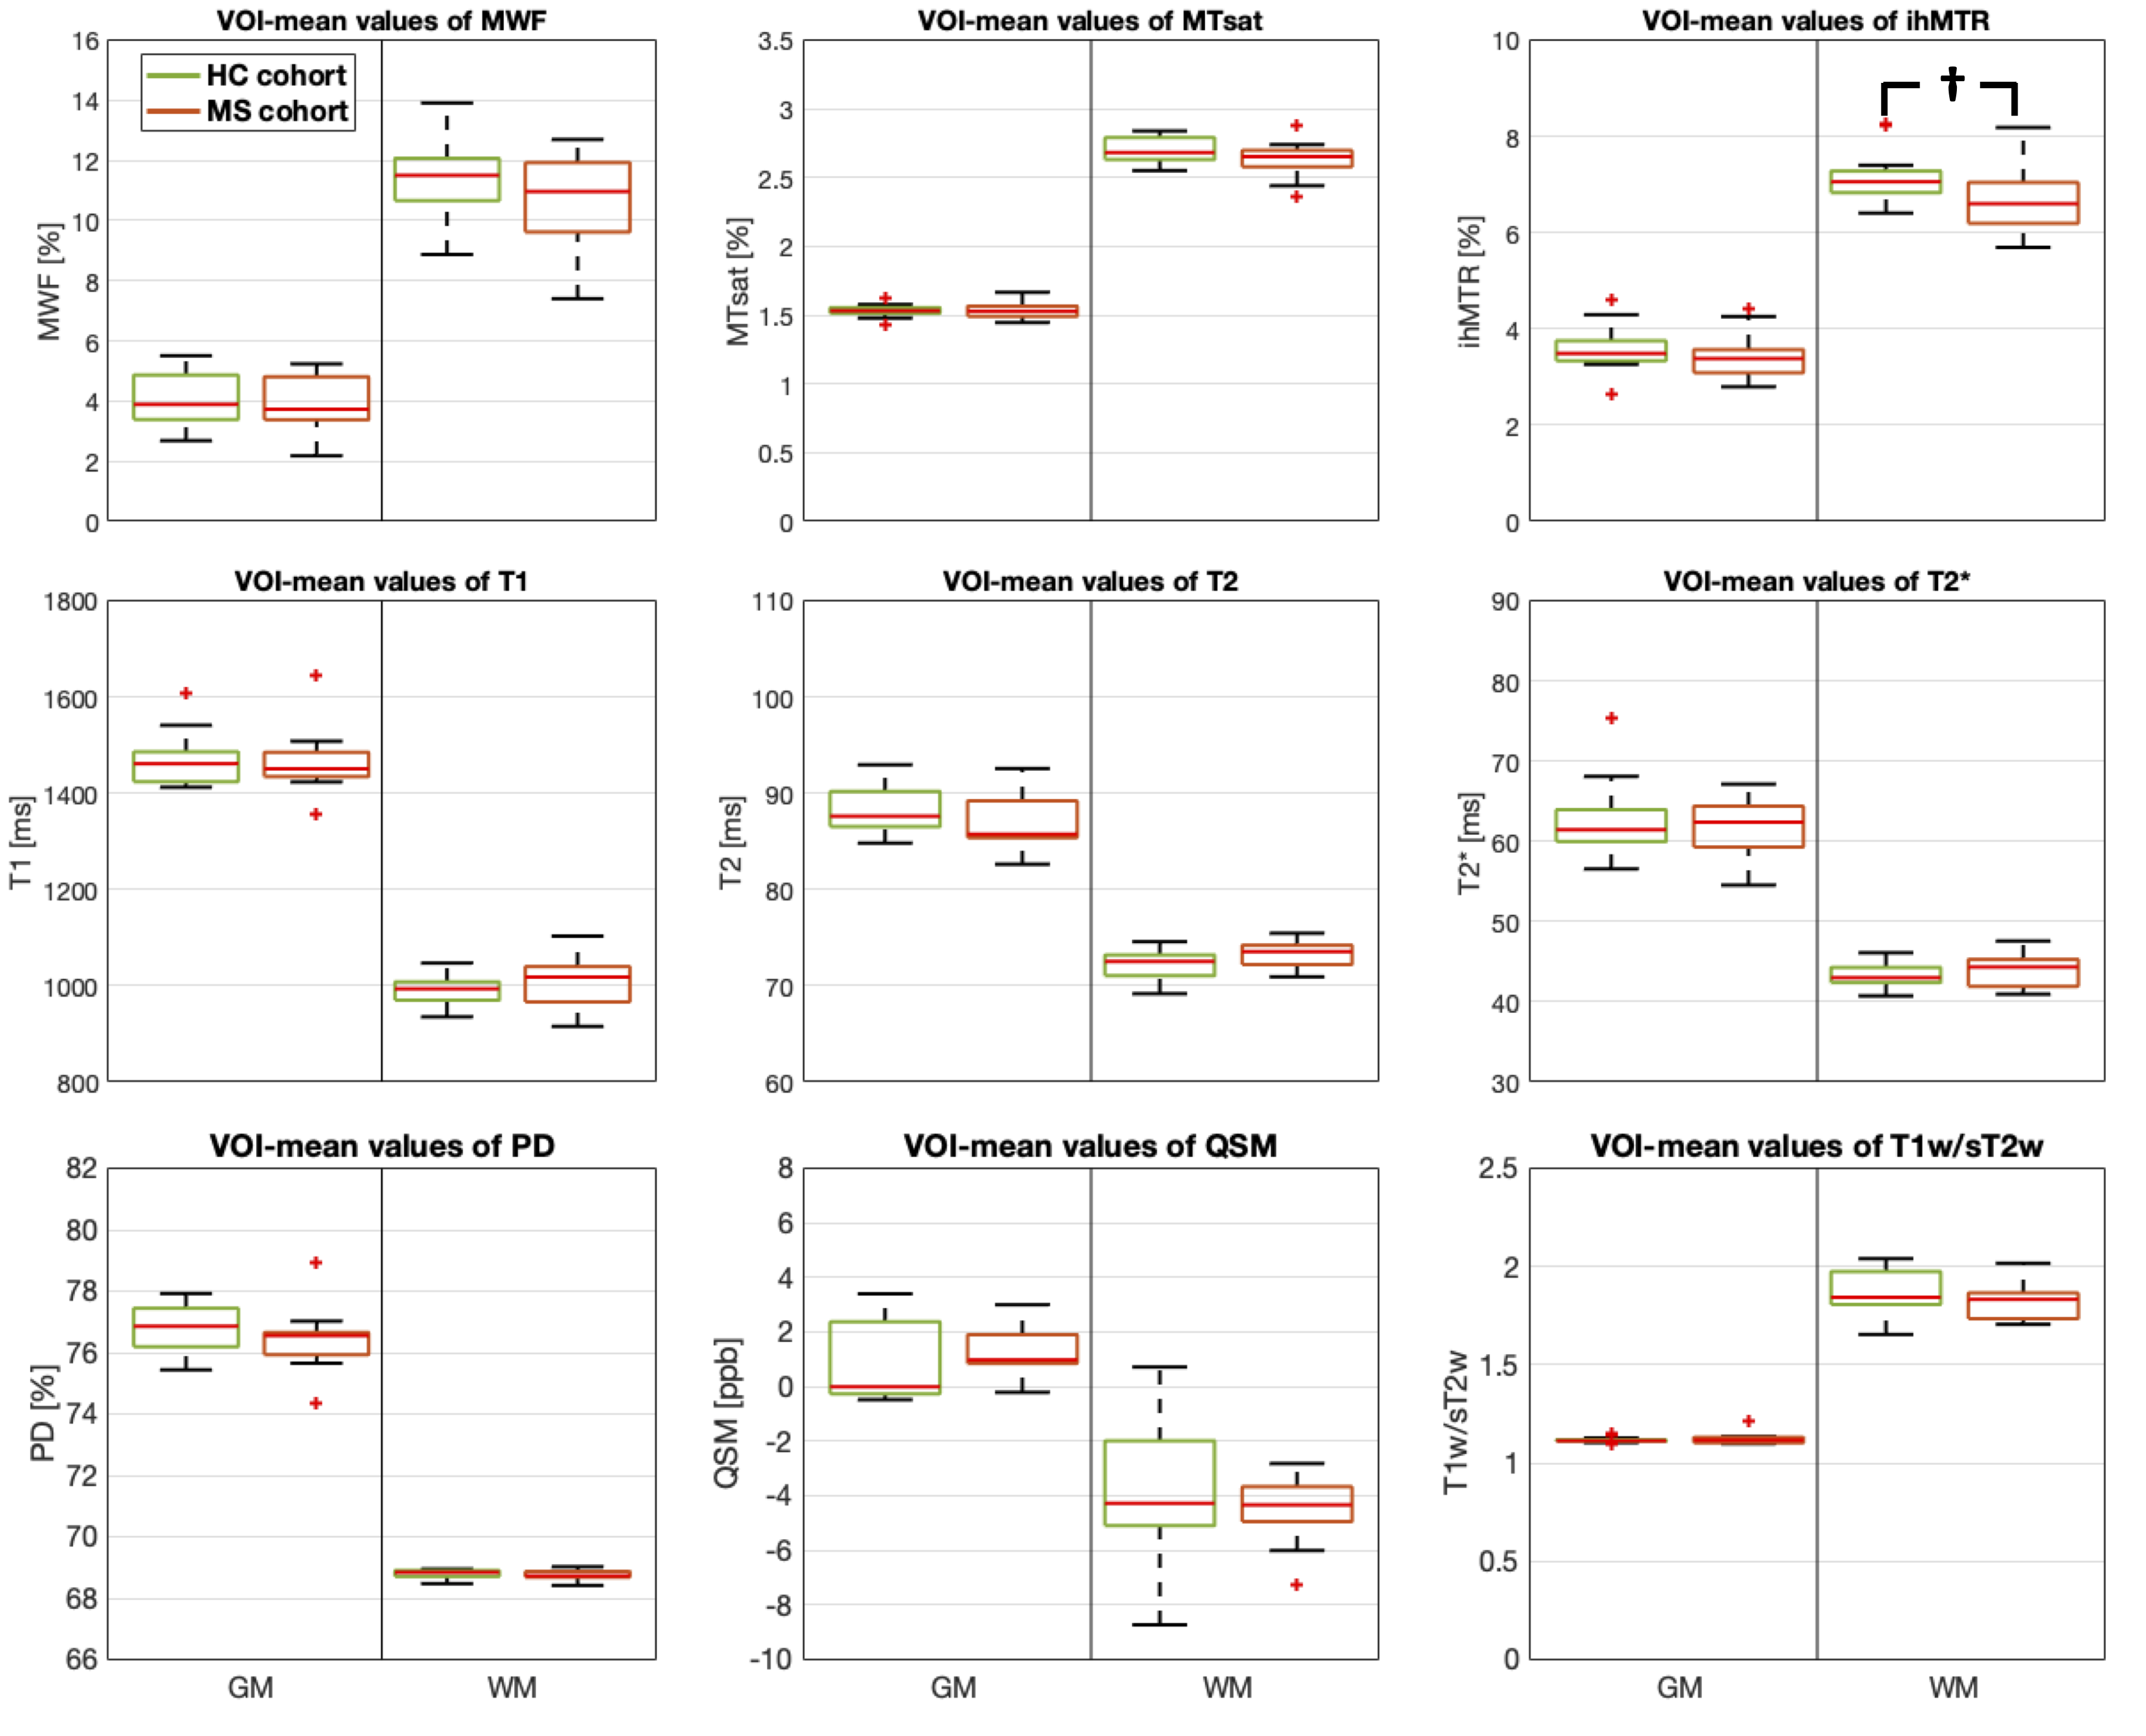
Statistical analysis: Biomarker values were compared using boxplots, in which each data point represented the mean value per participant in the respective VOI. To assess statistical significance, a Mann-Whitney U and a Wilcoxon signed-rank test were performed with a p-value of 0.05 as threshold.
Results:
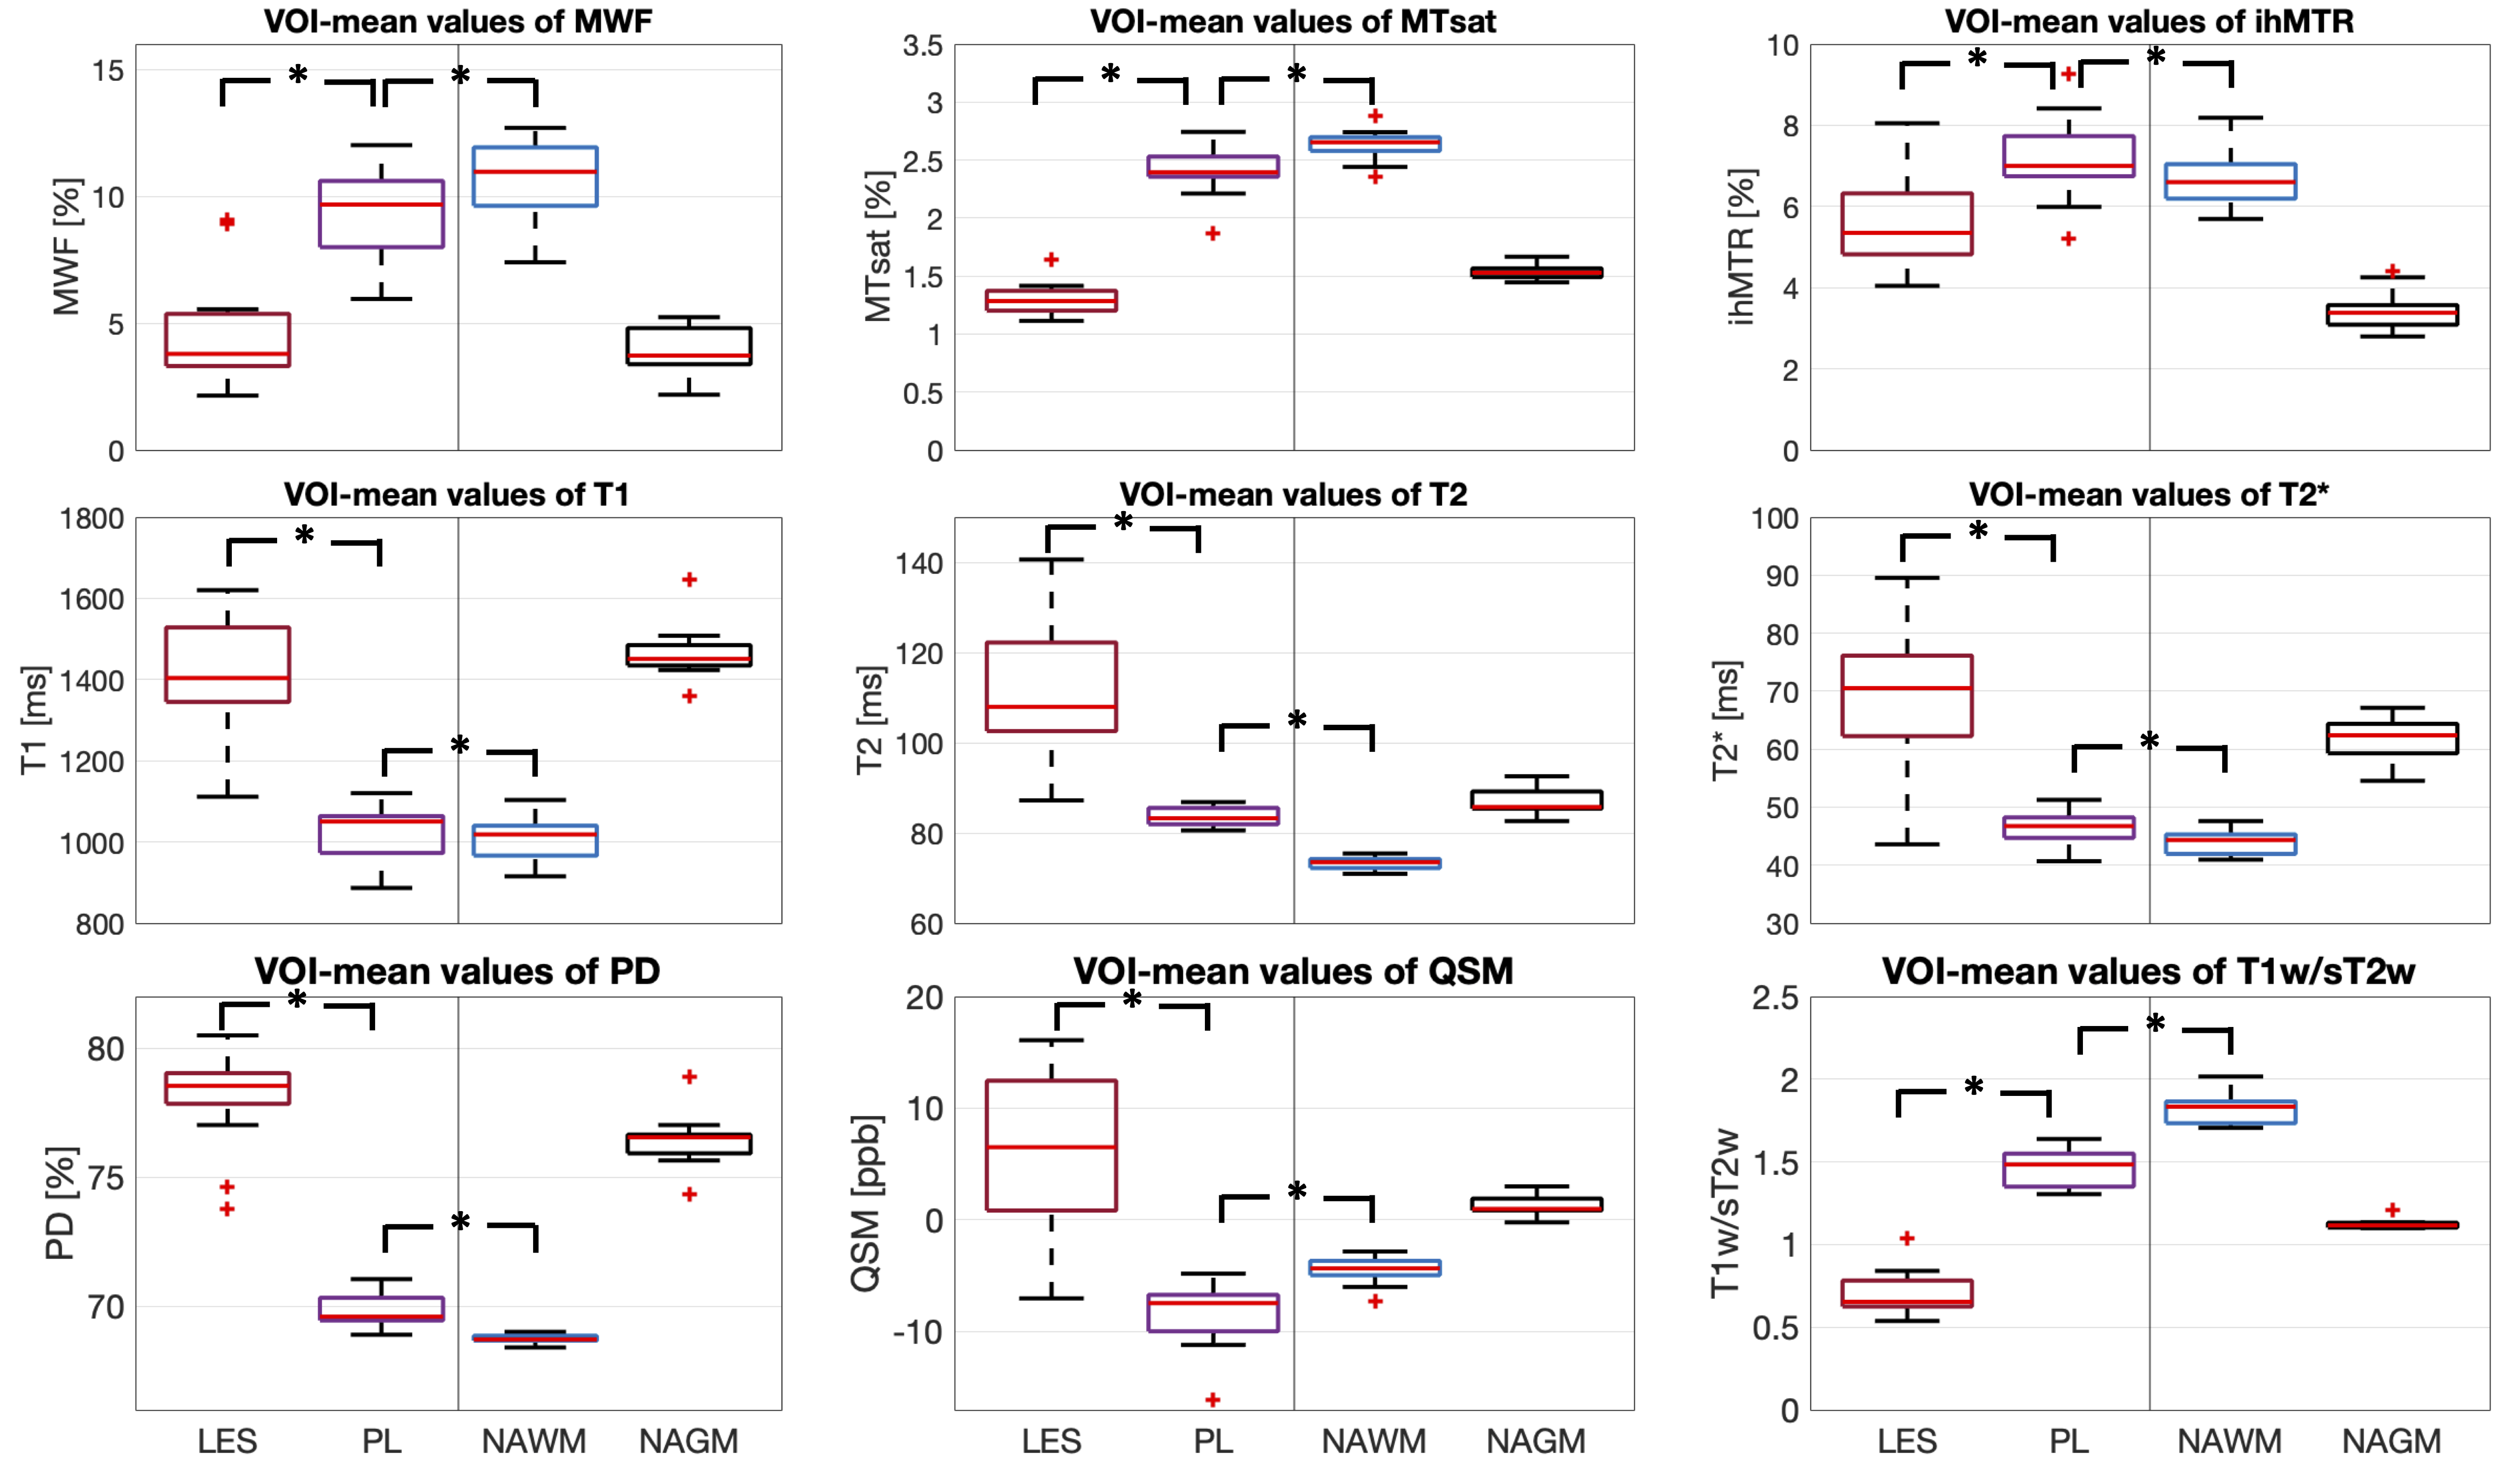
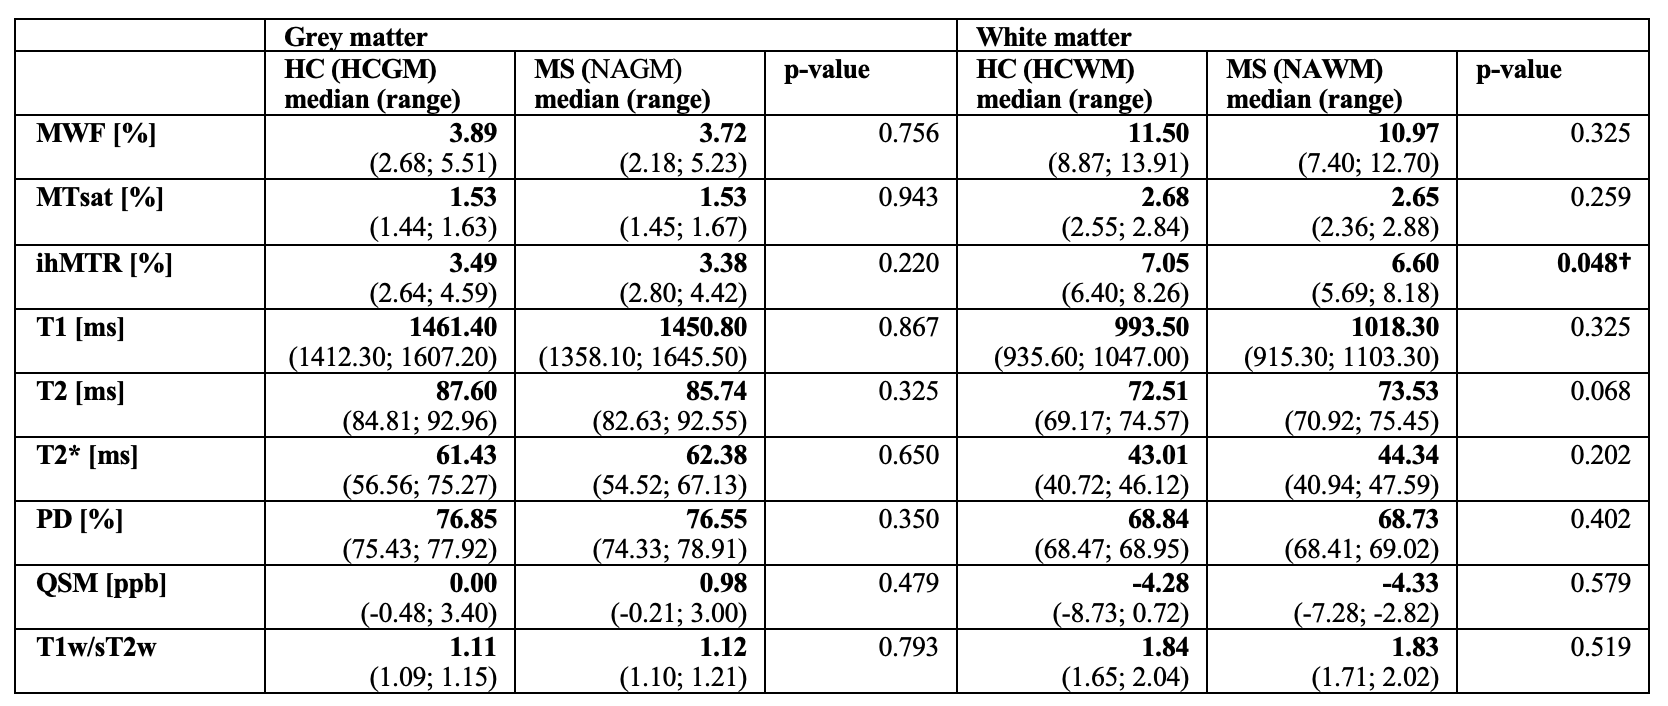
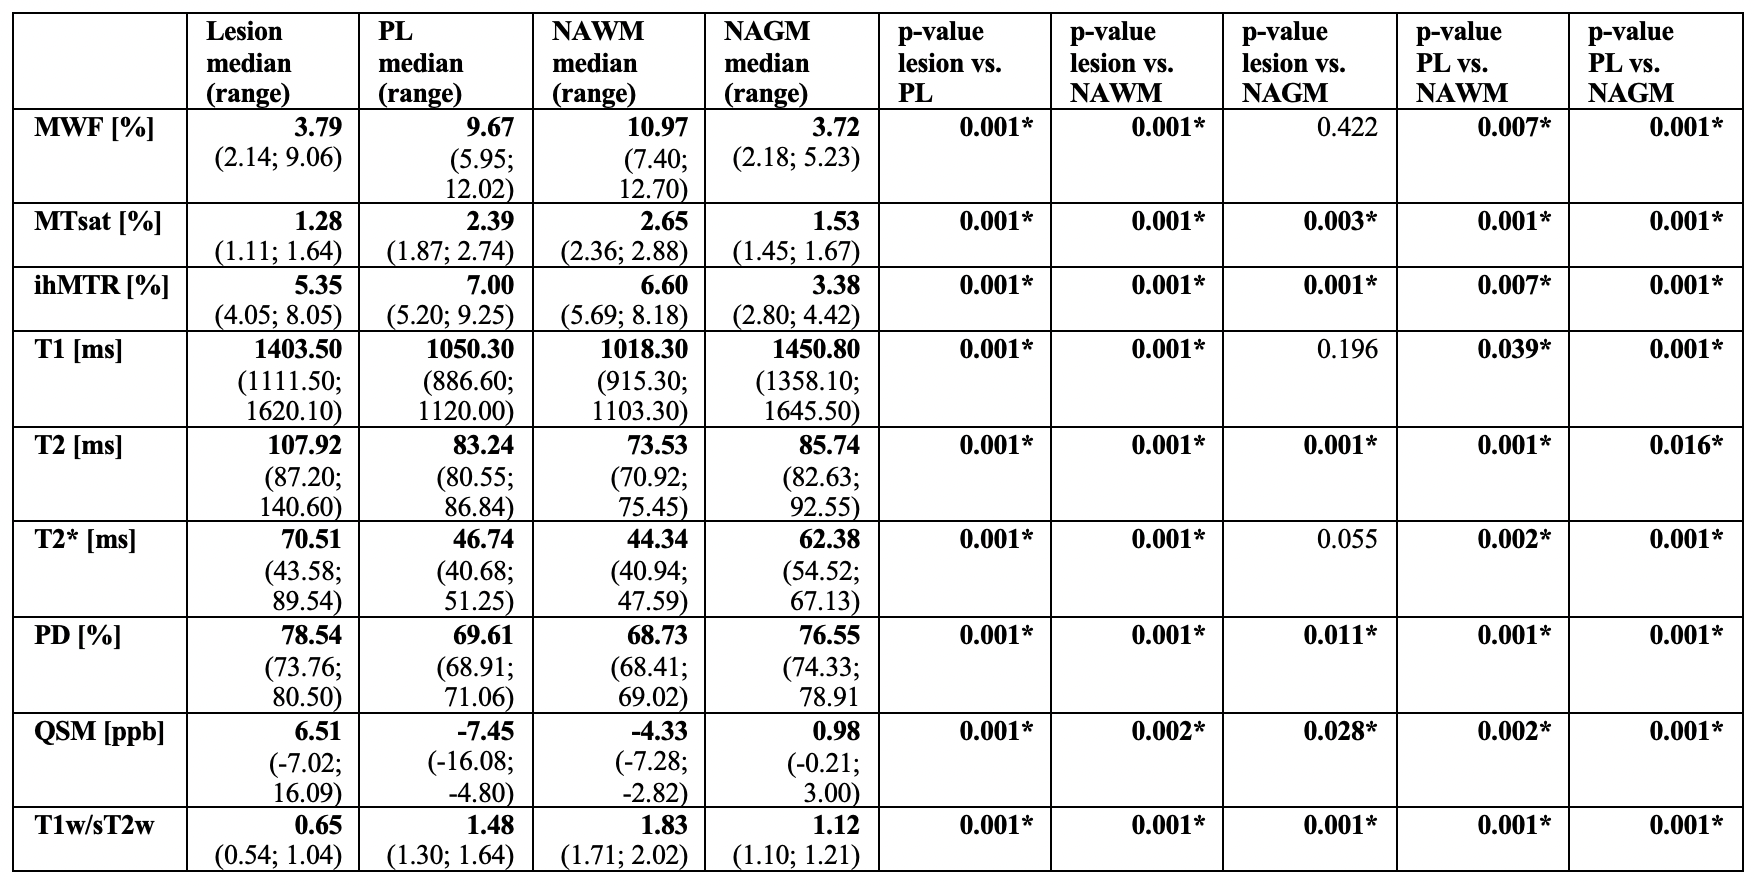
Characterization of NAWM and NAGM: Representative maps of all nine biomarkers are shown in Figure 1. The boxplot analysis revealed that the myelin-sensitive biomarkers MWF, MTsat, and ihMTR, as well as the T1w/sT2w ratio were sensitive to WM pathology in MS with lower values in NAWM than in HCWM (Figure 2). ihMTR was significantly lower in NAWM than in HCWM (p < 0.05), but did not survive correction for multiple testing (Table 1). T2 showed higher values in NAWM than in HCWM. T1, T2*, PD, and QSM did not differentiate between NAWM and HCWM. None of the biomarkers was significantly different between NAGM and HCGM.Identification of lesion, PL, and NAWM: For all nine assessed biomarkers, mean values per patient were significantly different between lesions, PL, and NAWM (p < 0.05, FDR corrected). For MTsat, ihMTR, T2, PD, QSM, and T1w/sT2w were also significantly different between lesions and NAGM (p < 0.05, FDR corrected) (Table 2). The values within PL always lay between values in lesion and NAWM, except for ihMTR (PL highest values) and QSM (PL lowest value) (Figure 3).
Discussion & Conclusion:
In our multiparametric, quantitative MRI study, we could show that all nine assessed biomarkers (MWF, MTsat, ihMTR, T1, T2, T2*, PD, QSM, and T1w/sT2w) allowed for a robust differentiation of lesions, PL, and NAWM. The biomarkers MWF, MTsat, T1, T2, T2*, PD, and T1w/sT2w showed a steady value increase or decrease from lesional tissue to PL tissue to NAWM. In particular, the myelin-sensitive measures (MWF, MTsat, and ihMTR), T2, and T1w/sT2w were the most promising MR biomarkers to separate NAWM of MS patients from HCWM. Our study adds relevant information to the current debate on the different sensitivities of various quantitative MR biomarkers to MS pathology by providing decision support for selecting the most promising MR biomarkers for clinical scan protocols.Acknowledgements
The present work was supported by a faculty internal grant (KKF).References
[1] Valk P, et al. Neuropathol Appl Neurobiol 2000;26:2-10
[2] Allen IV, et al. Neurolo Sci 2001;22:141
[3] Dziedzic T, et al. Brain Pathol. 2010;20;976-985
[4] Wattjes MP, et al. Lancet Neurol. 2021 Aug;20(8):653-670
[5] Granziera C, et al. Brain. 2021 Jun 22;144(5):1296-1311
[6] Saccenti L, et al. Cells. 2020 Feb 8;9(2):393
[7] Lommers E, et al. Neuroimage Clin. 2019;23:101879
[8] Hagiwara A, et al. AJNR AM J Neuroradiol. 2017 Feb;38(2):237-242
[9] O’Muircheartaigh, et al. Hum Brain Mapp. 2019 May;40(7):2104-2116
[10] Prasloski T, et al. Neuroimage. 2012 Oct 15;63(1):533-9
[11] Girard OM, et al. Magn Reson Med. 2015 Jun;73(6):2111-21
[12] Tabelow K, et al. Neuroimage. 2019 Jul 1;194:191-210
[13] Liu J, et al. Neuroimage. 2012 Feb 1;59(3):2560-8
[14] Li H, et al. Neuoimage. 2018;183:650-65
Figures