2838
Feasibility of ultra-fast, high-resolution, T2*-weighted brain imaging using 3D echo-planar imaging and CAIPIRINHA1Department of Neurology, Cedars Sinai Medical Center, Los Angeles, CA, United States, 2Siemens Healthcare Pty Ltd, Brisbane, Australia, 3Siemens Medical Solutions, Los Angeles, CA, United States, 4Siemens Medical Solutions, Malvern, PA, United States, 5Siemens Medical Solutions, Baltimore, MD, United States, 6Functional MRI Facility, National Institute of Mental Health, Bethesda, MD, United States, 7Imaging Institute, Cleveland Clinic, Cleveland, OH, United States, 8Department of Radiology, University of Pennsylvania, Philadelphia, PA, United States, 9Department of Biostatistics, Epidemiology, and Informatics, University of Pennsylvania Perelman School of Medicine, Philadelphia, PA, United States, 10Department of Neurology, University of Pennsylvania, Philadelphia, PA, United States, 11Department of Imaging, Cedars-Sinai Medical Center, Los Angeles, CO, United States, 12Biomedical Imaging Research Institute, Cedars-Sinai Medical Center, Los Angeles, CA, United States, 13Larner College of Medicine, The University of Vermont, Burlington, VT, United States, 14Translational Neuroradiology Section, National Institute of Neurological Disorders and Stroke, National Institutes of Health, Bethesda, CA, United States, 15Mellen Center, Department of Neurology, Neurological Institute, Cleveland Clinic, Cleveland, OH, United States
Synopsis
Keywords: Multiple Sclerosis, Data Analysis, Parallel Imaging
High-resolution T2*-weighted brain imaging using 3D echo planar imaging (3D-EPI) at 3T allows detection of new biomarkers of neurological disorders, such as the central vein sign in multiple sclerosis. However, current 3D-EPI scan times are suboptimal for a widespread implementation in hospitals and private imaging centers. In this study, we evaluated the feasibility of combining 3D-EPI acquisition with different CAIPIRINHA undersampling patterns. A significant reduction in scan time (up to 70% reduction) was achieved without any obvious aliasing artifacts, confirming the feasibility of ultra-fast, high-resolution T2* brain imaging for future clinical applications at 3T.Introduction
High-resolution T2*-weighted imaging using 3D echo planar imaging (3D-EPI) enables detection of new diagnostic biomarkers of neurological disorders, such as the central vein sign (CVS) in multiple sclerosis (MS).1-3 The recommended 3D-EPI acquisition for optimal image quality at 3T is ~6 minutes long,4 which is suboptimal for a widespread implementation in hospitals and private imaging centers. One strategy to further reduce the scan time is to include advanced parallel imaging techniques, such as Controlled Aliasing In Parallel Imaging Results In Higher Acceleration (CAIPIRINHA).5 In this study, we evaluated the novel combination of 3D-EPI with different 2D CAIPIRINHA undersampling patterns to produce ultra-fast, high-isotropic-resolution, T2*-weighted brain imaging at 3T.Methods
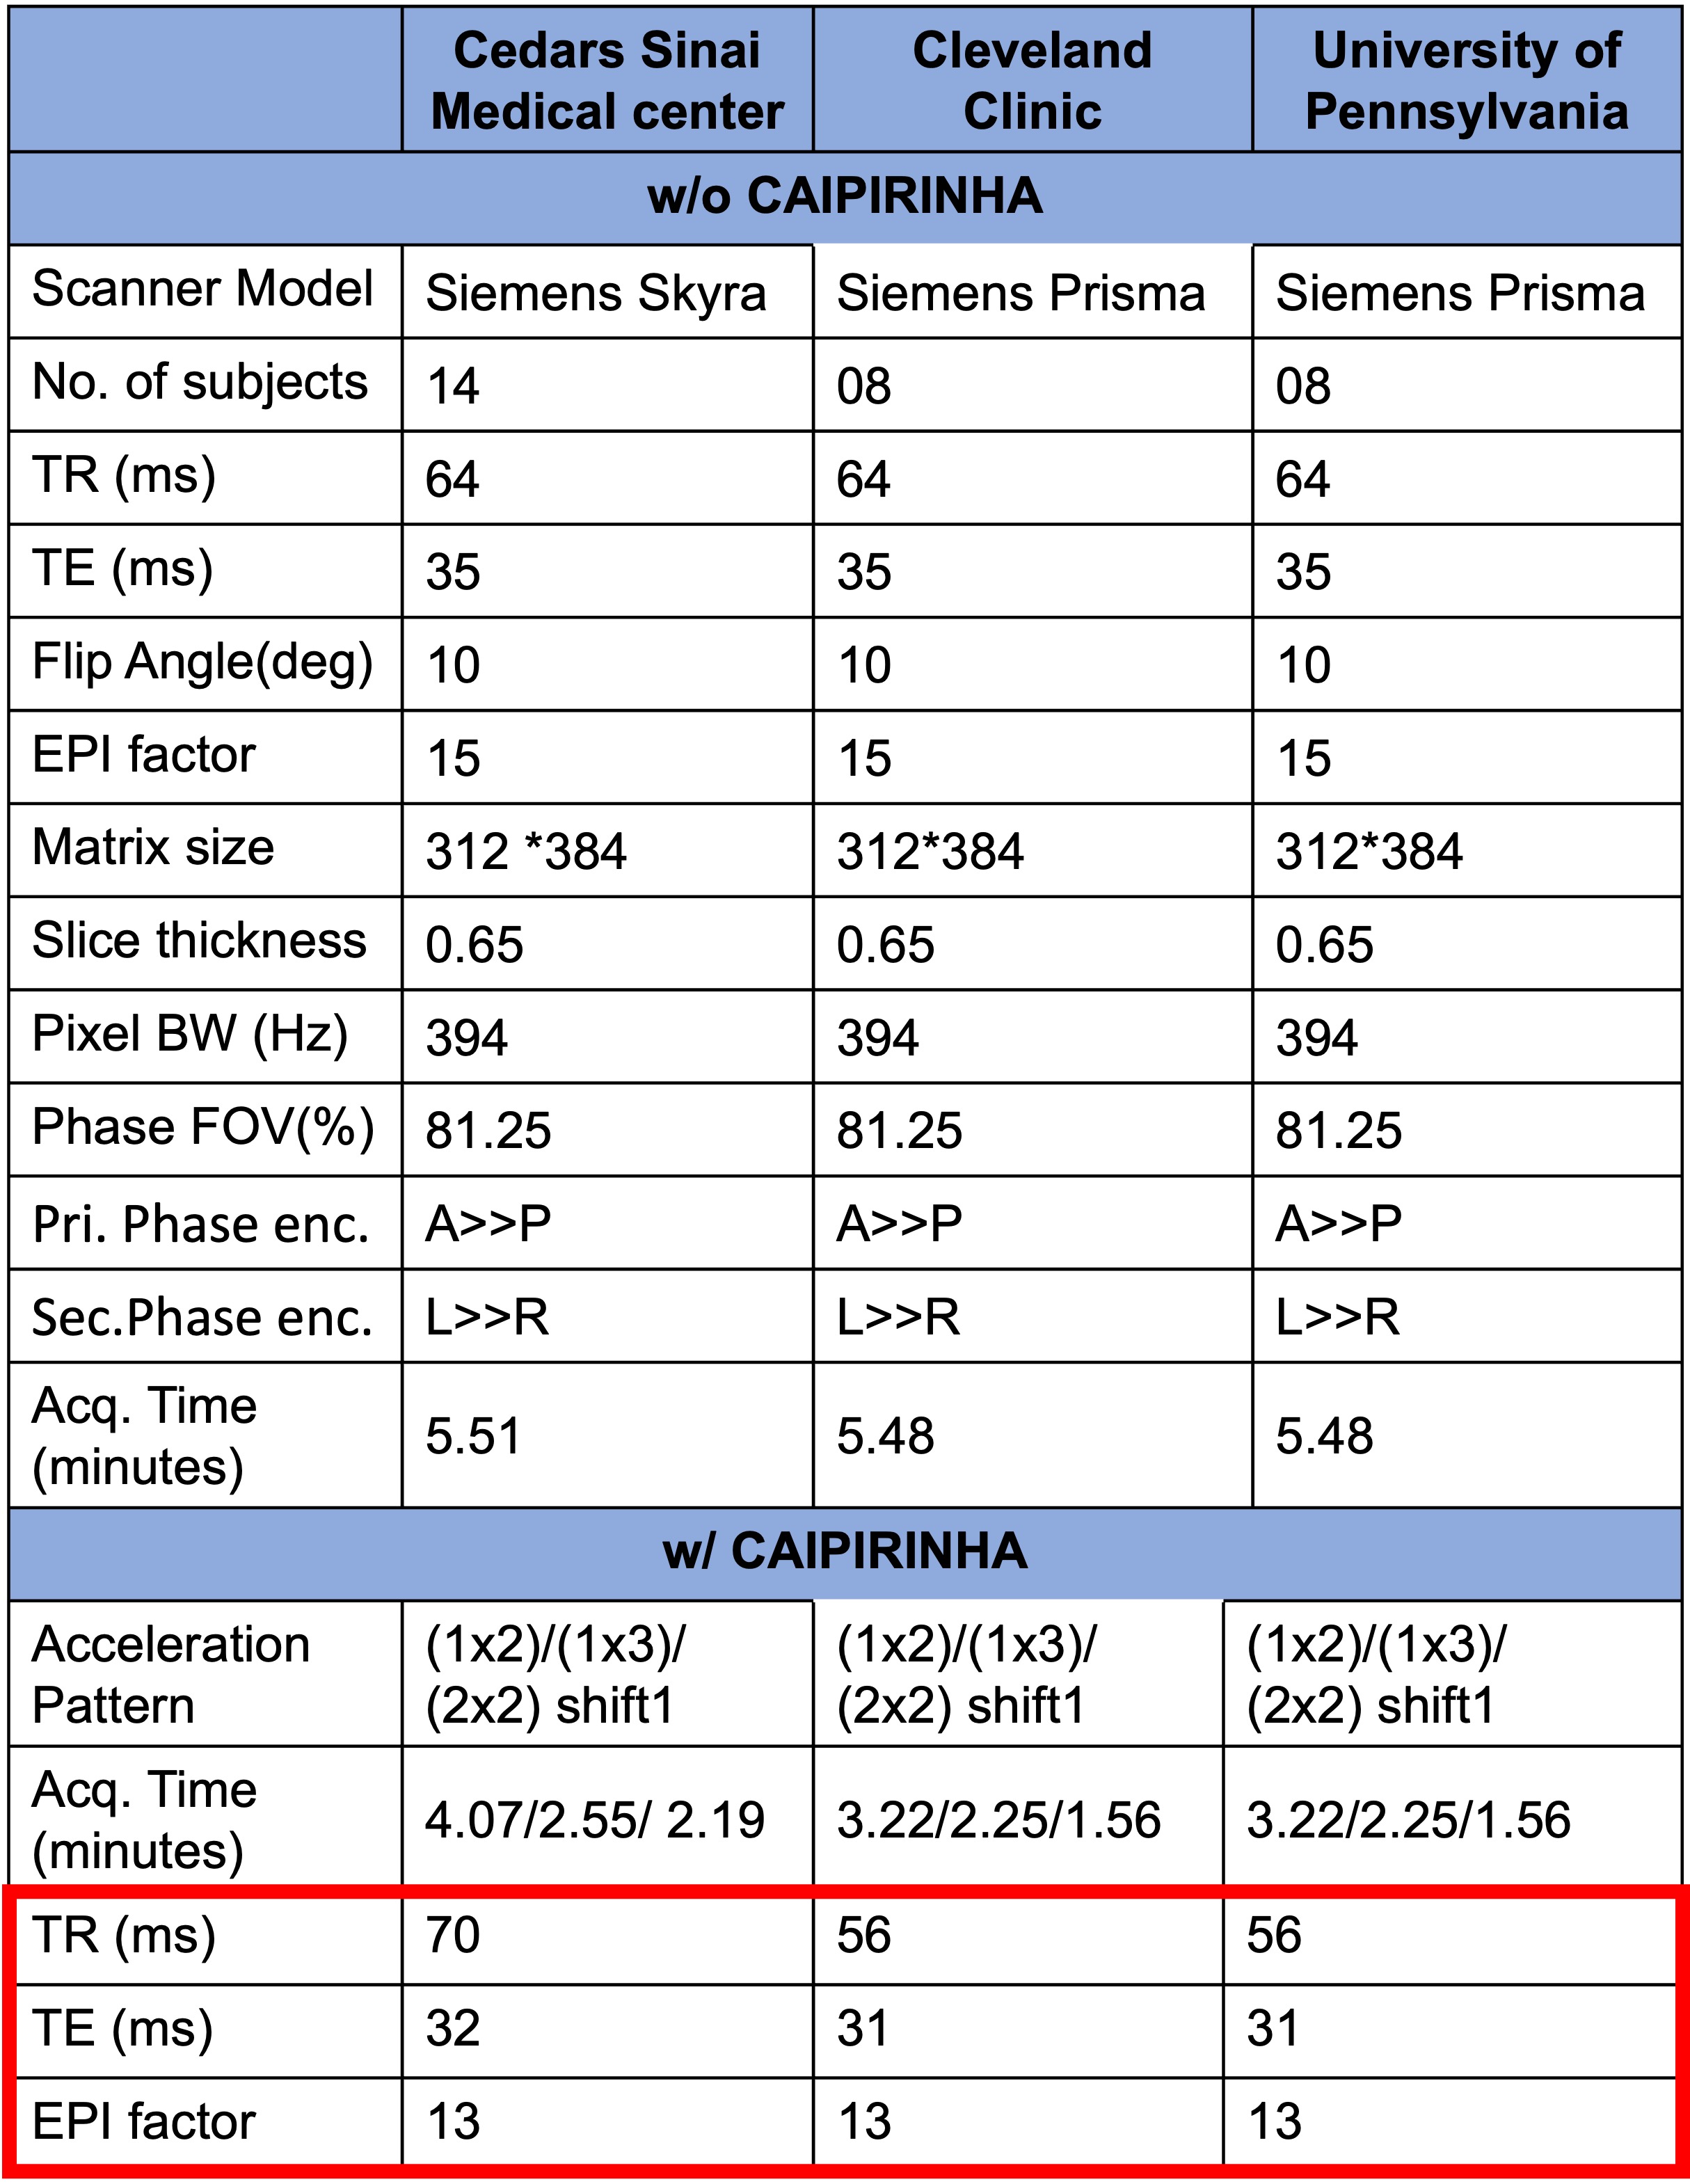
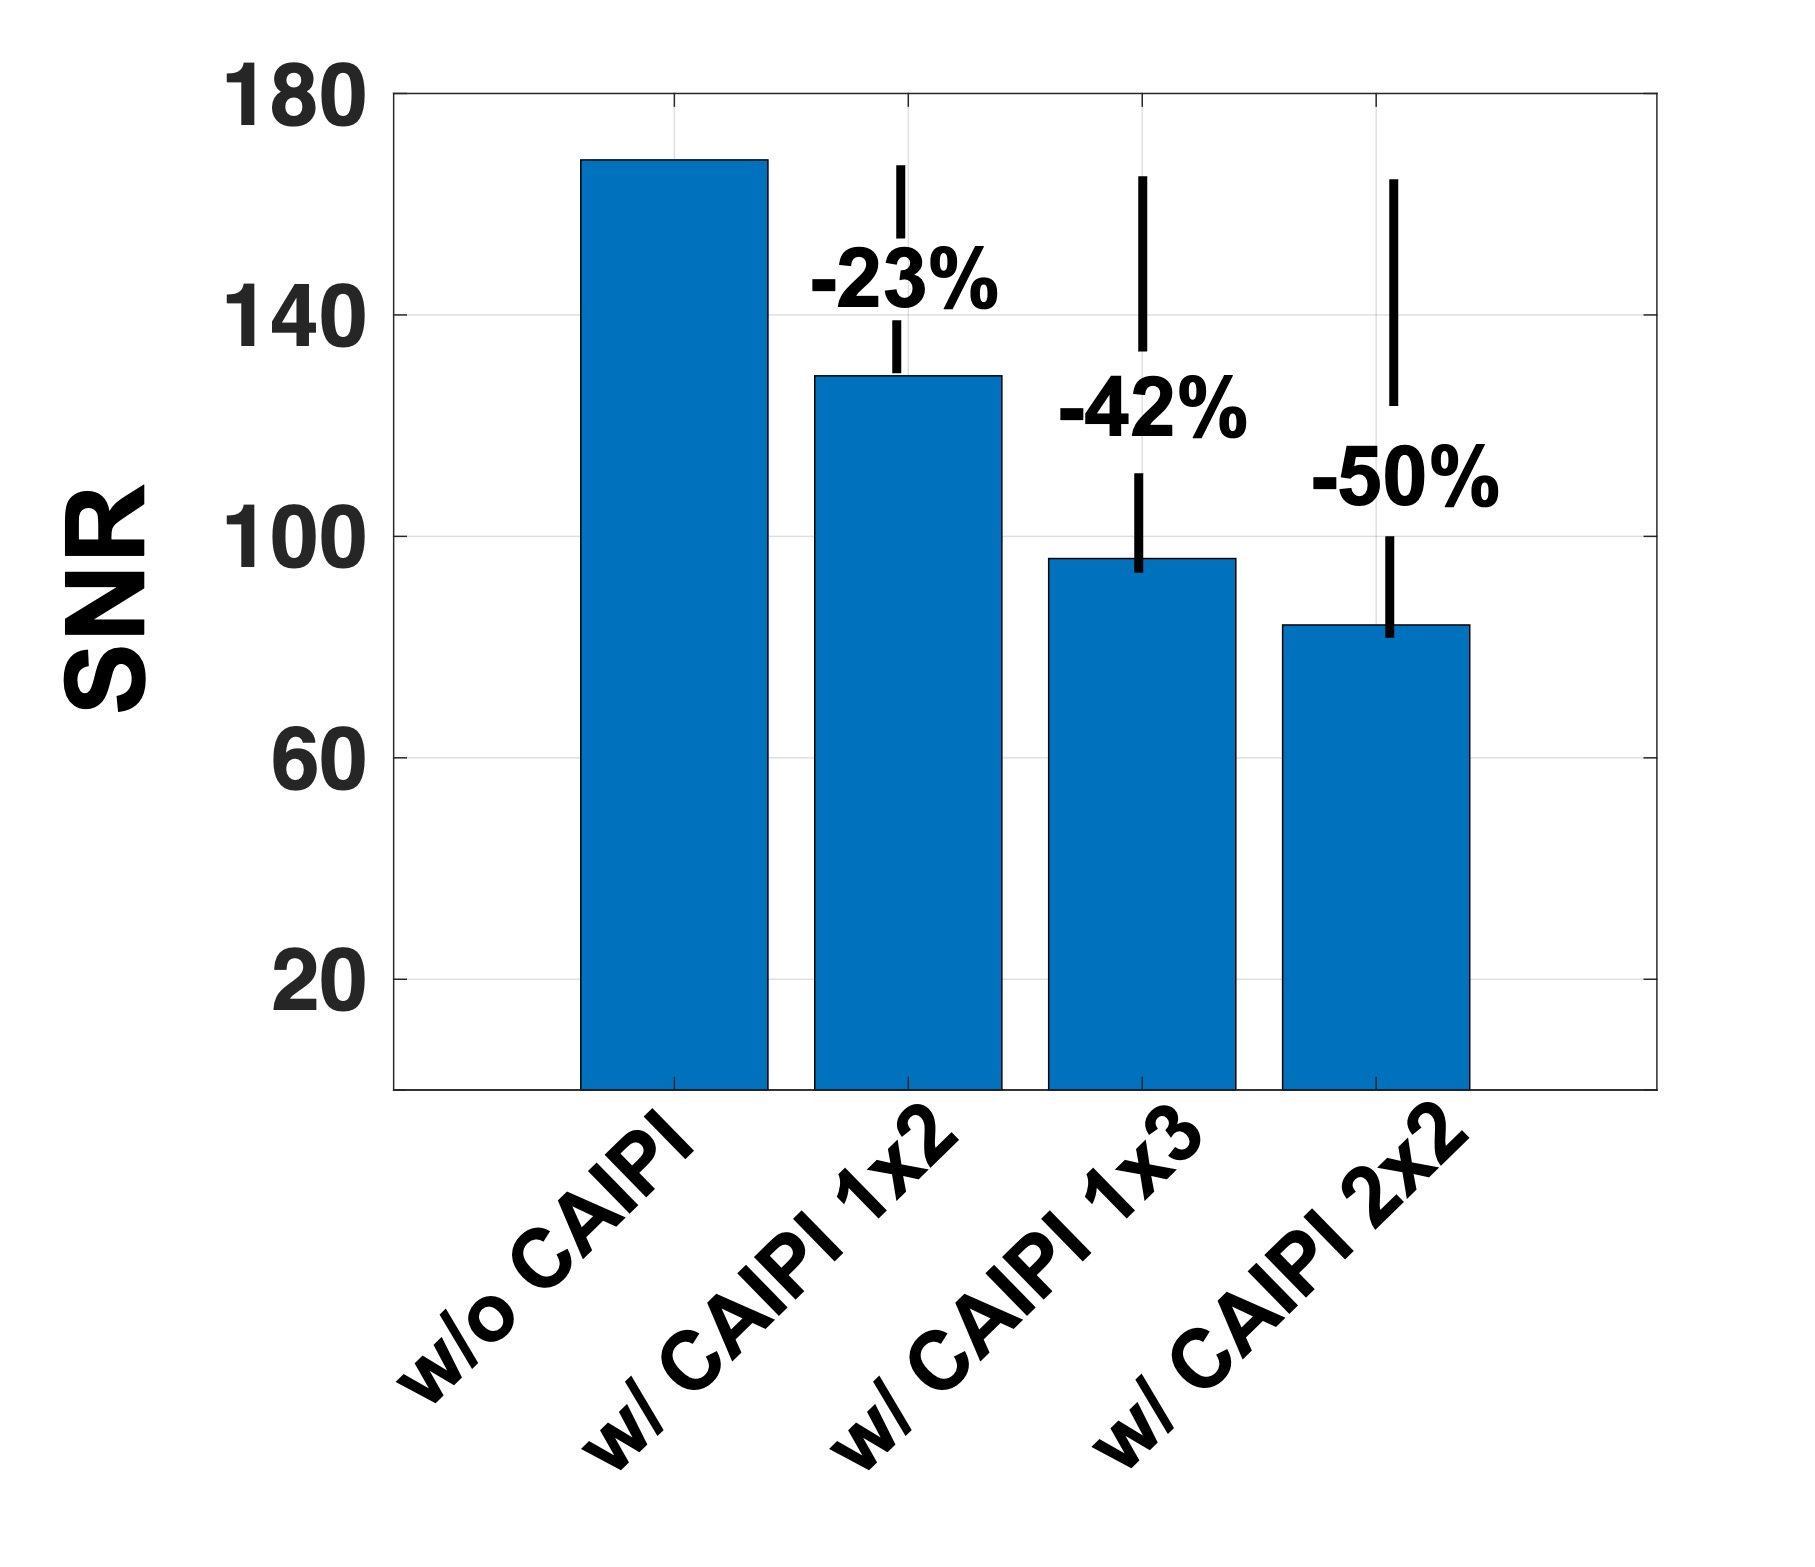
This study included phantom and human imaging at 3T. Phantom imaging was performed at Cedars-Sinai using a standard sphere. Human imaging was performed at three different sites (Cedars-Sinai, Cleveland Clinic, University of Pennsylvania) as part of the CAVS-MS study.4 The data were collected on Siemens 3T system (MAGNETOM Skyra/Prisma, Siemens Healthcare, Erlangen, Germany). High-resolution (650 mm isotropic) T2*-weighted 3D-EPI (T2* 3D-EPI) was acquired without (w/o) and with (w/) CAIPIRINHA. The following 2D undersampling patterns, noted as (acceleration factor in phase encoding direction) x (acceleration factor in partition encoding direction), were used: (1x2), (1x3), and (2x2). All acquisitions used CAIPIRINHA shift of 1. For phantom imaging, each pattern was acquired twice (scan & rescan) for signal-to-noise ratio (SNR) measurement. Signal intensity was calculated by voxelwise averaging of scan and rescan images. The noise map was estimated using the absolute voxelwise difference between scan and rescan. SNR was then computed as:$$SNR=\frac{mean(Signal)}{std(Noise)}$$
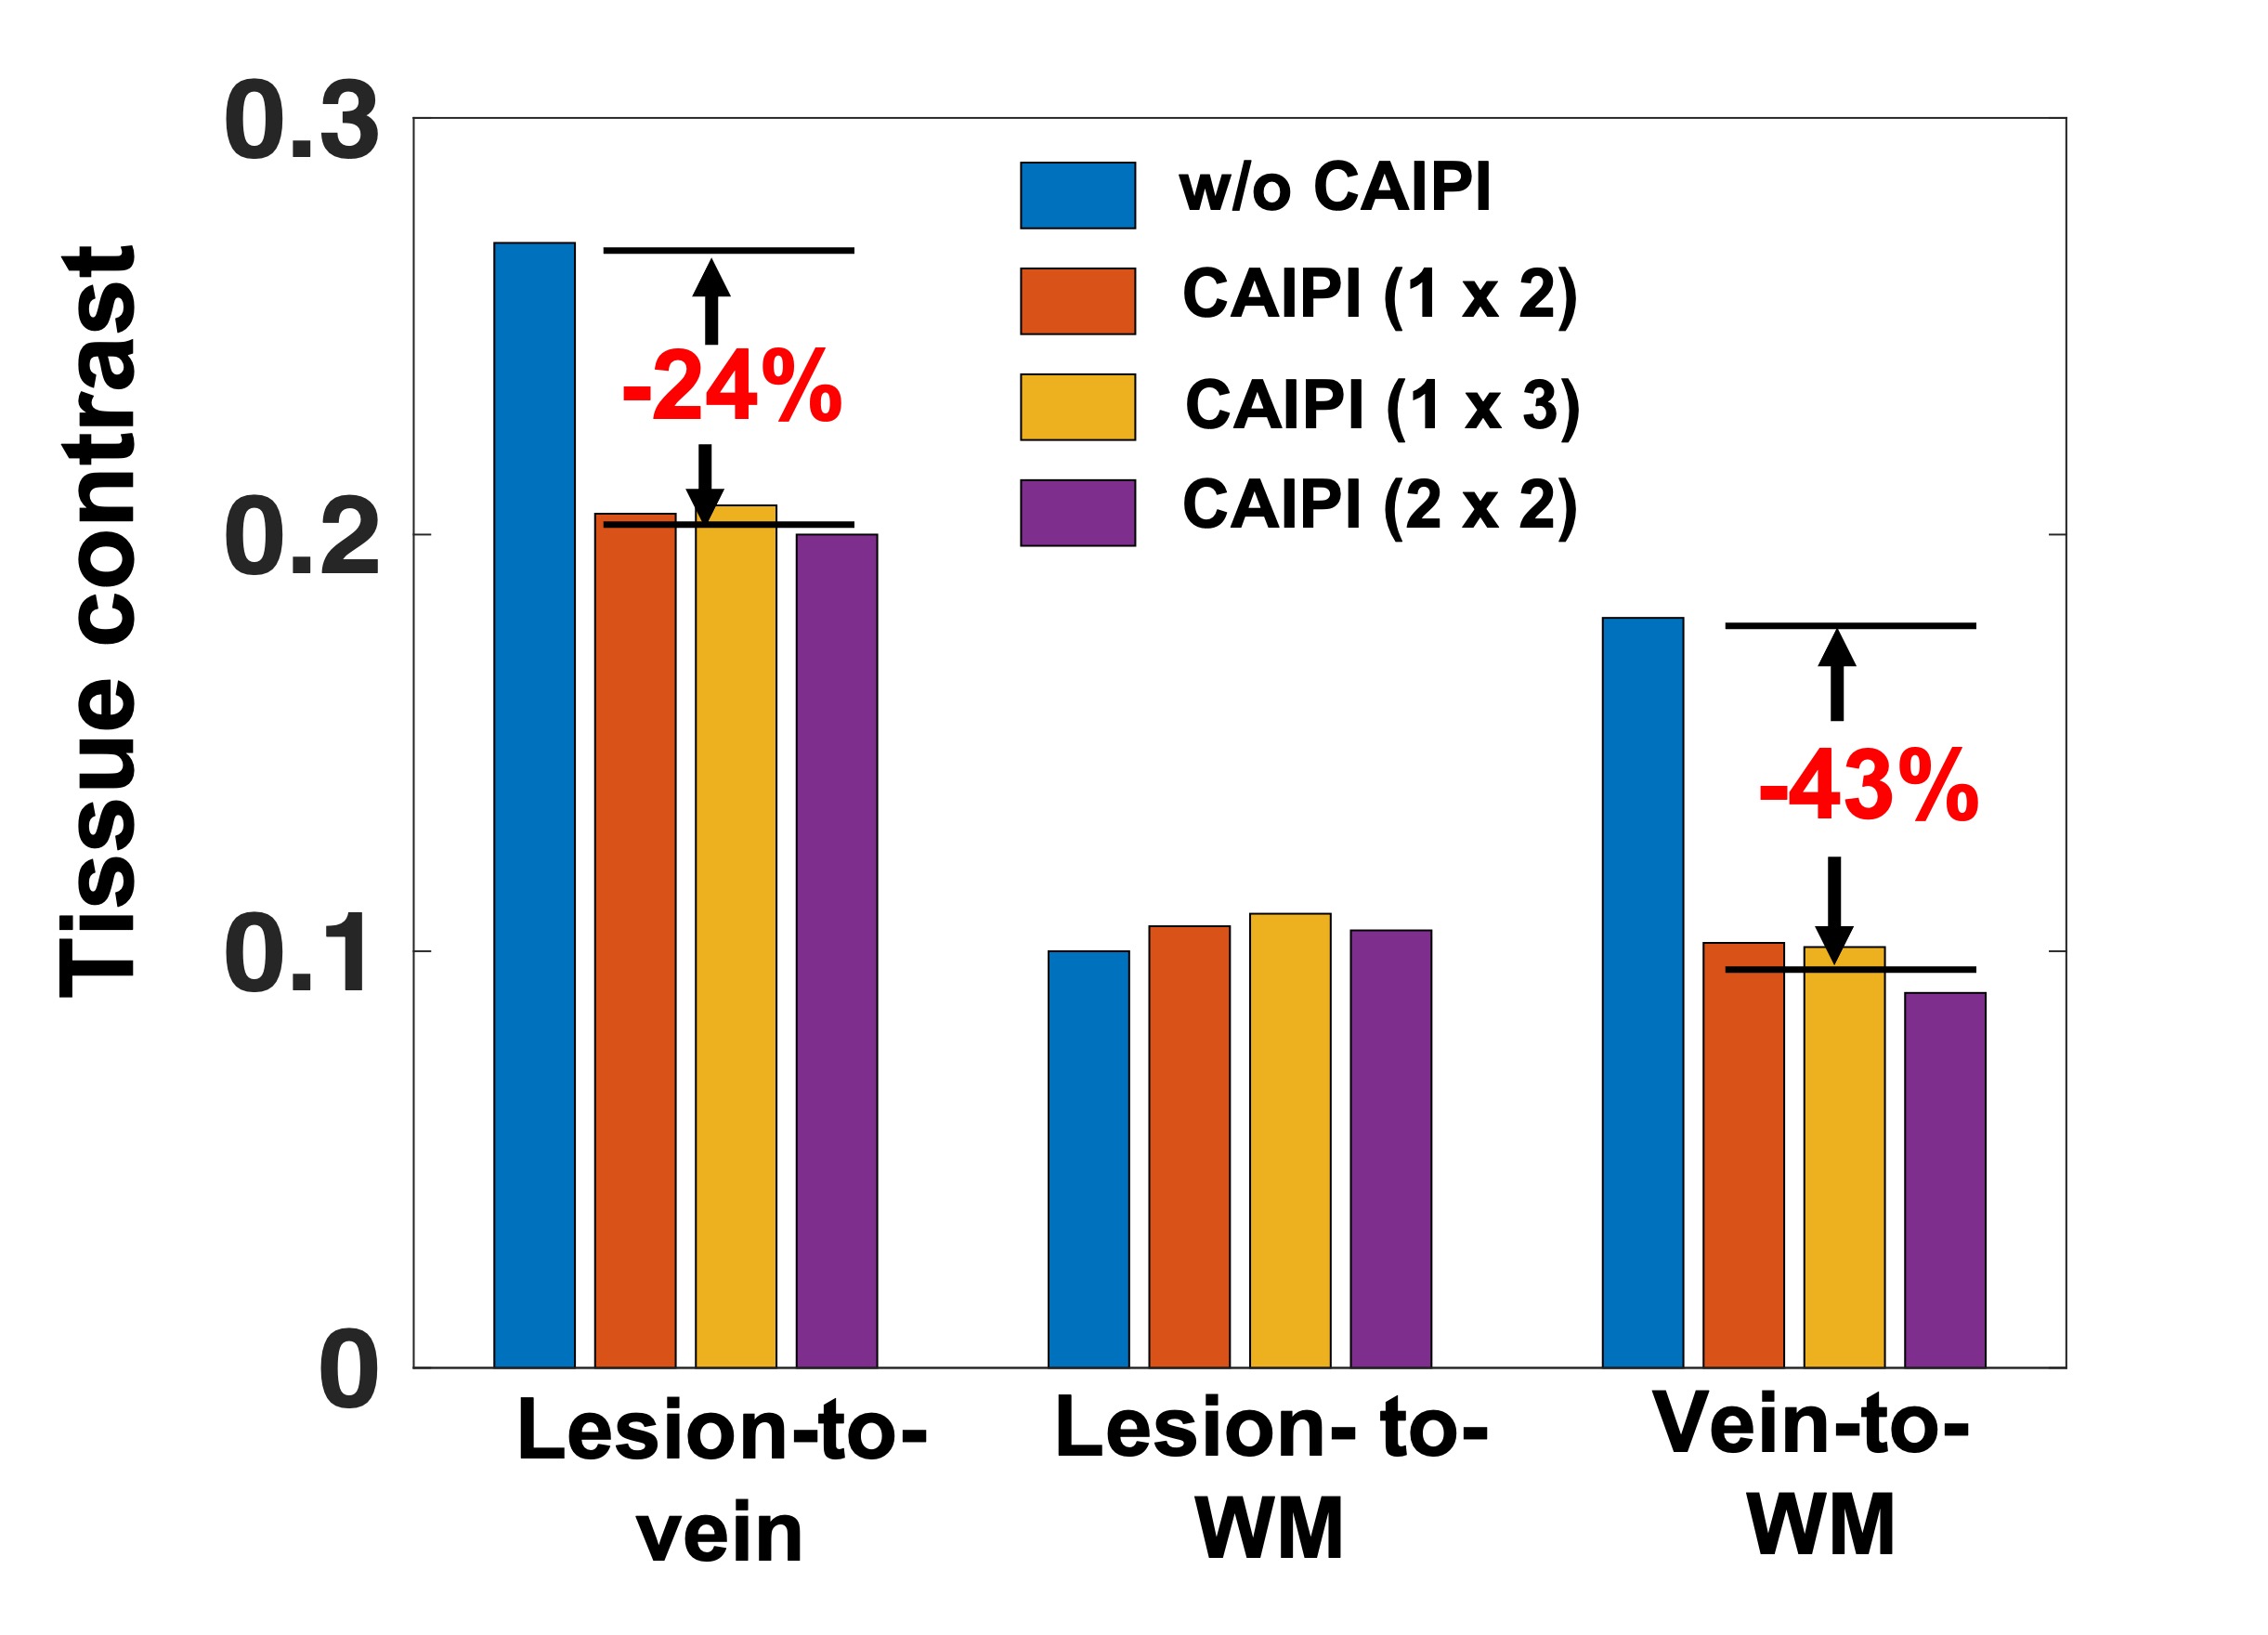
For human imaging, thirty adults prospectively evaluated for a possible diagnosis of multiple sclerosis were recruited from the three sites.4 All underwent a 3T brain MRI, which included T1-weighted MPRAGE, T2-weighted FLAIR, and a series of T2* 3D-EPI w/o and w/ CAIPIRINHA undersampling patterns similar to that used in the phantom study. Sequence parameters for the different T2* 3D-EPI scans were standardized across the different sites to the extent possible (Table 1). However, slight differences in TR/TE remained due to restrictions from the research sequence when using CAIPIRINHA (red box). T1-MPRAGE, T2-FLAIR, and T2* 3D-EPI w/ CAIPIRINHA images were rigidly aligned to the subject’s own T2* 3D-EPI w/o CAIPIRINHA images using FSL FLIRT tool.6 Brain extraction was performed on all registered images. Registered T1-MPRAGE images were segmented to generate white matter (WM) masks using FSL FAST.7 Automated lesion segmentation, was performed on registered T2-FLAIR and registered T1-MPRAGE using the Method for Inter-Modal Segmentation Analysis (MIMoSA).8 Finally, a Frangi filter was applied to T2* 3D-EPI w/o CAIPIRINHA to generate vein masks.9 Using these different segmented tissue masks, tissue contrast measures for lesion-to-vein, lesion-to-WM and vein-to-WM were computed as:
$$Contrast_{a-to-b}=\frac{|S_{a}-S_{b}|}{|S_{a}+S_{b}|},$$
where S is the average signal intensity within the mask, and a-to-b denotes the comparison of tissues of interest (e.g., lesions, veins, and white matter).
Results
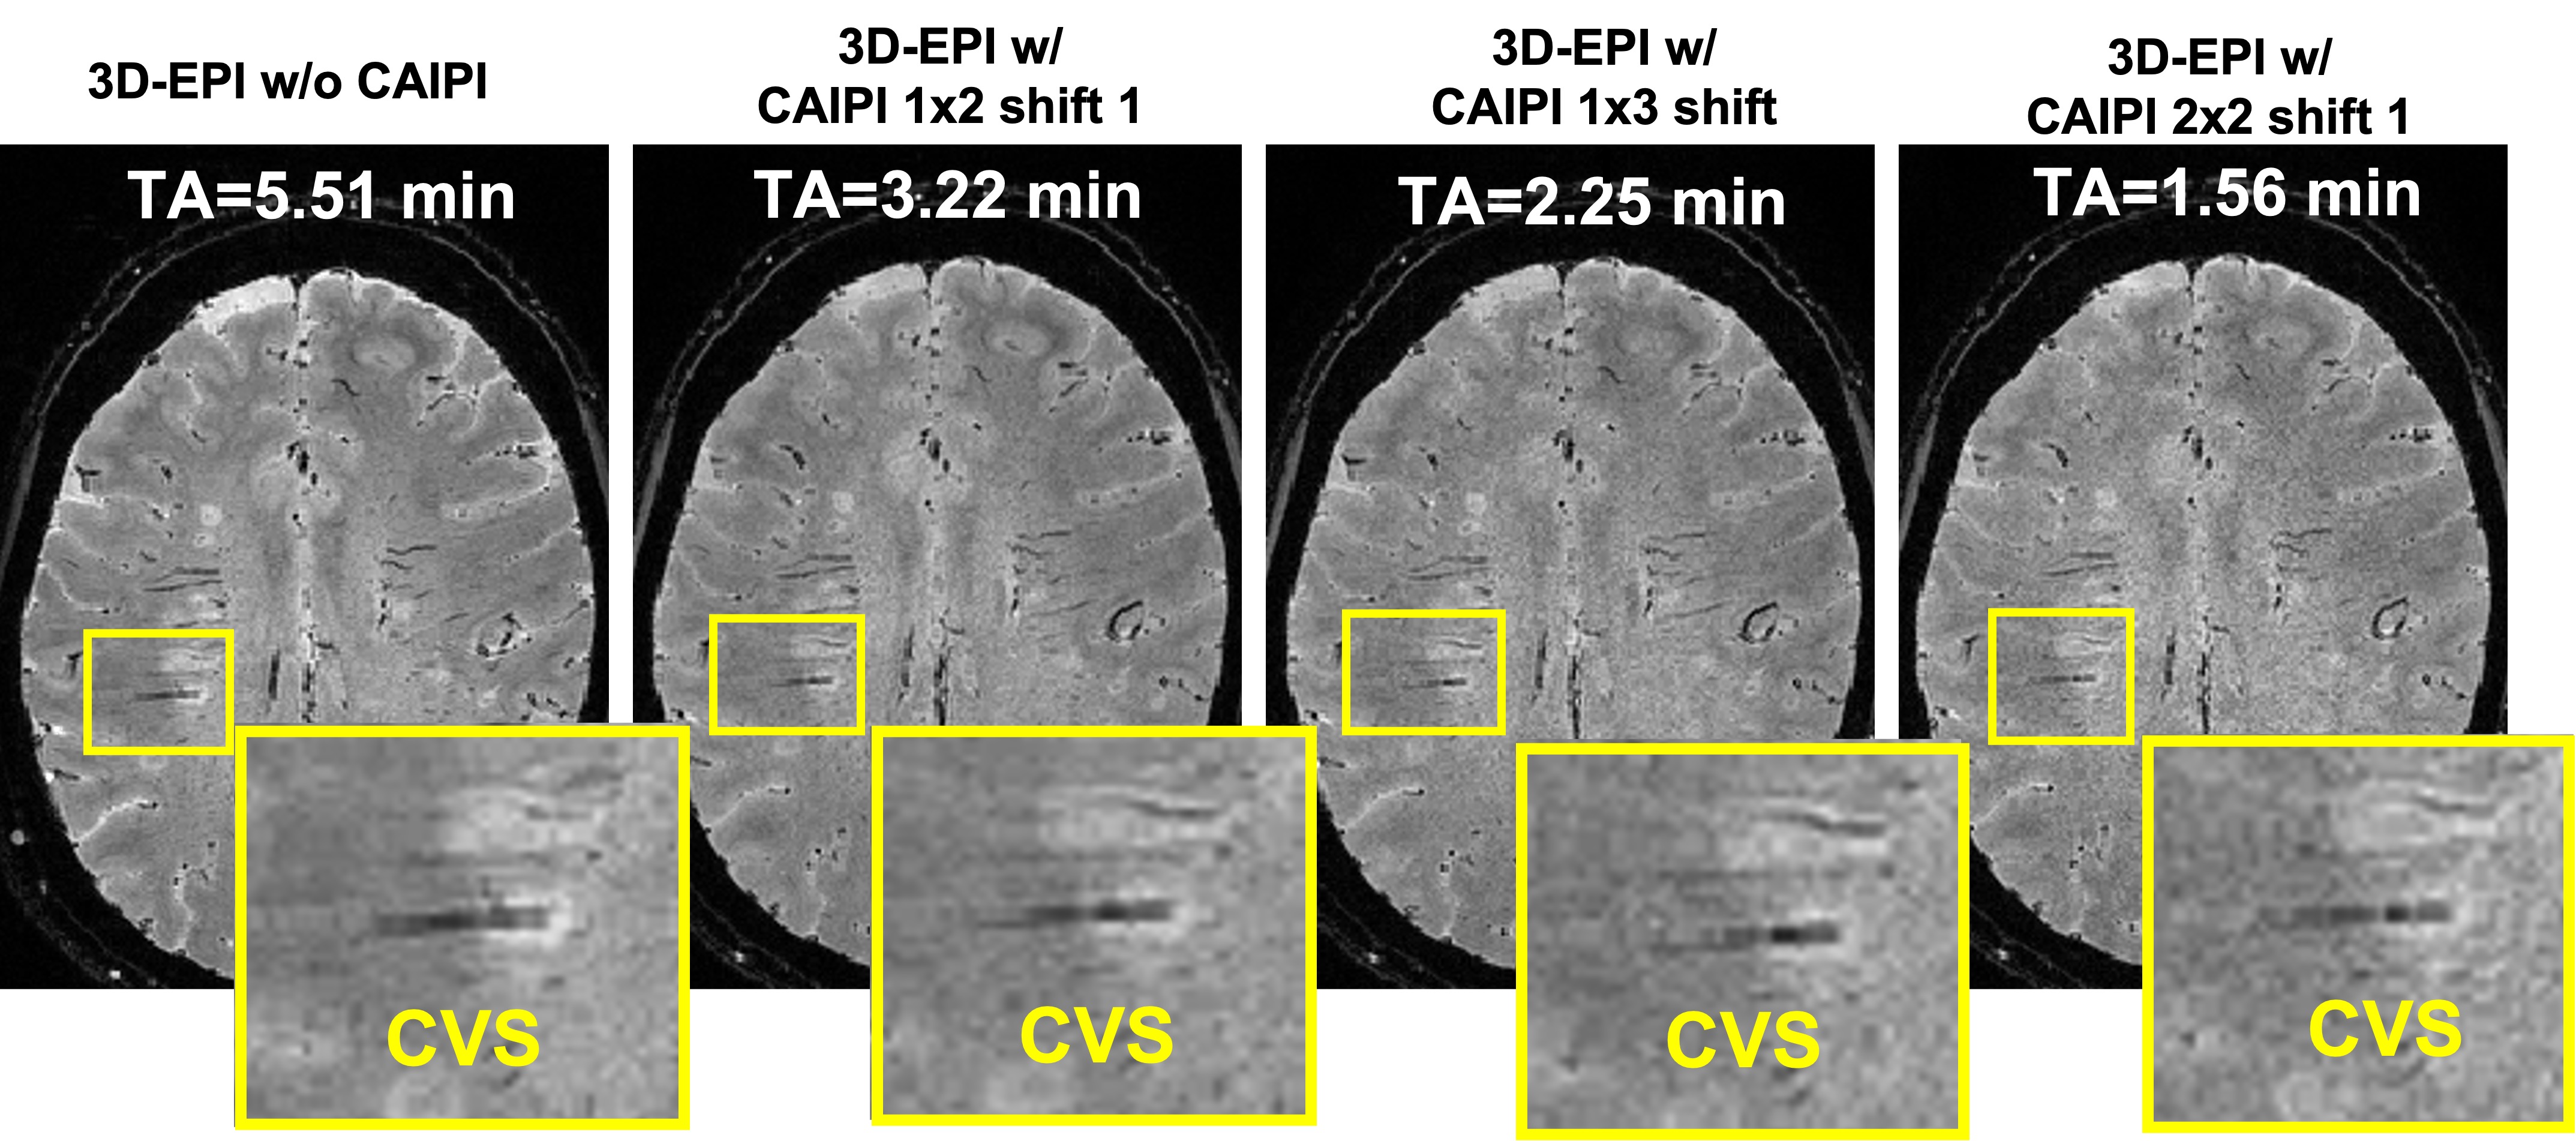
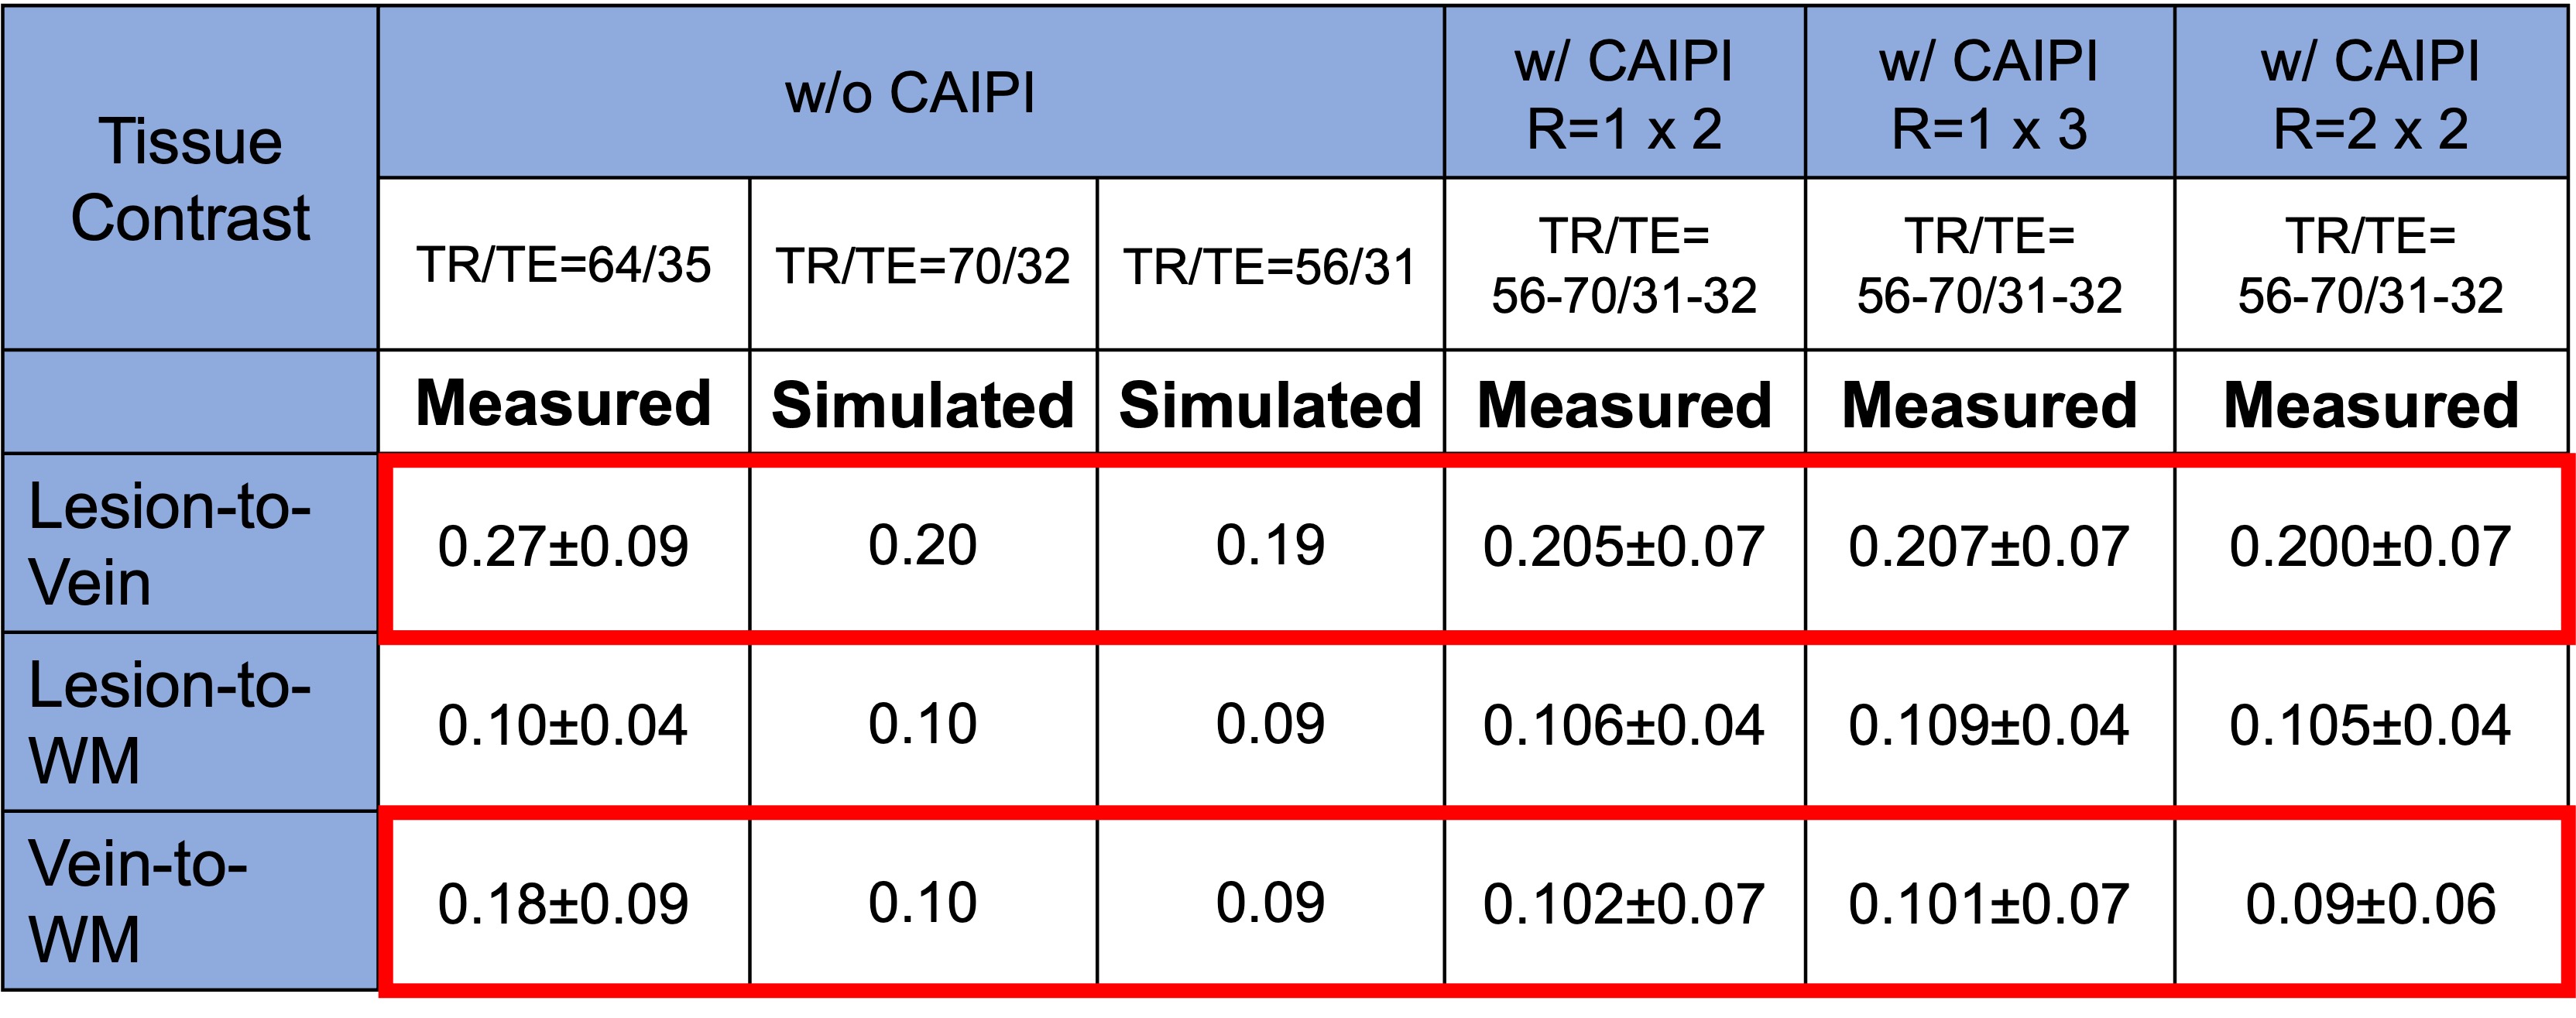
SNR measurements decreased by 23%, 42%, and 50% as the CAIPIRINHA total acceleration factor R was increased to 2 (1x2), 3 (1x3), and 4 (2x2), respectively (Figure 1). Images acquired in vivo did not display any aliasing artifacts, and brain lesions with CVS remained visible on all scans, including the fastest sequence (R=4), which had a 70% reduction in acquisition time (2-min scan) (Figure 2). While the lesion-to-WM contrast remained stable, both lesion-to-vein and vein-to-WM contrasts decreased by 24% and 43%, when CAIPIRINHA was used (Figure 3). Using the Bloch equations, the reduction in measured tissue contrasts between the T2* 3D-EPI scans w/o and w/ CAIPIRINHA was simulated using the different TR/TE values applied at the sites (Table 2, red boxes).Discussion
3D-EPI used in combination with CAIPIRINHA undersampling can achieve ultra-fast, high-isotropic-resolution, T2*-weighted brain images at 3T. In this study, we tested different undersampling patterns with a maximum reduction in scan time of 70% (< 2 min) without obvious imaging artifacts. As expected, we observed a substantial SNR reduction when increasing the total acceleration factor (e.g., ~50% reduction for R=4). While CVS was visible on all tested T2* 3D-EPI w/ CAIPIRINHA acquisitions, quantitative measures demonstrated an unexpected tissue contrast reduction between the T2* 3D-EPI scans w/o and w/ CAIPIRINHA, which seem to be primarily driven by small differences in sequence parameters (TR/TE). These small differences affected structures with relatively short T2* relaxation (veins). This finding highlights the importance of fully standardized sequence parameters when performing benchmark comparison of images acquired with and without undersampling.Conclusion
In this study, we validated the feasibility of ultra-fast, high-resolution, T2*-weighted brain imaging using 3D-EPI combined with CAIPIRINHA at 3T. Future work will focus on further optimization of sequence parameters and evaluation of this sequence for diagnostic use in multiple sclerosis.Acknowledgements
This work was supported by the National Institute of Neurological Disorder and Stroke (NINDS) 1U01NS116776-01 and the National Multiple Sclerosis Society (NMSS) RG-2110-38526References
1. Sati P, Oh J, Constable RT, Evangelou N, Guttmann CR, Henry RG, Klawiter EC, Mainero C, Massacesi L, McFarland H. The central vein sign and its clinical evaluation for the diagnosis of multiple sclerosis: a consensus statement from the North American Imaging in Multiple Sclerosis Cooperative. Nature Reviews Neurology. 2016;12(12):714-22.
2. Sati P, Thomasson D, Li N, Pham D, Biassou N, Reich D, Butman J. Rapid, high-resolution, whole-brain, susceptibility-based MRI of multiple sclerosis. Multiple Sclerosis Journal. 2014;20(11):1464-70.
3. Absinta M, Sati P, Fechner A, Schindler MK, Nair G, Reich DS. Identification of chronic active multiple sclerosis lesions on 3T MRI. American Journal of Neuroradiology. 2018;39(7):1233-8.
4. Ontaneda D, Sati P, Raza P, Kilbane M, Gombos E, Alvarez E, Azevedo C, Calabresi P, Cohen J, Freeman L. Central vein sign: A diagnostic biomarker in multiple sclerosis (CAVS-MS) study protocol for a prospective multicenter trial. NeuroImage: Clinical. 2021;32:102834.
5. Breuer FA, Blaimer M, Mueller MF, Seiberlich N, Heidemann RM, Griswold MA, Jakob PM. Controlled aliasing in volumetric parallel imaging (2D CAIPIRINHA). Magnetic Resonance in Medicine: An Official Journal of the International Society for Magnetic Resonance in Medicine. 2006;55(3):549-56.
6. Jenkinson M, Beckmann C, Behrens T, Woolrich M, Smith S. FSL Neuroimage. 2012; 62: 782–90. DOI.
7. Zhang Y, Brady M, Smith S. Segmentation of brain MR images through a hidden Markov random field model and the expectation-maximization algorithm. IEEE transactions on medical imaging. 2001;20(1):45-57.
8. Valcarcel AM, Linn KA, Vandekar SN, Satterthwaite TD, Muschelli J, Calabresi PA, Pham DL, Martin ML, Shinohara RT. MIMoSA: an automated method for intermodal segmentation analysis of multiple sclerosis brain lesions. Journal of Neuroimaging. 2018;28(4):389-98.
9. Frangi AF, Niessen WJ, Vincken KL, Viergever MA, editors. Multiscale vessel enhancement filtering. International conference on medical image computing and computer-assisted intervention; 1998: Springer.
Figures