2837
Hidden lesions may confound 1H-MRS metabolite quantification by internal water referencing in individuals with multiple sclerosis1Biomedical Engineering, Columbia University School of Engineering and Applied Science, New York, NY, United States, 2Neurology, Columbia University Irving Medical Center, New York, NY, United States, 3Radiology and Biomedical Imaging, Yale University School of Medicine, New Haven, CT, United States, 4Neurology, Yale University School of Medicine, New Haven, CT, United States, 5Radiology, Columbia University Irving Medical Center, New York, NY, United States
Synopsis
Keywords: Multiple Sclerosis, Segmentation, Quantification, Water Referencing
A current standard practice in proton magnetic resonance spectroscopy (1H-MRS) uses water as an internal reference for absolute metabolite quantification. We investigate how apparent metabolite concentrations might be affected by tissue-level changes, specifically multiple sclerosis lesions, via water versus creatine referencing in voxels considered normal-appearing at time of scan. Our results suggest that multiple possible routes of confound by hidden lesions on metabolite quantification in even normal-appearing tissue should be considered when applying internal water referencing to 1H-MRS studies in cohorts with multiple sclerosis.Introduction
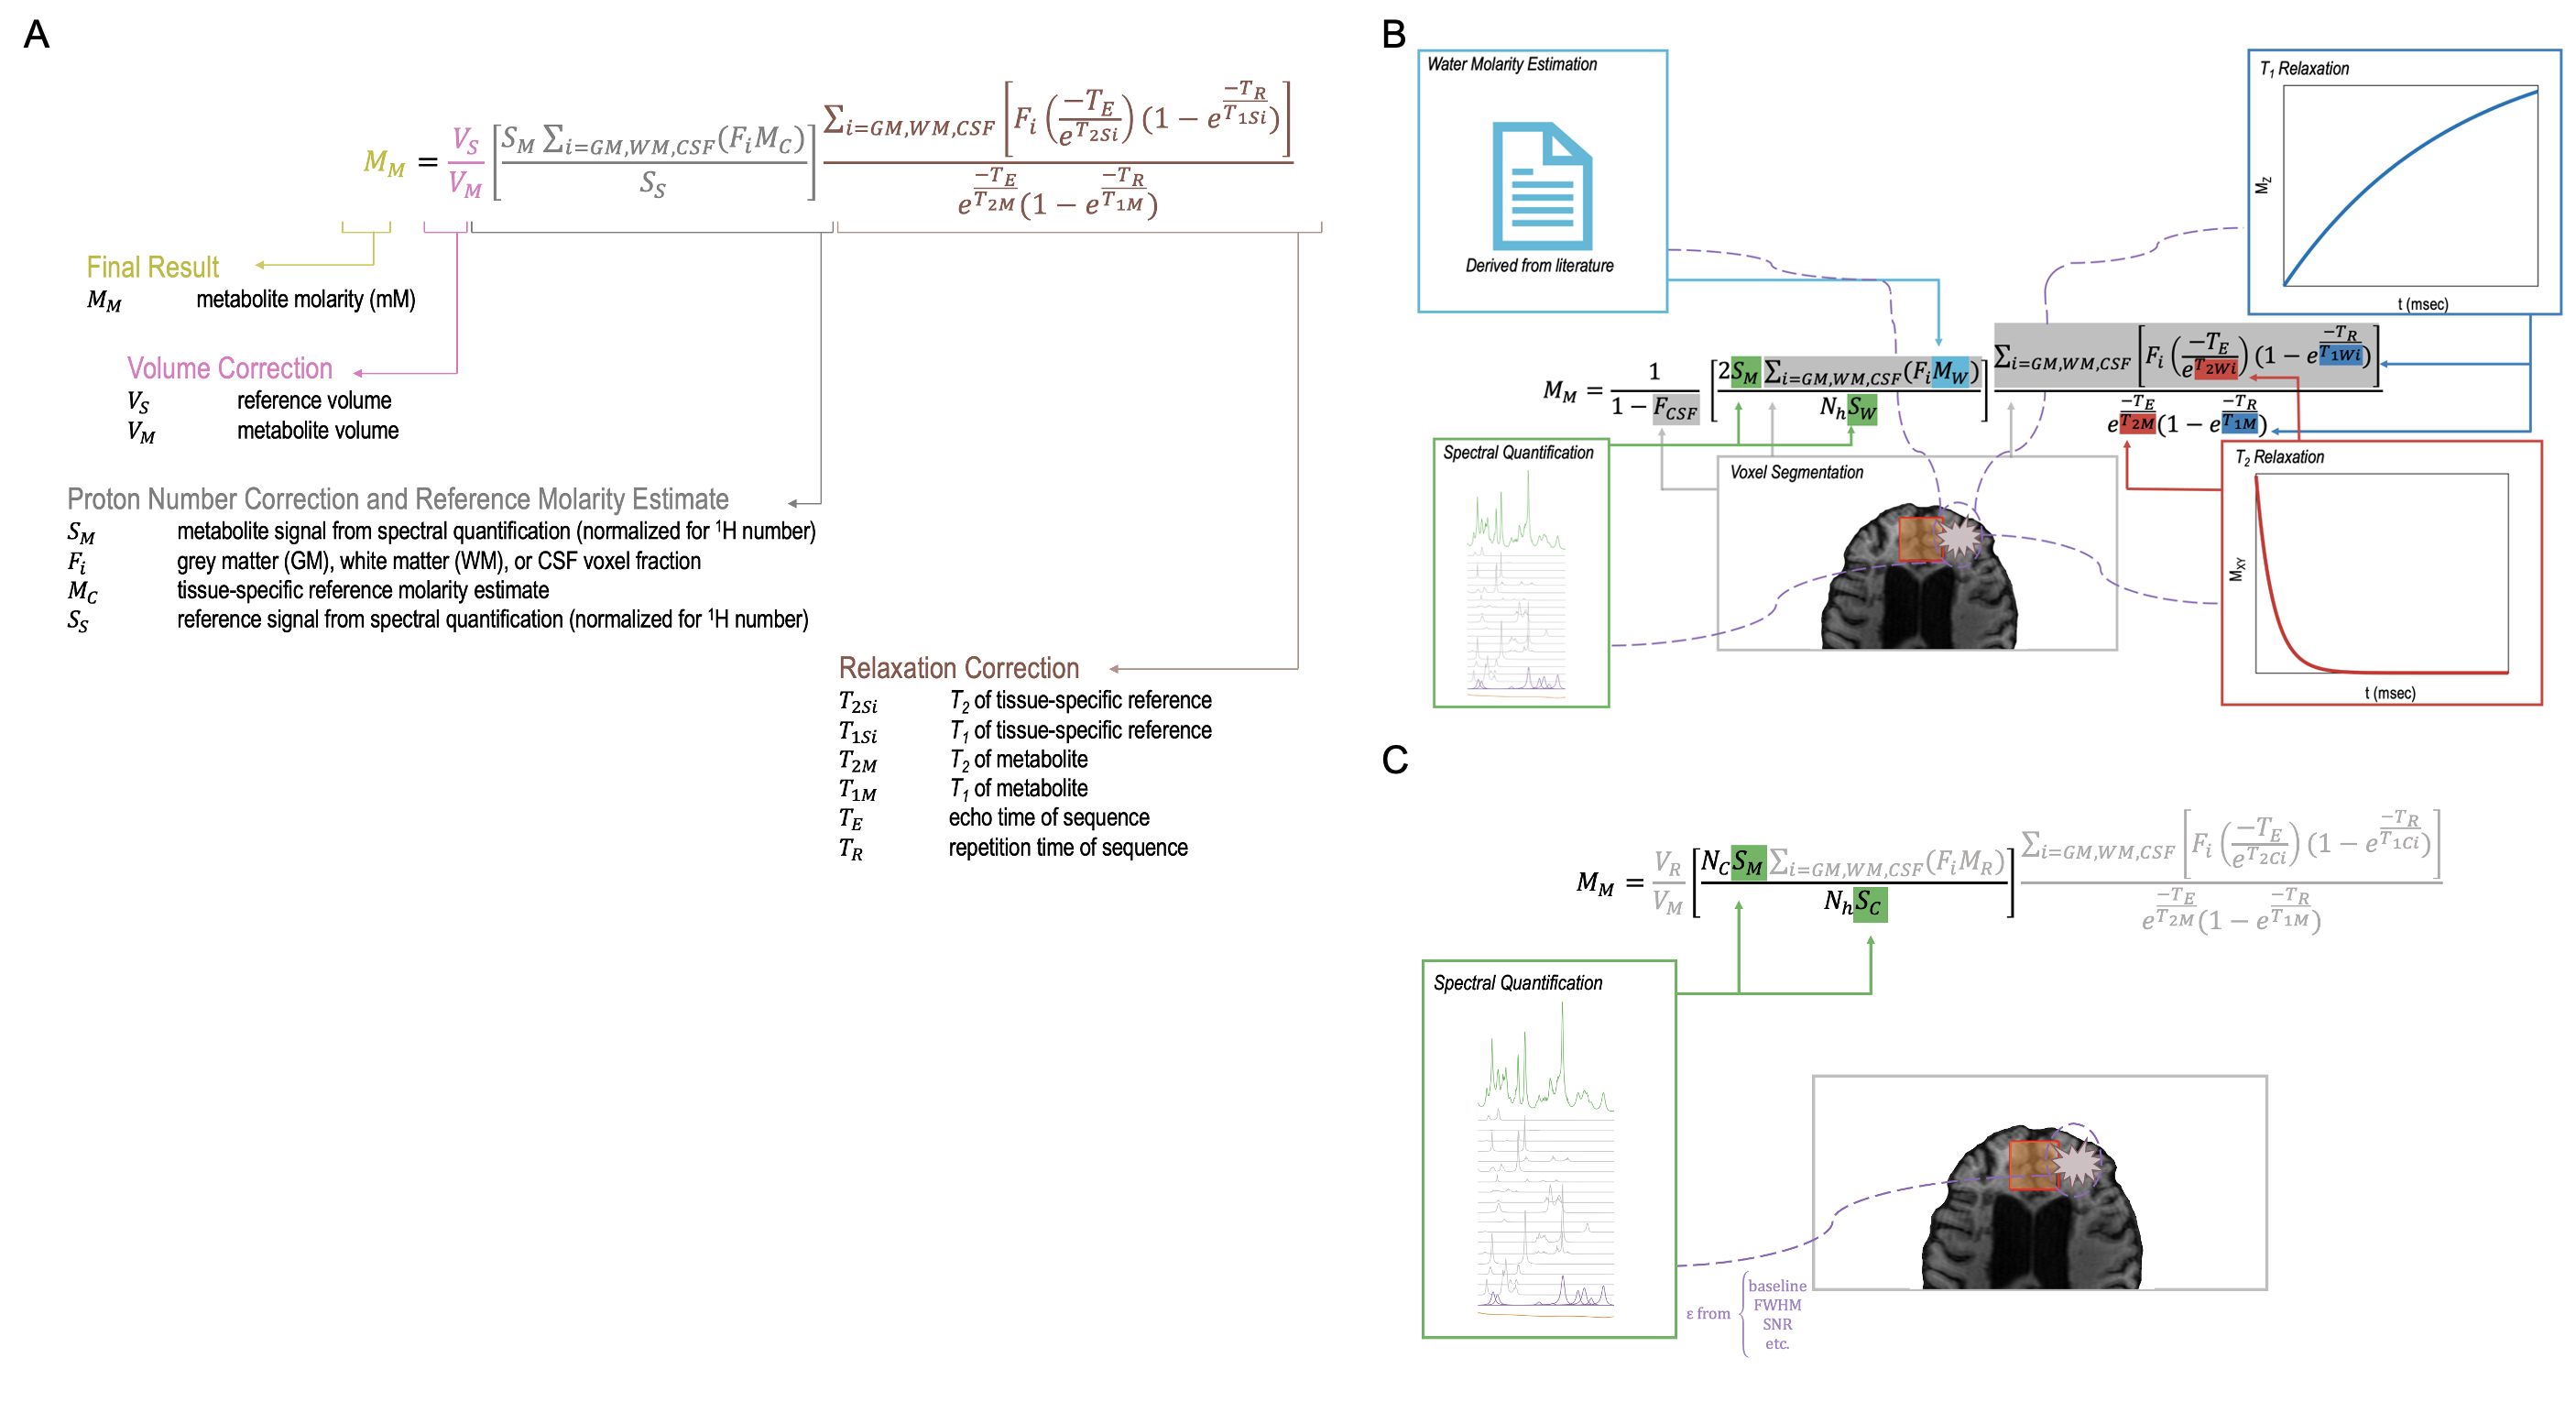
Proton magnetic resonance spectroscopy (1H-MRS) can provide insight into the disease processes of multiple sclerosis by identifying in vivo metabolic changes in tissues like the brain1,2. These metabolic changes can be physically contextualized via absolute quantification, translating a 1H-MRS signal to a millimolar metabolite concentration through normalizing by a reference signal like water3. Tissue lesions seen in multiple sclerosis may confound several components of this step: tissue-specific estimated partial volumes, reference molarities4, and relaxivities, and spectral quantification of metabolite and reference signals (Figure 1). Here, we seek to characterize the relationships between lesion partial volumes in a 1H-MRS voxel and various components underlying water- and creatine-referenced metabolic concentration estimates derived therein in patients with multiple sclerosis to provide a window into how tissue-level changes in this condition may affect apparent metabolite concentrations.Methods
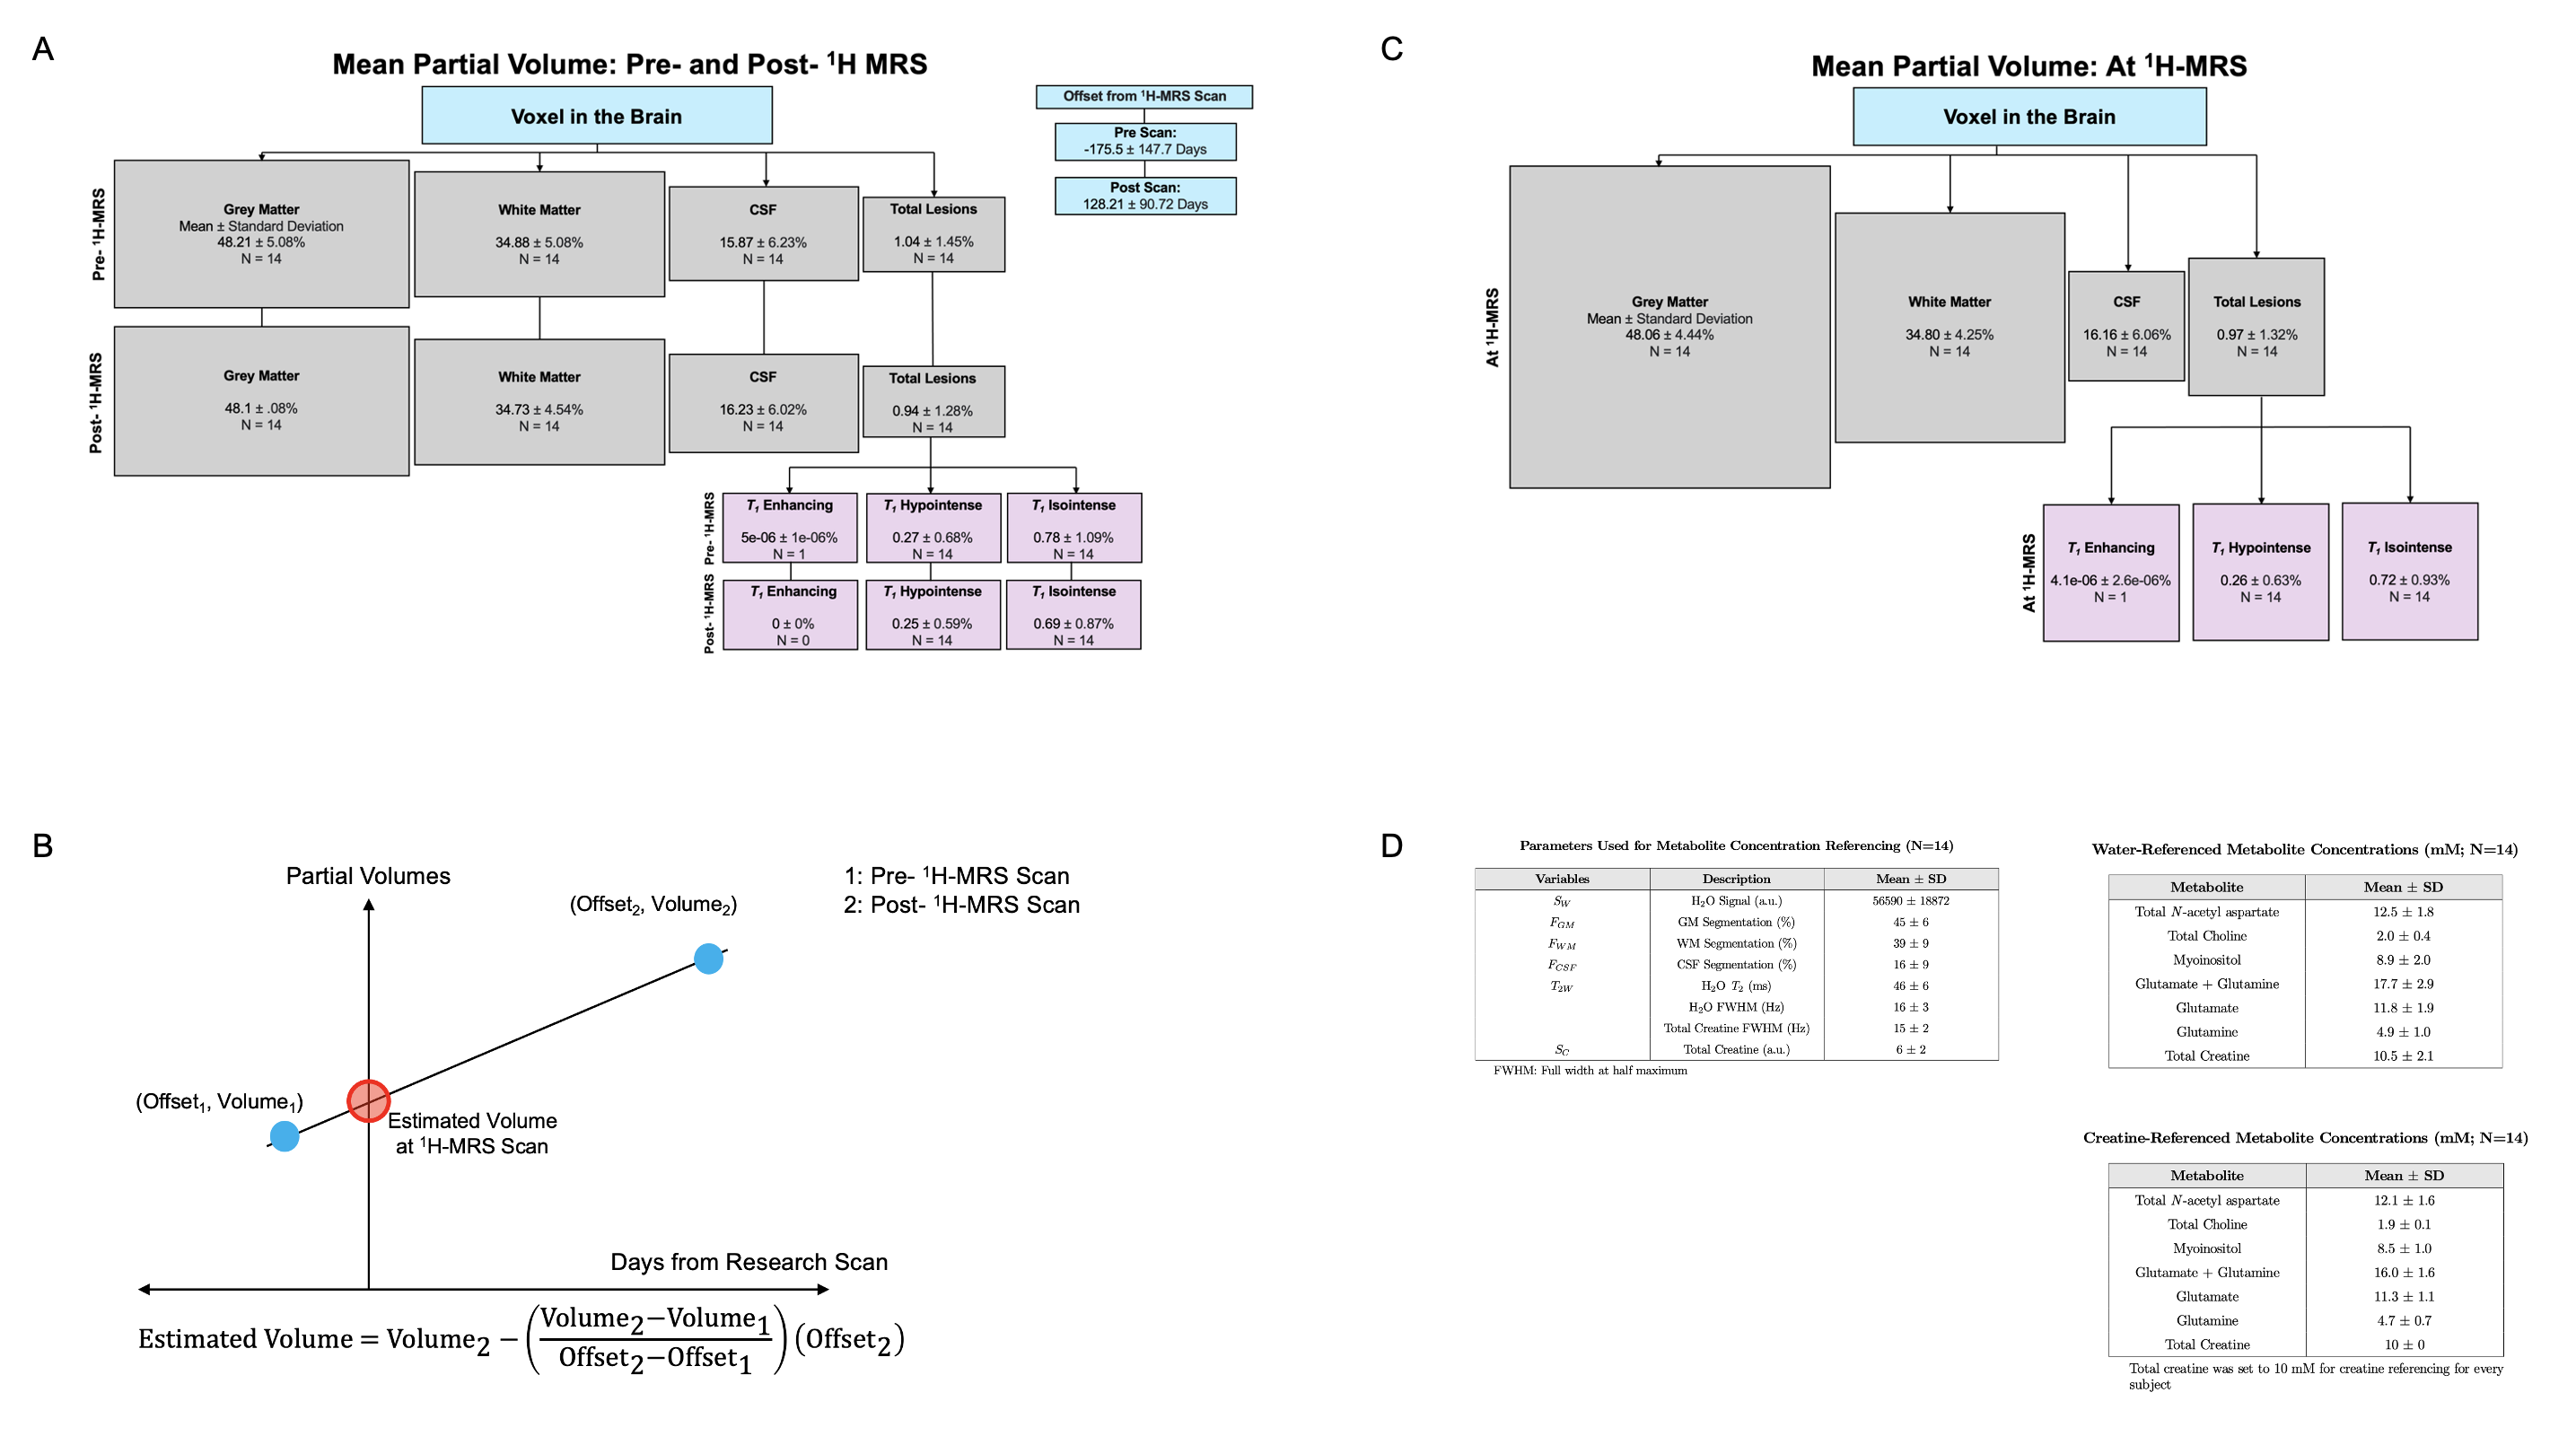
One-hour 7-Tesla head-only (Varian Medical Systems, Palo Alto, CA, USA) MR scans were completed on N=14 participants with relapsing-remitting (RR-MS; 6w, 2m; mean±standard deviation 41±12 y.o.) or progressive (P-MS; 5w, 1m; 58±8 y.o.) multiple sclerosis5. Voxel (27-cm3 isotropic) placement in medial prefrontal cortex and 1H-MRS acquisition proceeded as reported previously5 via macromolecule-suppressed STEAM (TE=10 ms; TM=50 ms; TR=3 s) for glutamate and other metabolites and MEGA-sLASER (TE=72 ms; TR=3 s) for glutathione or GABA5. Spectral processing was performed in INSPECTOR6, and spectral quantification in LCModel7 using simulated bases5. Metabolites were absolutely quantified using internal voxel water and assumed constant water T2, or internal voxel creatine at an assumed 10 mM concentration, as previously described5.A pipeline for observing lesions within the 1H-MRS voxel was developed. This included co-registering experimental T1-weighted images5 with 3-Tesla clinical images (Skyra, Siemens Healthineers, Erlangen, Germany), including 3D T2-weighted FLAIR (TE=396 ms, TR=5 s, FOV=160x192x256 mm3) and 3D T1-weighted images with and without gadolinium contrast (TE=3.22 ms, TR=2 s, FOV=160x208x256 mm3) (N=10; N=2 RR-MS and N=2 P-MS participants exhibited divergent scan parameters), received at the minimum possible offsets before and after the 1H-MRS experiment (Figure 2). Automated segmentation of T2-weighted FLAIR hyperintensities8 estimated total lesions. Active lesion absence was confirmed using gadolinium-enhanced T1-weighted images, and T1-weighted hypointense (vs. isointense) lesions were segmented within the total lesion volume using Freesurfer v6.09 in non-gadolinium-enhanced T1-weighted images, after which lesion masks were subtracted for automatic segmentation of remaining grey matter, white matter, and CSF in SPM810. Segmented clinical T1-weighted scans were then co-registered in FSL11,12 with the research T1-weighted scans for final estimation of total lesions (including hypointense and isointense), grey matter, white matter, and CSF in the 1H-MRS voxel. Voxel partial volumes of lesion, grey matter, white matter, and CSF at 1H-MRS acquisition were then linearly interpolated (Figure 2).
Total and T1-isointense lesion volumes were compared with quantification referencing inputs via either water (Figure 1B) or creatine (Figure 1C), including voxel water signal; tissue volumes estimated without considering lesions5; voxel water T2 measured with a dedicated multi-TE MRS approach 5,13; total creatine signal; and spectral quantification confounds14 including water and total creatine singlet width, using linear models and Pearson or Spearman correlation. Shapiro-Wilk test assessed variable and model residual normality; p-values were adjusted by Benjamini-Hochberg correction15. Statistics were calculated in R (v.3.4.4) with α=0.05.
Results
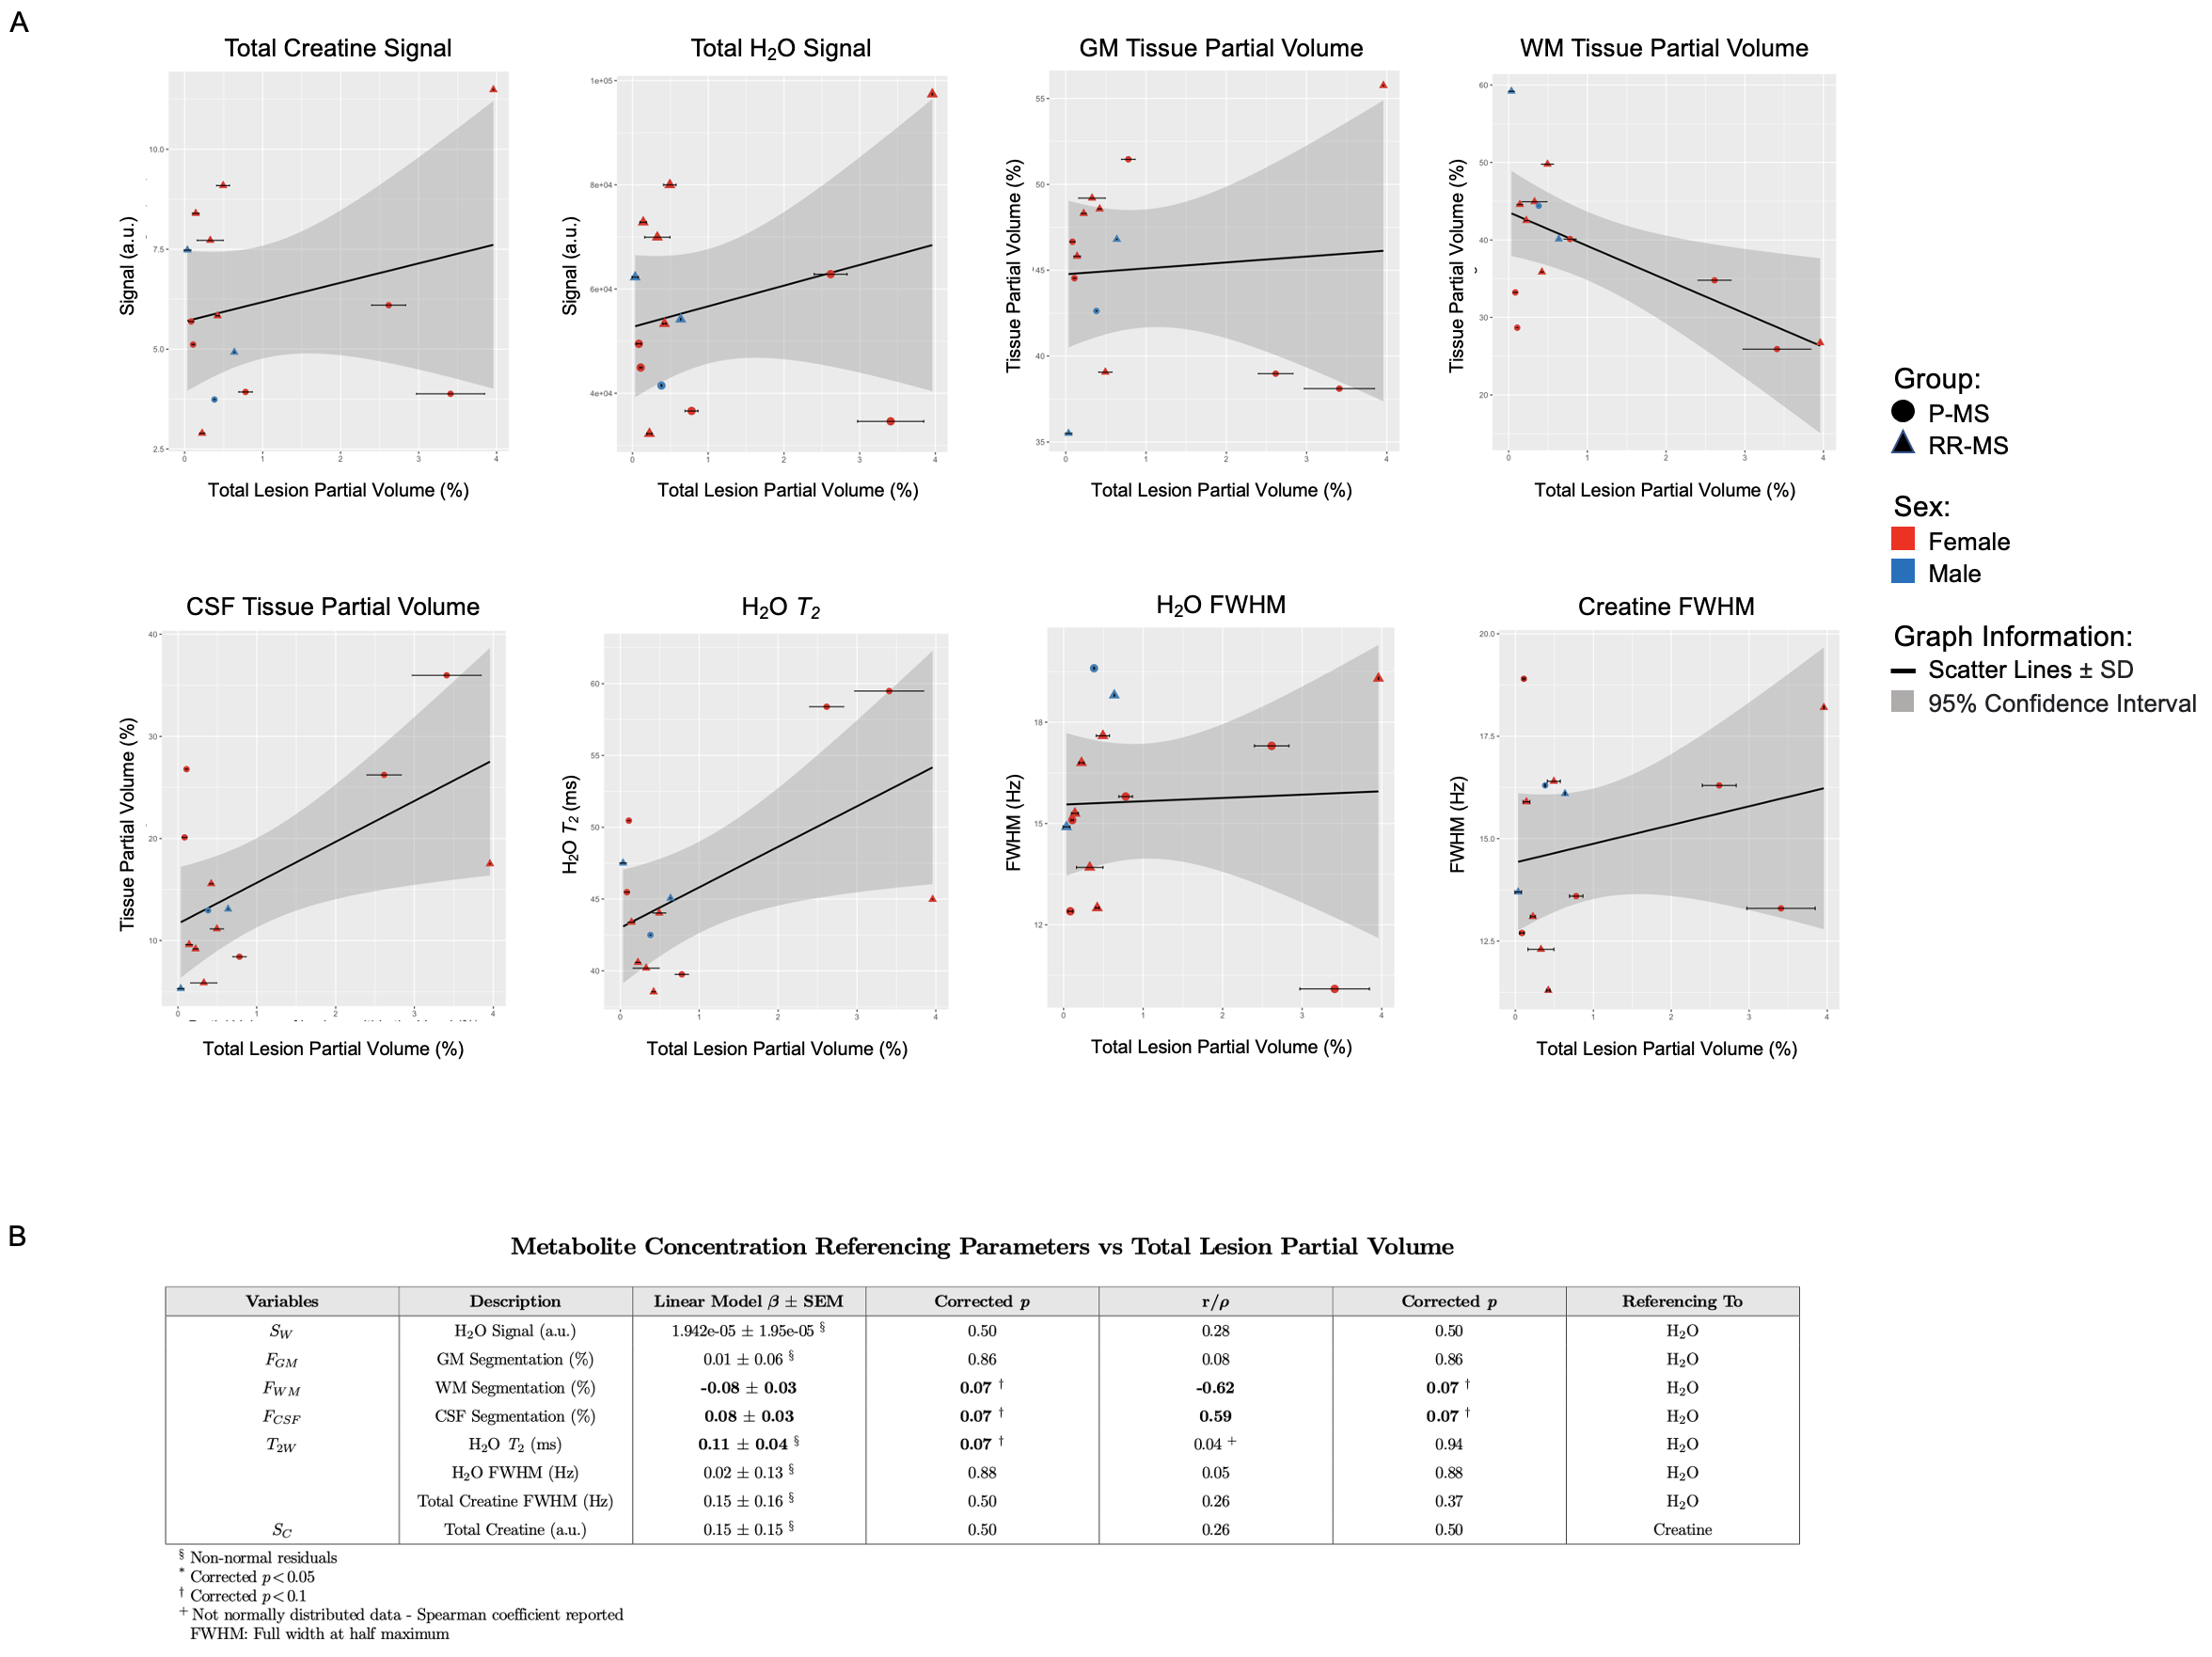
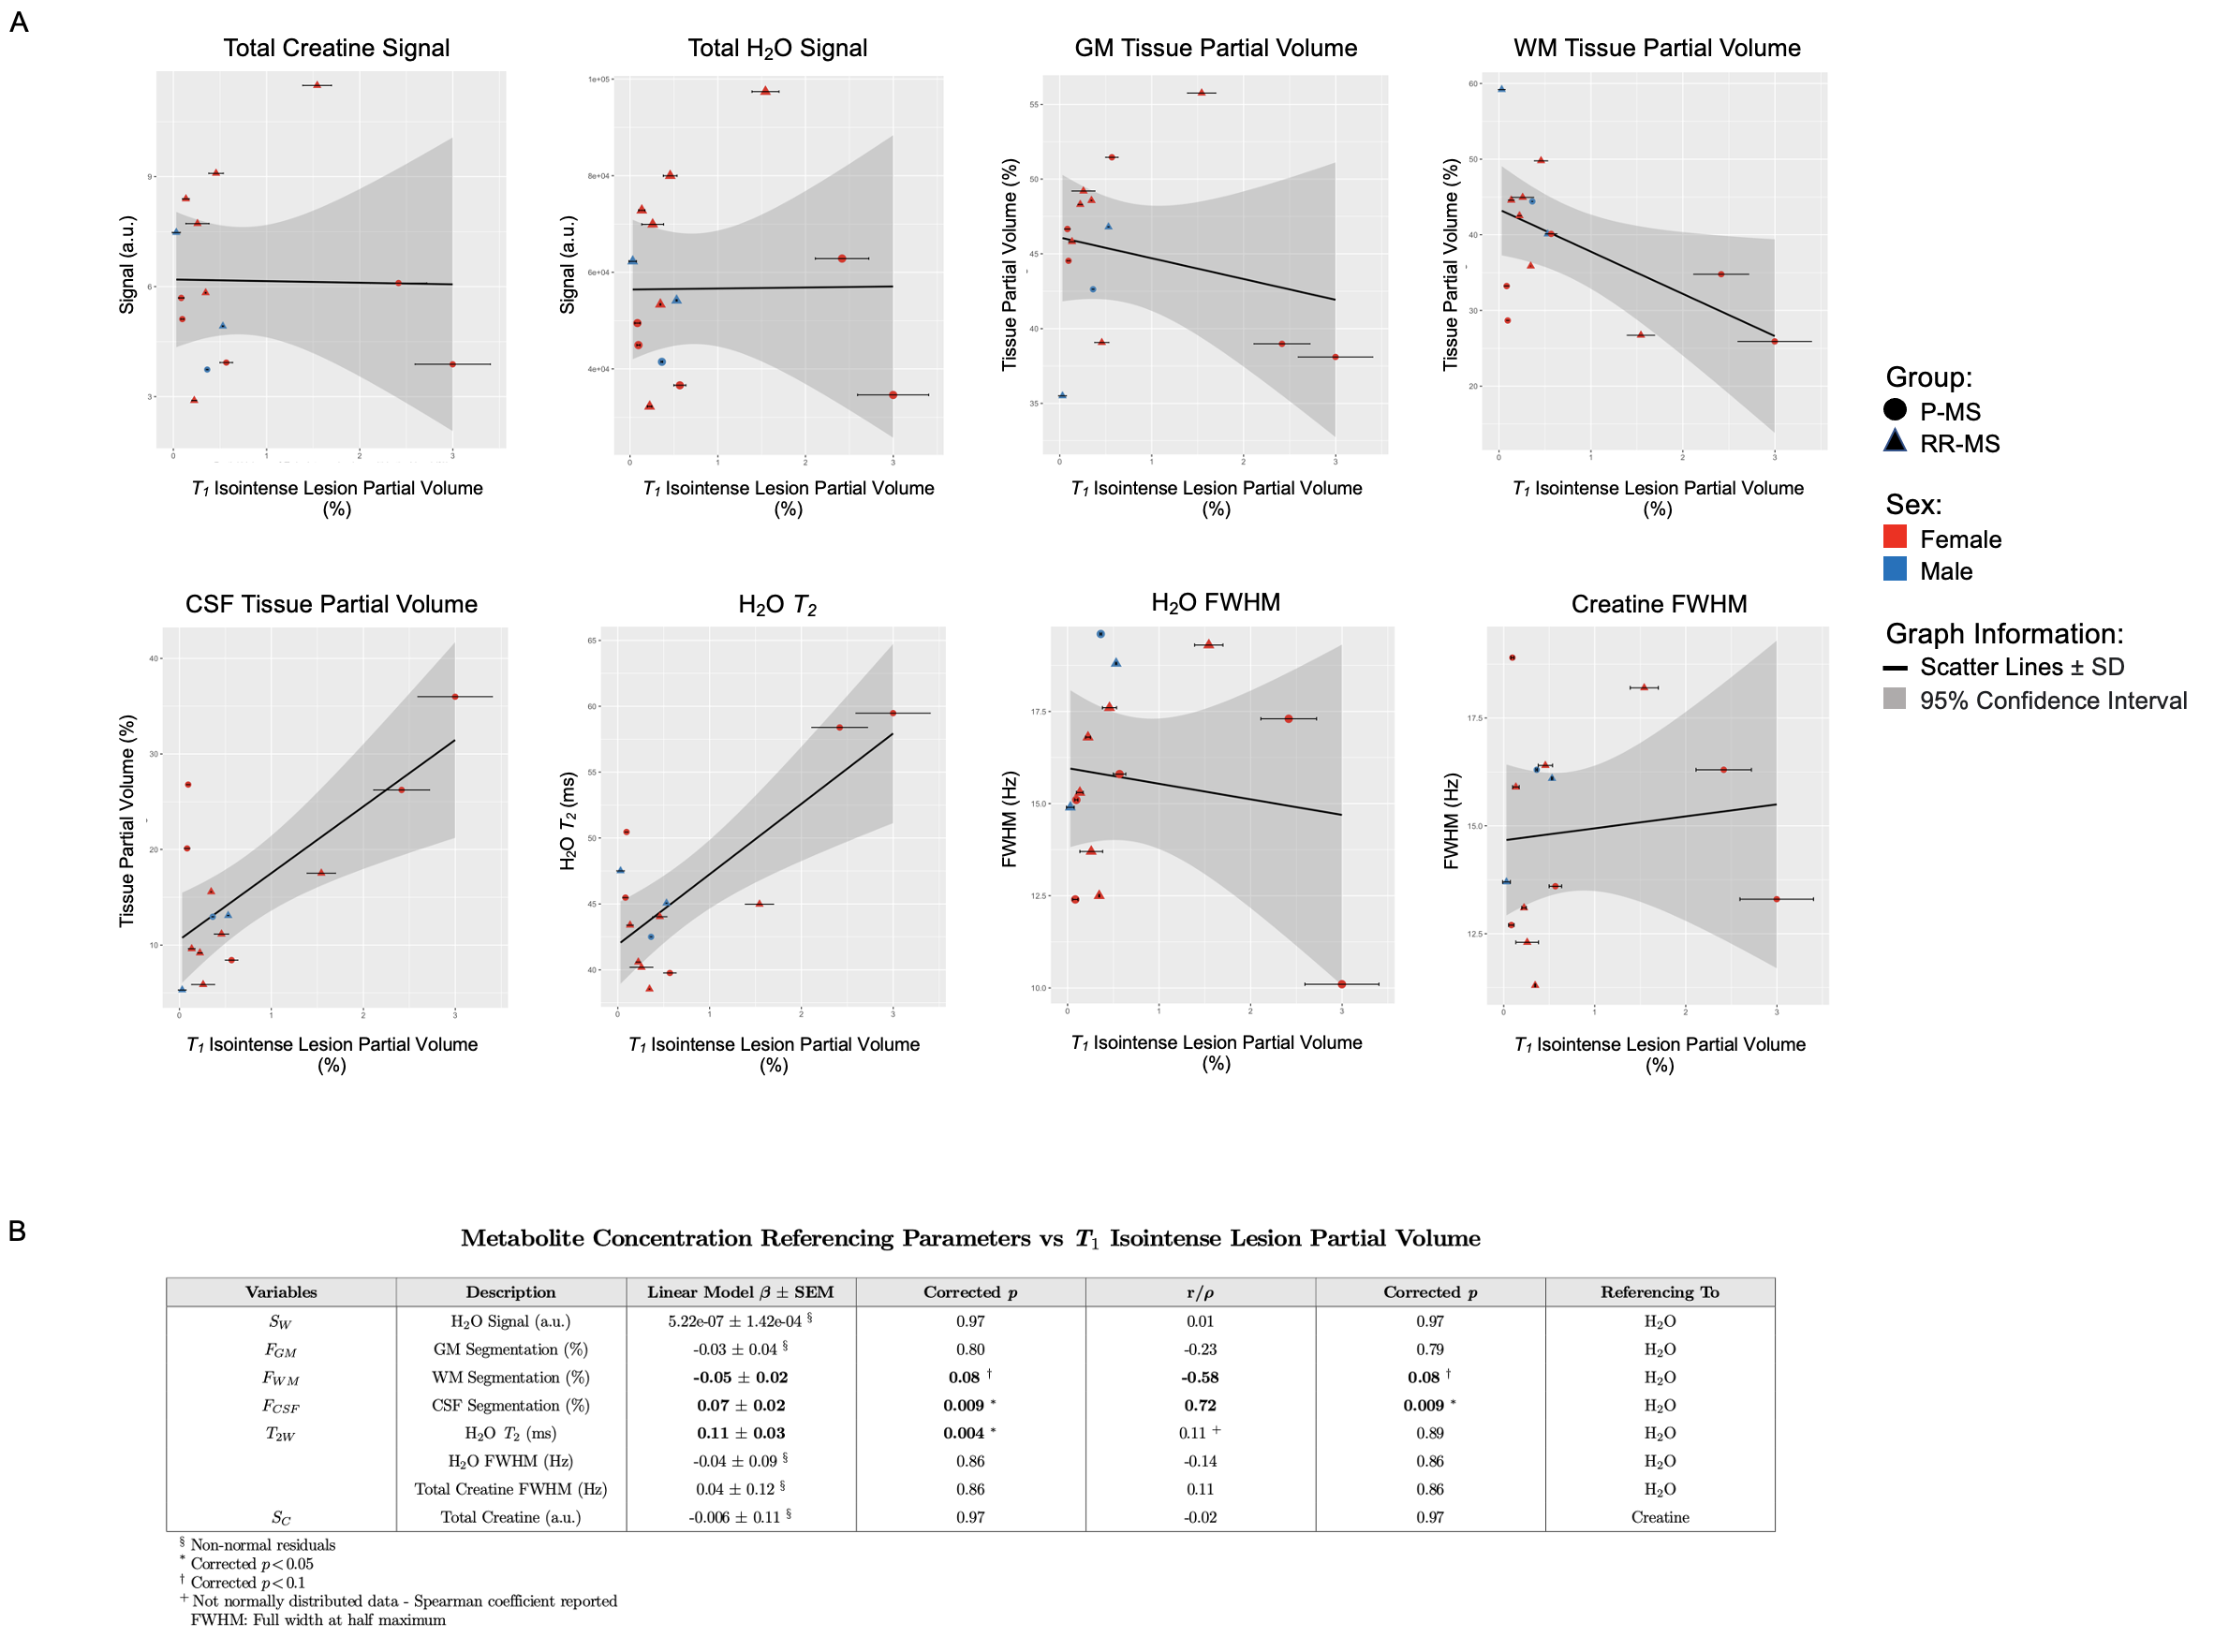
Linear regression (β=0.08±0.03, p=0.07) and Pearson correlation (r=0.59, p=0.07) both revealed a trending positive relationship between total lesion volume and apparent CSF partial volume in normal-appearing T1-weighted voxels assumed lesion-less; the opposite was seen for apparent white matter partial volume (β=-0.08±0.03, r=-0.62, p=0.07). A trending positive linear relationship between total lesion volume and voxel water T2 (β=0.11±0.04, p=0.07) was noted (Figure 3).Among isointense lesions only, lesion volume varied positively with CSF partial volume of voxels assumed lesion-less (β=0.07±0.02, r=0.72, p=0.009), while a negative relationship was observed with apparent white matter partial volume (β=-0.05±0.02, r=-0.58, p=0.08). A positive linear relationship between isointense lesion volume and voxel water T2 (β=0.11±0.03, p=0.004) was noted (Figure 4).
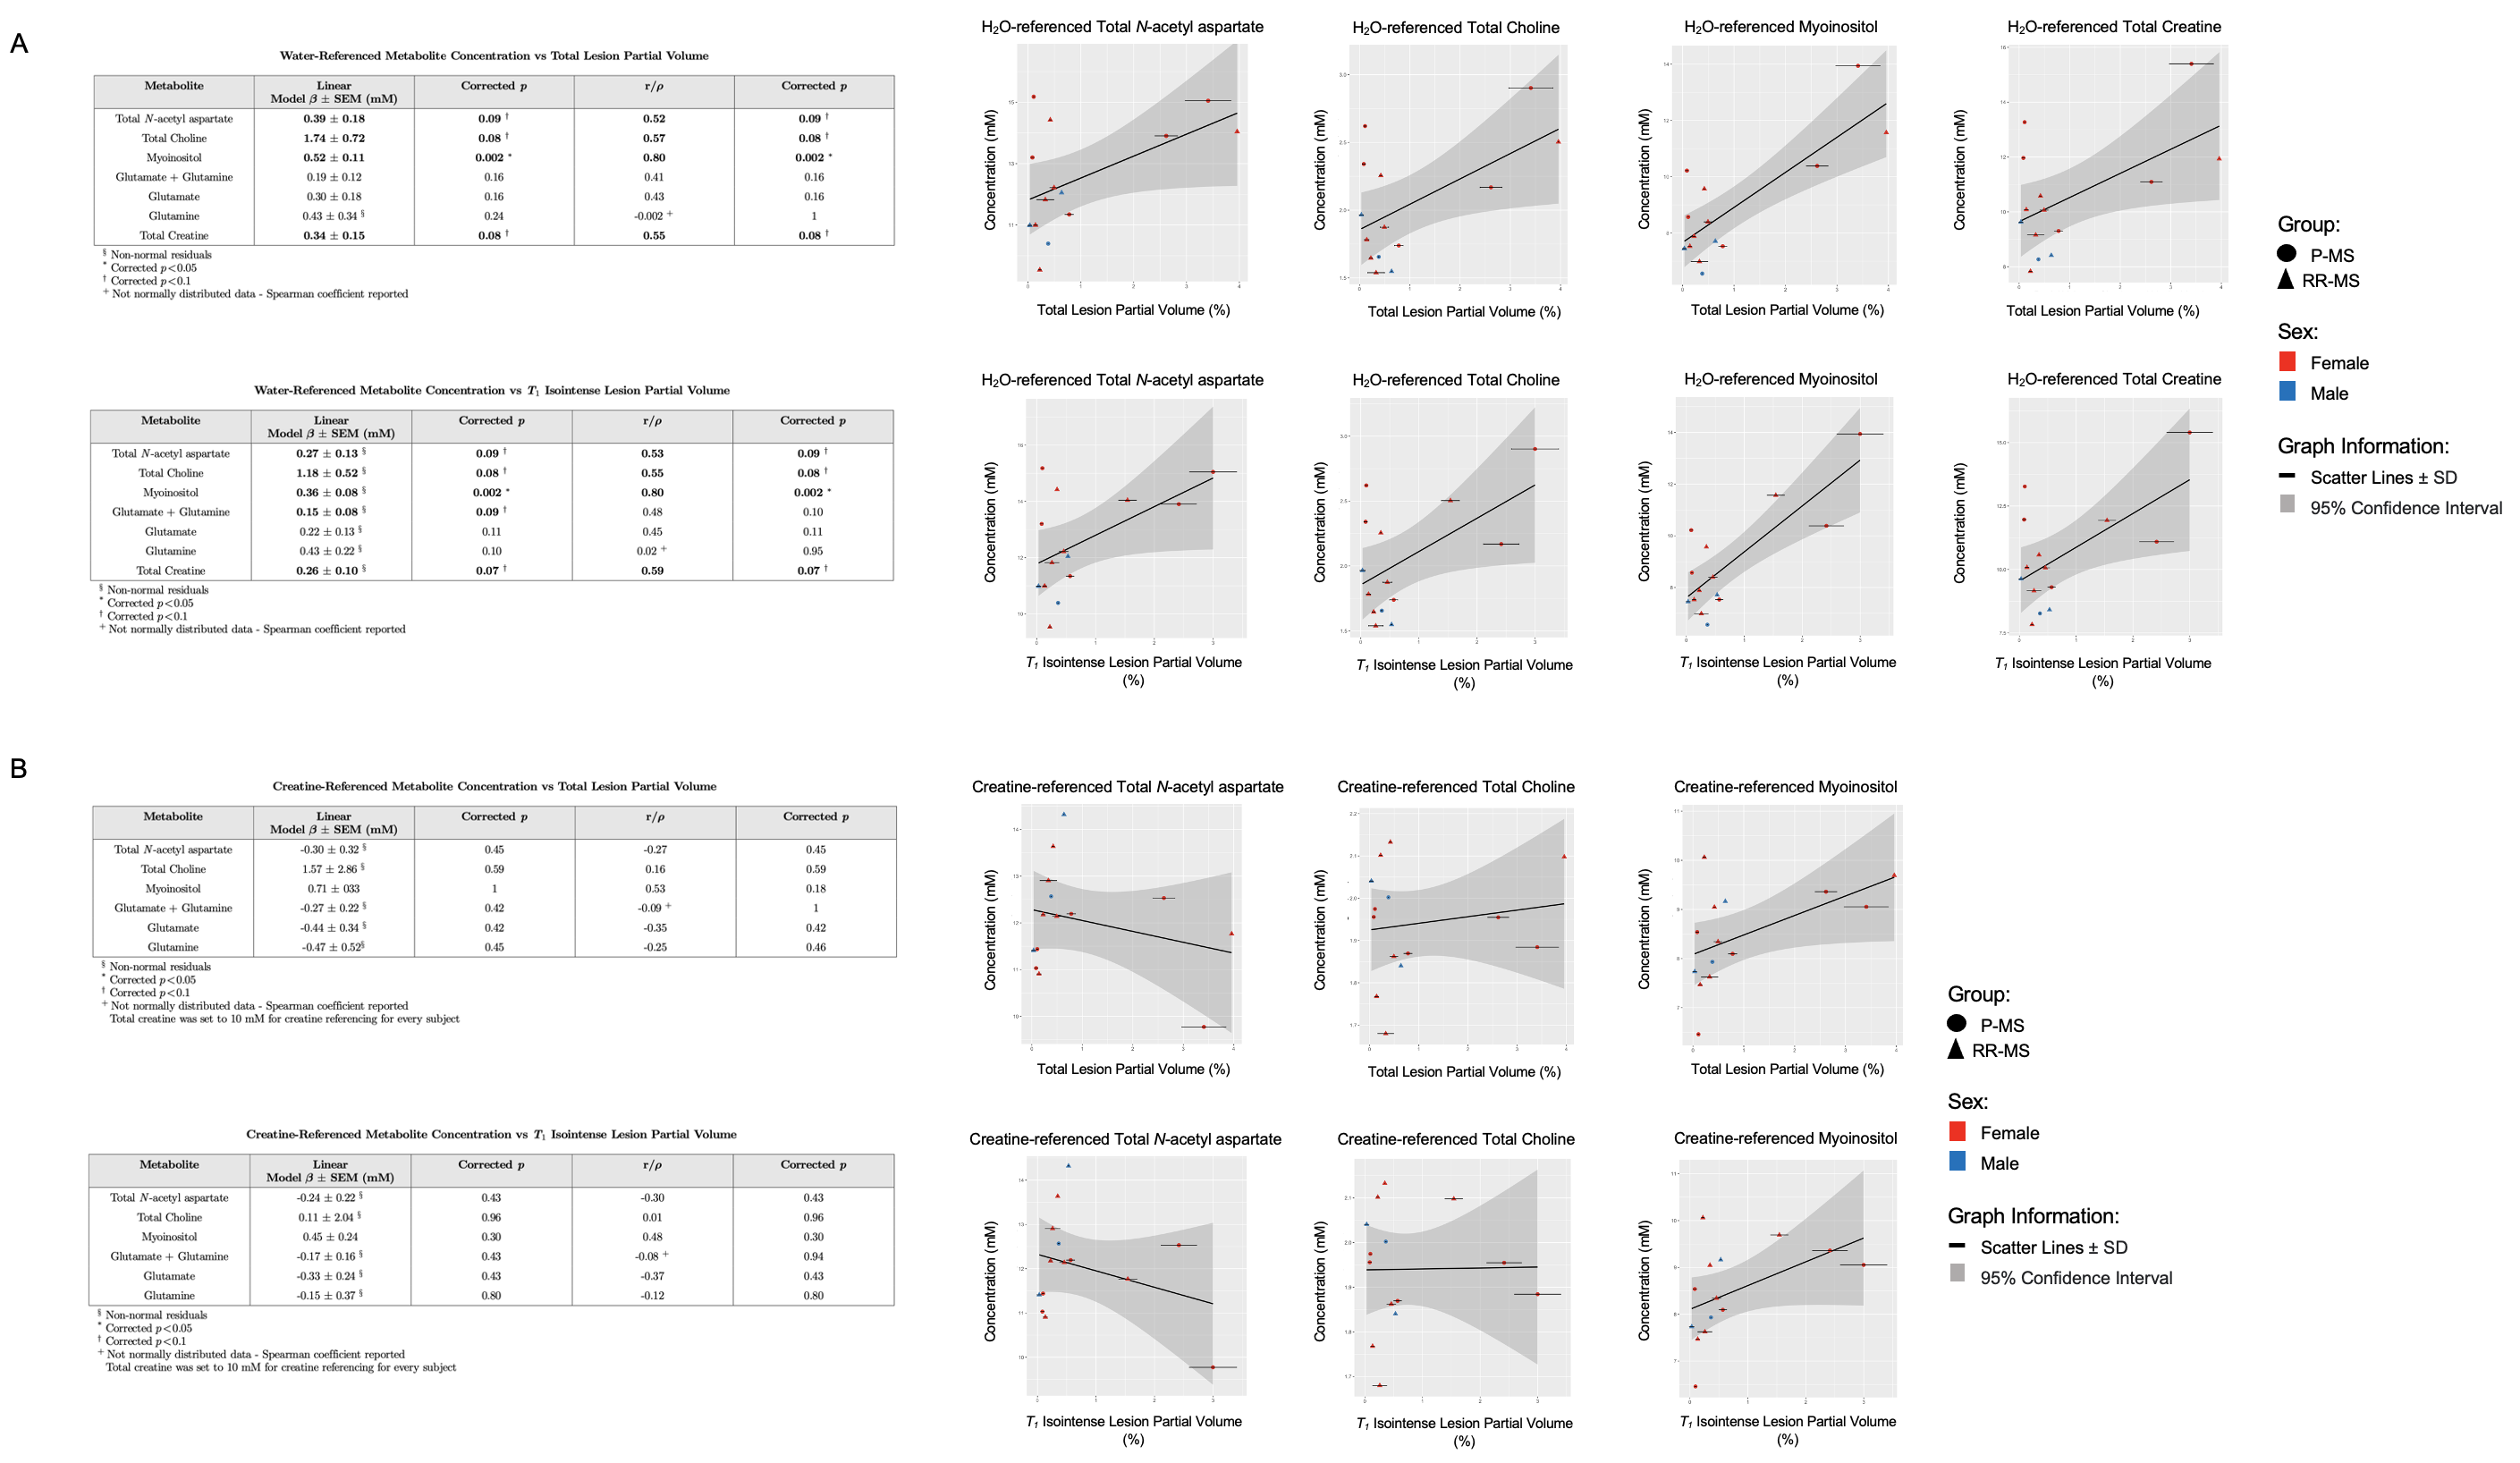
Voxel total lesion and T1-isointense lesion volume exhibited positive relationships with myoinositol (β=0.52±0.11, β=0.36±0.08, r=0.80, p=0.002) and trending positive relationships with N-acetyl aspartate (β=0.39±0.18, β=0.27±0.13, r=0.53, r=0.52, p=0.09), total choline (β=1.74±0.72, β=1.18±0.52, r=0.57, r=0.55, p=0.08), and total creatine (β=0.34±0.15, r=0.55, p=0.08; β=0.26±0.10, r=0.59, p=0.07) when referenced to water; no relationships were observed with creatine-referenced metabolites (Figure 5).
Conclusions
We have shown that:- As suggested by the previously demonstrated influence of lesions on segmentation error16, T2-hyperintense multiple sclerosis lesion volumes within 1H-MRS voxels varied positively with apparent voxel CSF, and negatively with white matter, segmented without consideration of lesions. This was especially true for T1-isointense lesions, implying the potential for mis-segmenting voxel lesions as CSF at the expense of white matter when lesions are not explicitly considered.
- Voxel lesion volume varied with at least one other potential confound to metabolite concentration estimation by internal water referencing, namely water T2.
- Voxel total lesion and T1-isointense volume varied positively with several metabolites when referenced to internal water but not to creatine, as would be predicted by CSF overestimation.
Taken together, these findings suggest the importance of considering the potential confounding influence of lesions present within the volume of interest when performing absolute quantification of 1H-MRS metabolites, especially via water, in individuals with multiple sclerosis.
Acknowledgements
Special thanks are due to Ms. Yvette Strong at the Yale Center for Clinical Investigation and the physician and nursing staff at the Yale-New Haven Hospital Interventional Immunology Clinic for their invaluable help in patient recruitment. This research was made possible by the National Multiple Sclerosis Society (NMSS) grant “In Vivo Metabolomics of Oxidative Stress with 7 Tesla Magnetic Resonance Spectroscopy“ (RG 5319) and falls within the purview of Yale Medical School Human Investigation Committee protocol #1107008743 and Columbia University Institutional Review Board protocol AAAQ9795. This work was supported by grant R01 EB030560 from the National Institutes of Health.
References
1. K. M. Swanberg, K. Landheer, D. Pitt, C. Juchem, "Multiple Sclerosis by in vivo Proton Magnetic Resonance Spectroscopy: Current Challenges and Future Outlook in the Translation From Proton Signal to Diagnostic Biomarker," Front Neurol, vol. 10, p. 1173, 2019.
2. J. Near, A. D. Harris, C. Juchem, R. Kreis, M. Marjńska, G. Öz, J. Slothboom, M. Wilson, C. Gasparovic, "Preprocessing, analysis and quantification in single-voxel magnetic resonance spectroscopy: experts' consensus recommendations," NMR Biomed, vol. 34, no. 5, p. 4257, May 2021.
3. G. Helms, "The principles of quantification applied to in vivo proton MR spectroscopy," European Journal of Radiology, vol. 67, p. 218-229, 2008.
4. T. Ernst, R. Kreis, B. D. Ross, "Absolute Quantification of Water and Metabolites in the Human Brain. I. Compartments and Water," Journal of Magnetic Resonance, vol. 102, no. 1, p. 1-8, 1993.
5. K. M. Swanberg, H. Prinsen, K. DeStefano, M. Bailey, A. Kurada, D. Pitt, R. Fulbright, C. Juchem, "In vivo evidence of differential frontal cortex metabolic abnormalities in progressive and relapsing-remitting multiple sclerosis," NMR Biomed, vol. 34, no. 11, p. 4590, Nov 2021.
6. M. Gajdošík, K. Landheer, K. M. Swanberg, C. Juchem, "INSPECTOR: free software for magnetic resonance spectroscopy data inspection, processing, simulation and analysis". Sci Rep 11, 2094, (2021); Juchem, C. INSPECTOR - Magnetic Resonance Spectroscopy Software, <http://innovation.columbia.edu/technologies/cu17130_inspector> (2016).
7. S. W. Provencher, "Estimation of metabolite concentrations from localized in vivo proton NMR spectra," Magnetic Resonance in Medicine, vol. 30, no. 6, p. 672-679, 1993.
8. K. C. Igwe, P. J. Lao, R. S. Vorburger, A. Banerjee, A. Rivera, A. Chesebro, K. Laing, J. J. Manly, A. M. Brickman, "Automatic quantification of white matter hyperintensities on T2-weighted fluid attentuated inversion recovery magnetic resonance imaging," Magnetic Resonance Imaging, vol. 85, p. 71-79, 2022.
9. A. M. Dale, B. Fischl, M. I. Sereno, "Cortical surface-based analysis. I. Segmentation and surface reconstruction," NeuroImage, vol. 9, no. 2, p. 179-194, 1999.
10. J. L. Whitwell, "Voxel-based morphometry: an auotmated technique for assessing structural changes in the brain," The Journal of Neuroscience: The Official Journal of the Society of Neuroscience, vol. 29. no. 31, p. 9661-9664, 2009.
11. M. Jenkinson and S. M. Smith, "A global optimisation method for robust affine registration of brain images," Medical Image Analysis, vol. 5, no. 2, p. 143-156, 2001.
12. M. Jenkinson, P. R. Bannister, J. M. Brady, S. M. Smith, "Improved optimization for the robust and accurate linear registration and motion correction of brain images," NeuroImage, vol. 17, no. 2, p. 825-841, 2002.
13. K. M. Swanberg, H. Prinsen, A. V. Kurada, K. Destefano, M. Bailey, D. Pitt, R. K. Fulbright, C. Juchem, "Towards in vivo neurochemcial profiling of multiple sclerosis with MR spectroscopy at 7 Tesla: Apparent increase in frontal cortex water T2 in aged individuals with progressive multiple sclerosis stabilizes in biexponential model constrained by tissue partial volumes," Proc Int Soc Magn Reson Med, 0161, 2018.
14. K. M. Swanberg, H. Prinsen, C. Juchem, "Spectral quality differentially affects apparent metabolite concentrations as estimated by linear combination modeling of in vivo magnetic resonance spectroscopy data at 7 Tesla," Proc Int Soc Magn Reson Med, 4237, 2019.
15. "P.adjust; Adjust P-values for multiple comparisons," R Package Documentation. [Online]. Available: https://rdrr.io/r/stats/p.adjust.html.
16. M. Battaglini, M. Jenkinson, N. De Stefano, "Evaluating and reducing the impact of white matter lesions on brain volume measurements," Hum Brain Map, vol. 33, no. 9, p. 2062-2071, 2012.
Figures