2834
A pilot in vivo study of the sciatic nerve in multiple sclerosis using quantitative magnetic resonance imaging
Ratthaporn Boonsuth1,2, Marco Battiston1, Rebecca S. Samson1, Alberto Calvi1,3, Claudia A. M. Gandini Wheeler-Kingshott1,4,5, and Marios C. Yiannakas1
1NMR Research Unit, Queen Square MS Centre, Department of Neuroinflammation, UCL Queen Square Institute of Neurology, University College London, London, United Kingdom, 2Department of Radiologic Technology, Faculty of Associated Medical Sciences, Chiang Mai University, Chiang Mai, Thailand, 3Center of Neuroimmunology, Laboratory of Advanced Imaging in Neuroimmunological Diseases; Institut d’Investigacions Biomèdiques August Pi i Sunyer (IDIBAPS), Barcelona, Spain, 4Brain Connectivity Research Centre, IRCCS Mondino Foundation, Pavia, Italy, 5Department of Brain and Behavioural Sciences, University of Pavia, Pavia, Italy
1NMR Research Unit, Queen Square MS Centre, Department of Neuroinflammation, UCL Queen Square Institute of Neurology, University College London, London, United Kingdom, 2Department of Radiologic Technology, Faculty of Associated Medical Sciences, Chiang Mai University, Chiang Mai, Thailand, 3Center of Neuroimmunology, Laboratory of Advanced Imaging in Neuroimmunological Diseases; Institut d’Investigacions Biomèdiques August Pi i Sunyer (IDIBAPS), Barcelona, Spain, 4Brain Connectivity Research Centre, IRCCS Mondino Foundation, Pavia, Italy, 5Department of Brain and Behavioural Sciences, University of Pavia, Pavia, Italy
Synopsis
Keywords: Multiple Sclerosis, Quantitative Imaging, Nerves, Multimodal, Neurography
The peripheral nervous system is not routinely examined objectively in multiple sclerosis (MS), despite evidence from neuropathology that demonstrates its implication. In this pilot in vivo study, the sciatic nerve was examined using multi-shell diffusion-weighted imaging, quantitative magnetisation transfer and T1 relaxometry to investigate whether pathological neural tissue damage could be detected in people with relapsing-remitting MS as compared to healthy controls.Introduction
Multiple sclerosis (MS) has long been considered a central nervous system (CNS) disorder, characterised by diffuse demyelination and axonal degeneration. However, neuropathological, electrophysiological, and imaging investigations have demonstrated that the peripheral nervous system (PNS) is also involved in MS, with demyelination and axonal degeneration representing the main pathophysiological processes1-3.Magnetic resonance imaging (MRI), specifically magnetic resonance neurography (MRN), has previously been used to explore the PNS in a wide spectrum of neurological conditions. Moreover, MRN has been used to facilitate semi-quantitative MRI (qMRI) investigations, which provide more specific information about neural tissue composition, thus allowing a better understanding of the pathophysiological mechanisms involved3-6. Given the neuropathological evidence that demyelination and, to a lesser extent, axonal degeneration are the primary pathophysiological mechanisms of damage in the PNS in MS, emerging qMRI methods, previously validated in the CNS, such as multi-shell diffusion-weighted imaging (DWI), quantitative magnetization transfer (qMT) and T1 relaxometry, would also be relevant in the context of PNS investigations in MS.
The pilot study aimed to apply the aforementioned qMRI methods to the PNS of people with relapsing-remitting MS (RRMS) and to determine whether these methods are sensitive to neural tissue damage in the sciatic nerve as compared to healthy controls (HCs).
Methods
Participants: Fifteen HCs (mean age 33.8 years, 9 female, range 25-44) and 15 people with RRMS (mean age 39.7 years, 10 female, range 29-46) were recruited. Written informed consent was obtained from all study participants and the study was approved by local ethical committees.MR imaging: A 3T Philips Ingenia CX MRI system was used with the product SENSE spine and torso coils. In all participants the right sciatic nerve (upper thigh) was examined; both sciatic nerves were first located using the 3D ‘nerve-SHeath signal increased with INKed rest-tissue RARE Imaging’ (SHINKEI) sequence acquired in the coronal plane with a large field-of-view (FOV)7,8 (Figure 1A). The parameters used were as follows: repetition time (TR)=2200ms, echo time (TE)=180ms, FOV=300×420 mm2, voxel size=1.2×1.2×2 mm3, number of excitations (NEX)=1, turbo spin-echo (TSE) factor=56, improved motion-sensitized driven-equilibrium (iMSDE) duration=50ms, 170 slices, scanning time 05:43 min. The 3D SHINKEI images were then used to facilitate the planning of high-resolution fat-suppressed T2-weighted and reduced FOV echo-planar imaging (ZOOM-EPI) acquisitions in the axial plane, for image segmentation and estimation of qMRI metrics, respectively. The following parameters were used for the fat-suppressed T2-weighted acquisition: TR=5000 ms, TE=60 ms, FOV=180×180 mm2, voxel size=0.5×0.5×4 mm3, NEX=1, TSE factor=11, 30 slices, scanning time of 08:08 min. The multi-modal qMRI protocol was performed in separate acquisitions using ZOOM-EPI in a unified readout fashion (i.e., same resolution and FOV), and with identical scan geometry to the high-resolution fat-suppressed T2-weighted acquisition, as follows:
- Multi-shell DWI acquisition: TR=4000ms, TE=80ms, FOV=64×40 mm2; voxel size=1×1×10 mm3; 12 slices; b-value=700s/mm2 (16 directions); b-value=1200s/mm2 (20 directions); b-value=2000s/mm2 (32 directions); 7 interleaved non-diffusion-weighted (b=0) images were also collected; scanning time=16:36 minutes.
- qMT with TE=51 ms; TR=7377ms; FOV=64×40mm2; voxel size=1x1x10mm3; 12 slices; 10 MT-weighted images; scanning time=9:13 minutes.
- T1 relaxometry with inversion recovery (IR) with TE=51ms; TR=8335ms; FOV=64×40mm2; voxel size=1x1x10mm3; 12 slices; 8 inversion times, scanning time=07:05 minutes.
Results
Table 1 shows the mean (SD) of all DWI metrics, T1 and BPF calculated in all HCs (n=15) and people with RRMS (n=15). Figure 2 shows example maps of standard DTI metrics i.e. fractional anisotropy (FA) and axial/radial/mean diffusivity (AD/RD/MD), DKI axial/radial/mean kurtosis (AK/RK/MK), the inversion recovery and qMT with the maps of T1 and BPF, respectively. Figure 3 shows the distribution of all qMRI metrics in HCs and people with RRMS.Discussion and Conclusion
In this pilot study, we present preliminary data from a qMRI assessment of the sciatic nerve in HCs and people with RRMS using multi-shell DWI, qMT and relaxometry for T1 mapping acquired with ZOOM-EPI in a unified readout fashion. Differences in the distribution of qMRI metrics between HCs and people with RRMS were demonstrated, with trends that are in agreement with histopathological studies in the literature. However, a larger sample population will be required to clarify the findings of this pilot study.Acknowledgements
This study is funded by the National Brain Appeal (MCY). Horizon2020 (Human Brain Project SGA3, Specific Grant Agreement No. 945539 ), BRC (#BRC704/CAP/CGW), MRC (#MR/S026088/1), Ataxia UK, MS Society (#77), Wings for Life (#169111). CGWK is a shareholder in Queen Square Analytics Ltd. RSS has received research funding from the UK MS Society (grant #77), CureDRPLA and Ataxia UK & we thank the UCL-UCLH Biomedical Research Centre for ongoing support.References
- Pollock M, Calder C, Allpress S. Peripheral nerve abnormality in multiple sclerosis. Ann Neurol. 1977;2:41-48
- Misawa S, Kuwabara S, Mori M, et al. Peripheral nerve demyelination in multiple sclerosis. Clin Neurophysiol. 2008;119:1829-1833.
- Jende J, Hauck GH, Diem R, et al. Peripheral nerve involvement in multiple sclerosis: Demonstration by magnetic resonance neurography. Ann Neurol. 2017;82:676-685
- Boonsuth R, Samson RS, Tur C, et al. Assessing Lumbar Plexus and Sciatic Nerve Damage in Relapsing-Remitting Multiple Sclerosis Using Magnetisation Transfer Ratio. Front Neurol. 2021;12:763143.
- Yiannakas MC, Schneider T, Yoneyama M, et al. Magnetisation transfer ratio combined with magnetic resonance neurography is feasible in the proximal lumbar plexus using healthy volunteers at 3T. Sci Rep. 2020;10(1):14568.
- Granziera C, Wuerfel J, Barkhof F, et al. Quantitative magnetic resonance imaging towards clinical application in multiple sclerosis. Brain. 2021;144(5):1296-1311.
- Yoneyama M, Takahara T, Kwee TC, Nakamura M, Tabuchi T. Rapid high resolution MR neurography with a diffusion-weighted pre-pulse. Magn Reson Med Sci. 2013;12(2):111-119.
- Kasper JM, Wadhwa V, Scott KM, et al. SHINKEI-a novel 3D isotropic MR neurography technique: technical advantages over 3DIRTSE-based imaging, Eur. Radiol. 2015;25(6):1672–1677.
- Jenkinson M, Smith S. A global optimisation method for robust affine registration of brain images. Med Image Anal. 2001;5(2):143-156.
- Modat M, Mcclelland J, Ourselin S. Lung registration using the NiftyReg package. Medical image analysis for the clinic-a grand Challenge. 2010;33-42.
- Hansen B, Jespersen SN. Data for evaluation of fast kurtosis strategies, b-value optimization and exploration of diffusion MRI contrast. Sci Data. 2016;3:160072. doi:10.1038/sdata.2016.72.
- Garyfallidis E, Brett M, Amirbekian B, et al. Dipy, a library for the analysis of diffusion MRI data. Front Neuroinform. 2014;8:8.
Figures
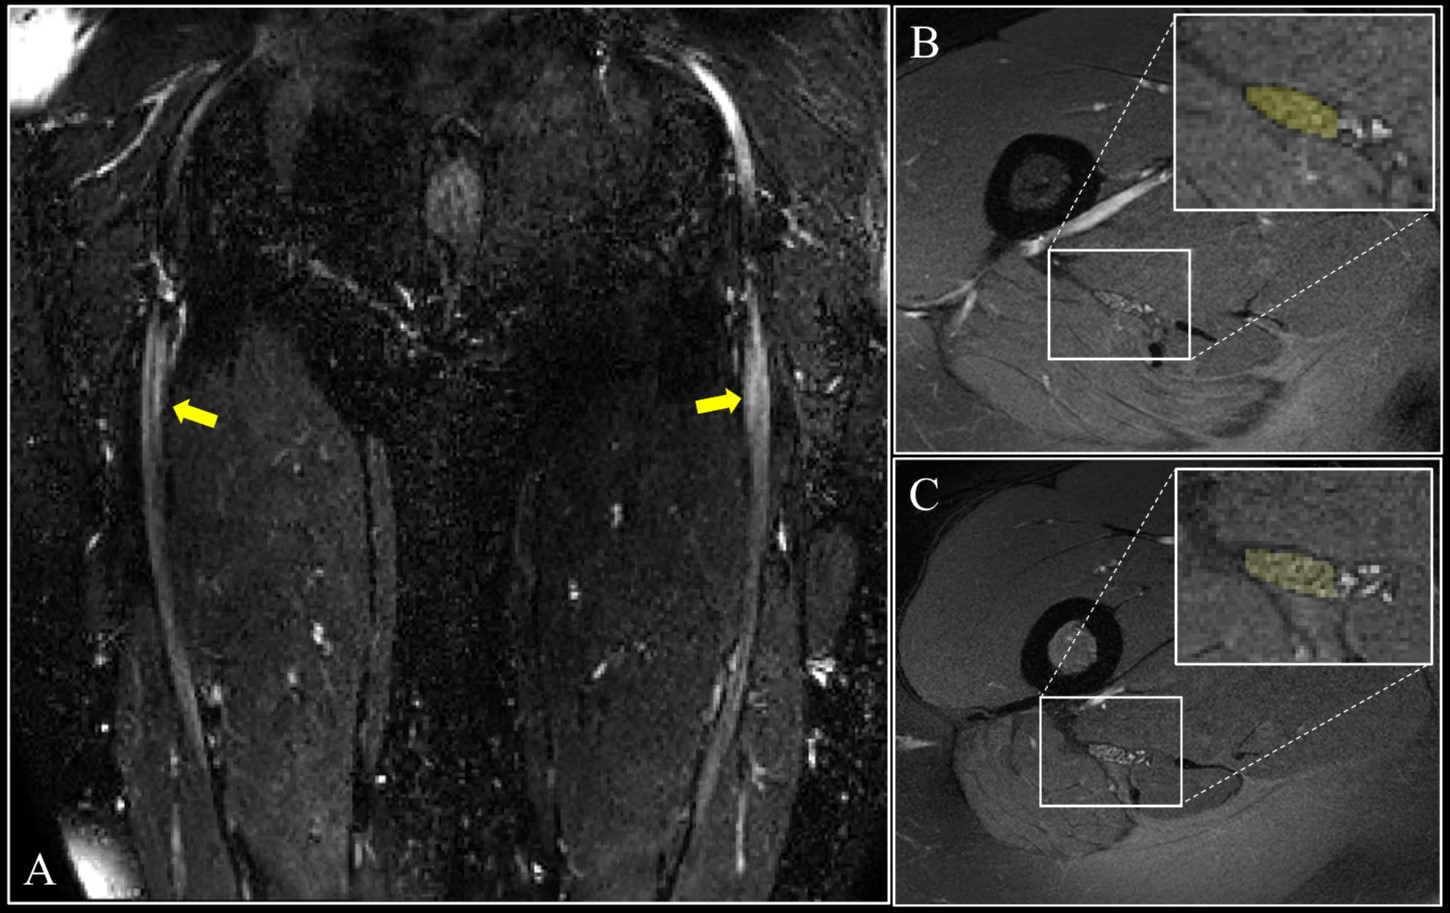
Figure 1. A) Large field-of-view 3D SHINKEI image showing the location of the
sciatic nerves (yellow arrows) in a healthy control B) Axial high-resolution fat-suppressed T2-weighted image of the sciatic nerve (binary mask in
yellow) in a healthy subject and C) in a patient
with RRMS.
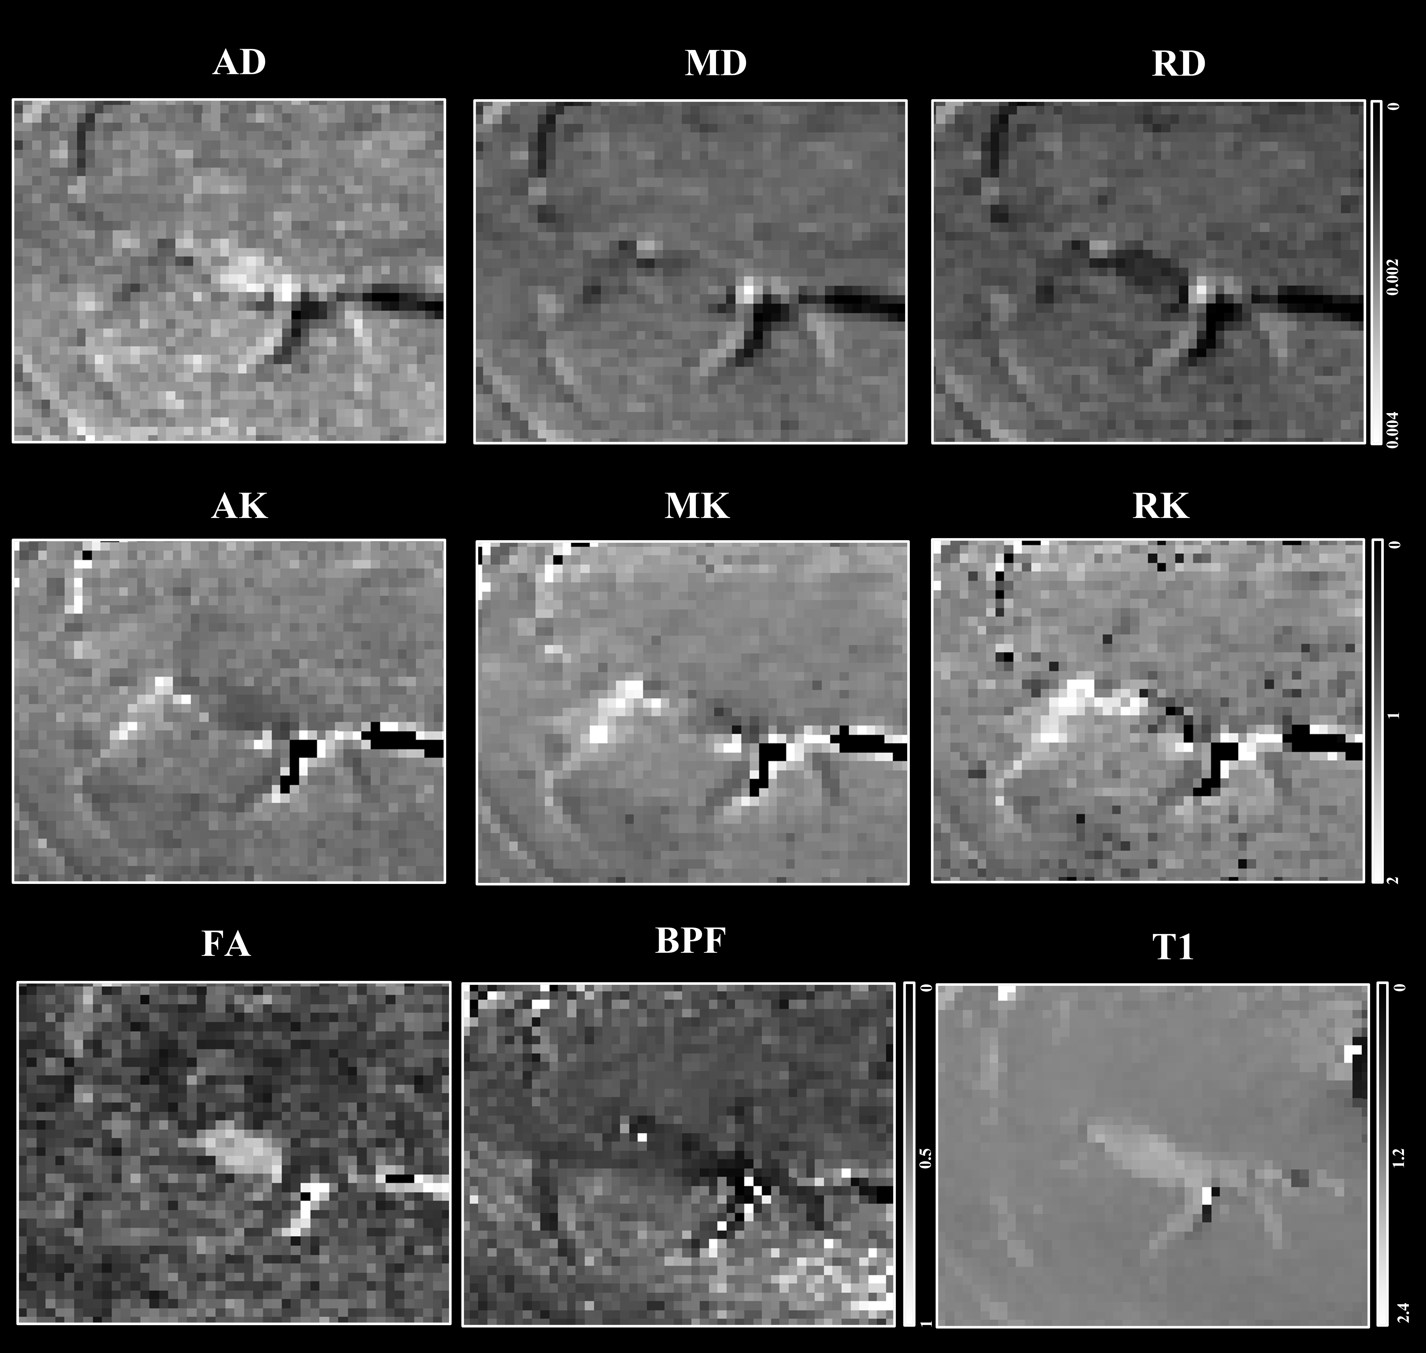
Figure 2.
Example
of standard diffusion tensor (DTI) metrics axial/radial/mean diffusivity
(AD/RD/MD), diffusion kurtosis imaging (DKI) metrics axial/radial/mean kurtosis
(AK/RK/MK), fractional anisotropy (FA), bound pool
fraction (BPF) maps and longitudinal
relaxation time (T1) of the sciatic nerve in a healthy control.
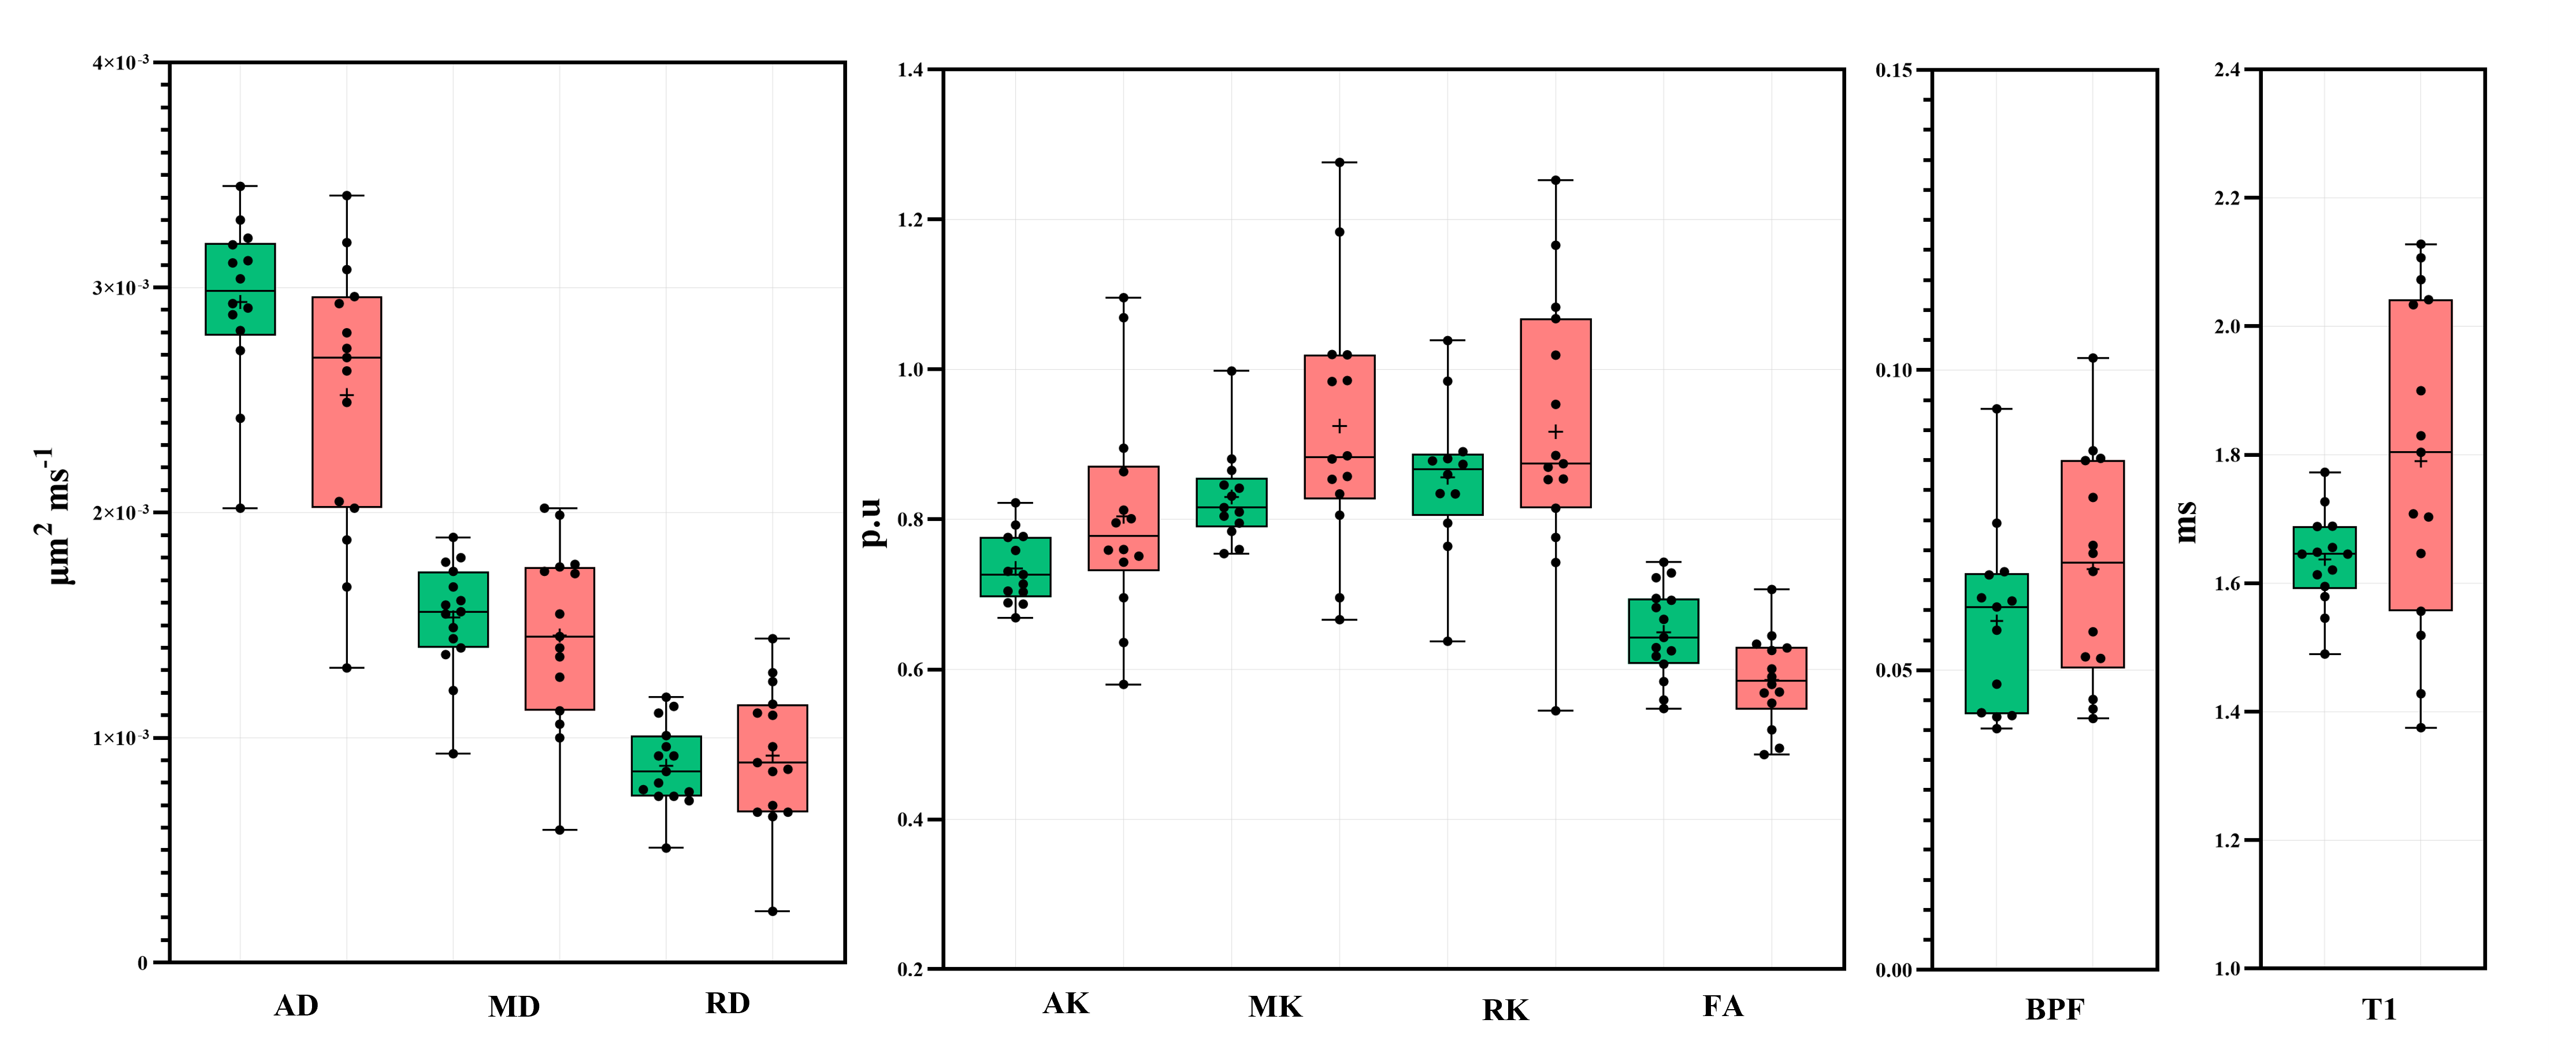
Figure 3. Distribution of DWI metrics AD, MD,
RD, AK. MK, RK, FA, BPF and T1 in the sciatic nerve of healthy controls (green)
and people with RRMS (red).
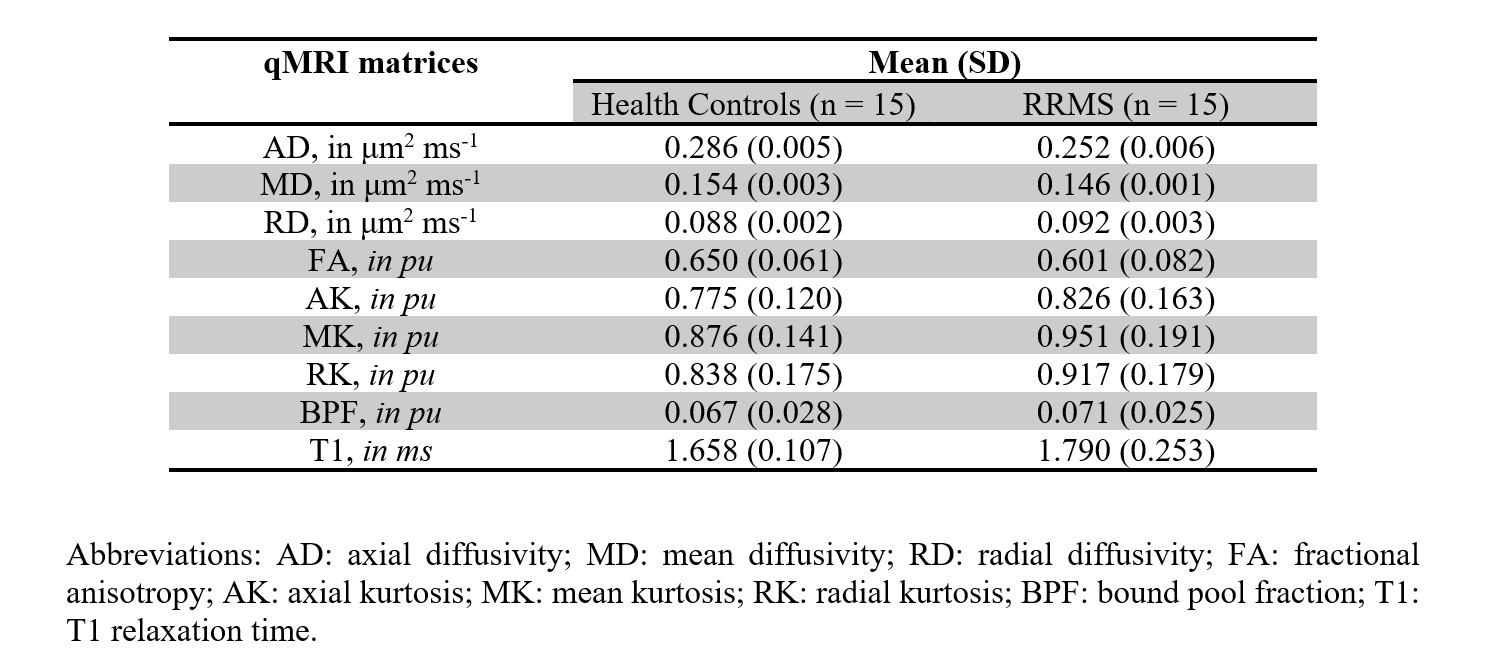
Table 1. Summary of all
qMRI measurements in healthy controls and people with RRMS
DOI: https://doi.org/10.58530/2023/2834