2833
Personalized-NODDI (pNODDI) discriminates between healthy and multiple sclerosis subjects1Department of Brain and Behavioral Sciences, University of Pavia, Pavia, Italy, 2NMR Research Unit, Department of Neuroinflammation, Queen Square Multiple Sclerosis Centre, UCL Queen Square Institute of Neurology, University College London (UCL), London, United Kingdom, 3Neurology-Neuroimmunology Department Multiple Sclerosis Centre of Catalonia (Cemcat), Vall d’Hebron Barcelona Hospital Campus, Barcelona, Spain, 4Radiomics Group, Vall d’Hebron Institute of Oncology, Vall d’Hebron Barcelona Hospital Campus, Barcelona, Spain, 5Department of Medical Physics and Biomedical Engineering, Centre for Medical Image Computing (CMIC), University College London, London, United Kingdom, 6E-Health Center, Universitat Oberta de Catalunya, Barcelona, Spain, 7Brain Connectivity Centre Research Unit, IRCCS Mondino Foundation, Pavia, Italy
Synopsis
Keywords: Multiple Sclerosis, Diffusion/other diffusion imaging techniques, personalised-NODDI
Neurite Orientation Dispersion and Density Imaging (NODDI) is a multi-compartmental model for microstructure characterization utilising diffusion-weighted MRI. Here, a recently proposed personalized-NODDI (pNODDI) modelling technique was used to assess microstructural alterations in a cohort of Multiple Sclerosis (MS) patients. Our findings showed that pNODDI metrics were sensitive to MS pathology and could discriminate between healthy controls and MS. Furthermore, pNODDI metrics of key brain regions increased the discriminative power between the two groups. Overall, pNODDI provides a personalized and clinically feasible model for microstructure, increasing sensitivity to pathological alterations.INTRODUCTION
Neurite Orientation Dispersion and Density Imaging (NODDI)1 is one of the most utilised multi-compartmental diffusion MRI models, and relies on two assumptions: firstly, that parallel intra-axonal diffusivity (Da) is equal to 1.7x10⁻³ mm2/s; and secondly, that extra-cellular and intra-cellular compartments have the same intrinsic diffusivity equal to Da. Recently, different implementations of NODDI have been proposed, in which the value of Da is defined, for example, as the mean axial diffusivity (AD) within the body of the corpus callosum (BodyCC), calculated from the diffusion tensor (DT) fitting, in a group of healthy controls (HC)2.However, this approach does not account for the fact that Da in the body of the corpus callosum may exhibit biological inter-subject variability, implying that residual biases may exist due to the fixed Da value (NODDI metrics are known to change as Da changes3). To account for this, we developed a personalized-NODDI (pNODDI) approach by substituting the fixed Da with a personalized value obtained from a subject-specific pipeline4. Here, Da was assumed to be equal to the mean AD of the BodyCC of each subject, thus allowing pNODDI to be subject-specific, as already proposed. In the present work the accuracy and sensitivity of pNODDI were tested in a cohort of subjects affected by progressive multiple sclerosis (MS). Orientation Dispersion Index and Neurite Density Index obtained with pNODDI (pODI and pNDI) of several brain regions were used to test the discriminative power of the method.
METHODS
Subjects & AcquisitionData were collected as part of a project investigating quantitative MRI in progressive MS5.
Subjects were divided into two groups: 17 Healthy Controls (HC) (12 females; 57±10y) and 14 progressive MS patients (7 females; 57±8y).
The following MRI data were acquired using a 3T Philips Ingenia CX scanner:
- Brain 3D FLAIR (TR/TE = 4800/258 ms, TI = 1650 ms, flip angle 40°, 1x1x1 mm3) and 3D T1-weighted scans (TR/TE = 6.9/3.1 ms, TI = 810 ms, flip angle 8°, 1x1x1 mm3)
- Diffusion-weighted (DW) images were acquired with a spin-echo EPI sequence (TR/TE = 6287/96 ms, 2x2x2 mm3, 20/20/36 DW-directions/shell, b=1000/2000/2800 s/mm2, 3 b=0 (b0) images).
Pre-processing
Corrections for Gibb’s artefacts, background noise, susceptibility-induced and eddy currents distortions were performed on the DW images using a combination of MRtrix36 and FSL7 commands.
T1w images were aligned to DW space and used to segment regions of interest (ROIs): white matter (WM), cortex grey matter (GM), genu, body, and splenium of the corpus callosum (GenuCC, BodyCC and SpleniumCC), the thalami (ThalLeft and ThalRight) and the hippocampi (HippoLeft, HippoRight). All ROI masks were thresholded at 0.99 to eliminate partial volume effects due to contamination from other tissues. A fully automated segmentation of WM lesions was performed on the 3D FLAIR images with the NicMS software, manually corrected by an experienced rater8. Normal-appearing white matter (NAWM) masks were obtained by subtracting lesions from the previously selected ROIs (NAWM, NAGenuCC, NABodyCC, NASpleniumCC).
pNODDI analysis
Mean AD was calculated in the NABodyCC for each subject (pDa ) to replace default intra-axonal diffusivity in NODDI in the pNODDI pipeline.
pNDI and pODI metrics were calculated using the NODDI toolbox1 (Matlab), after changing the input for the pNODDI’s pipeline as described above. Mean pODI and pNDI were evaluated in the defined ROIs, also including voxel’s value weighting for the presence of CSF9 (Figure 1).
Statistics
Statistical analyses were performed using SPSS10. Data normality was evaluated via a Shapiro-Wilk test. Then, the ability of pNODDI metrics to detect pathological alterations was assessed through independent-sample t-tests which compared HC and MS subjects. The discriminative power of pNODDI metrics was assessed by performing a discriminant analysis using the group as a dependent variable and considering, as independent variables, (i) pNDI (or pODI) of all brain regions together; (ii) pNDI (or pODI) of each specific brain region separately.
RESULTS
The distributions of pDa showed a mean value of (1.77±0.10)·10-3 mm2/s for the HC group and (1.71±0.16)·10-3 mm2/s for the MS group (Figure 2).pNDI was sensitive to MS pathology and identified differences between MS and HC in all the ROIs except for the left thalamus and the hippocampi, while pODI was sensitive to MS pathology only in the thalami (Figure 3).
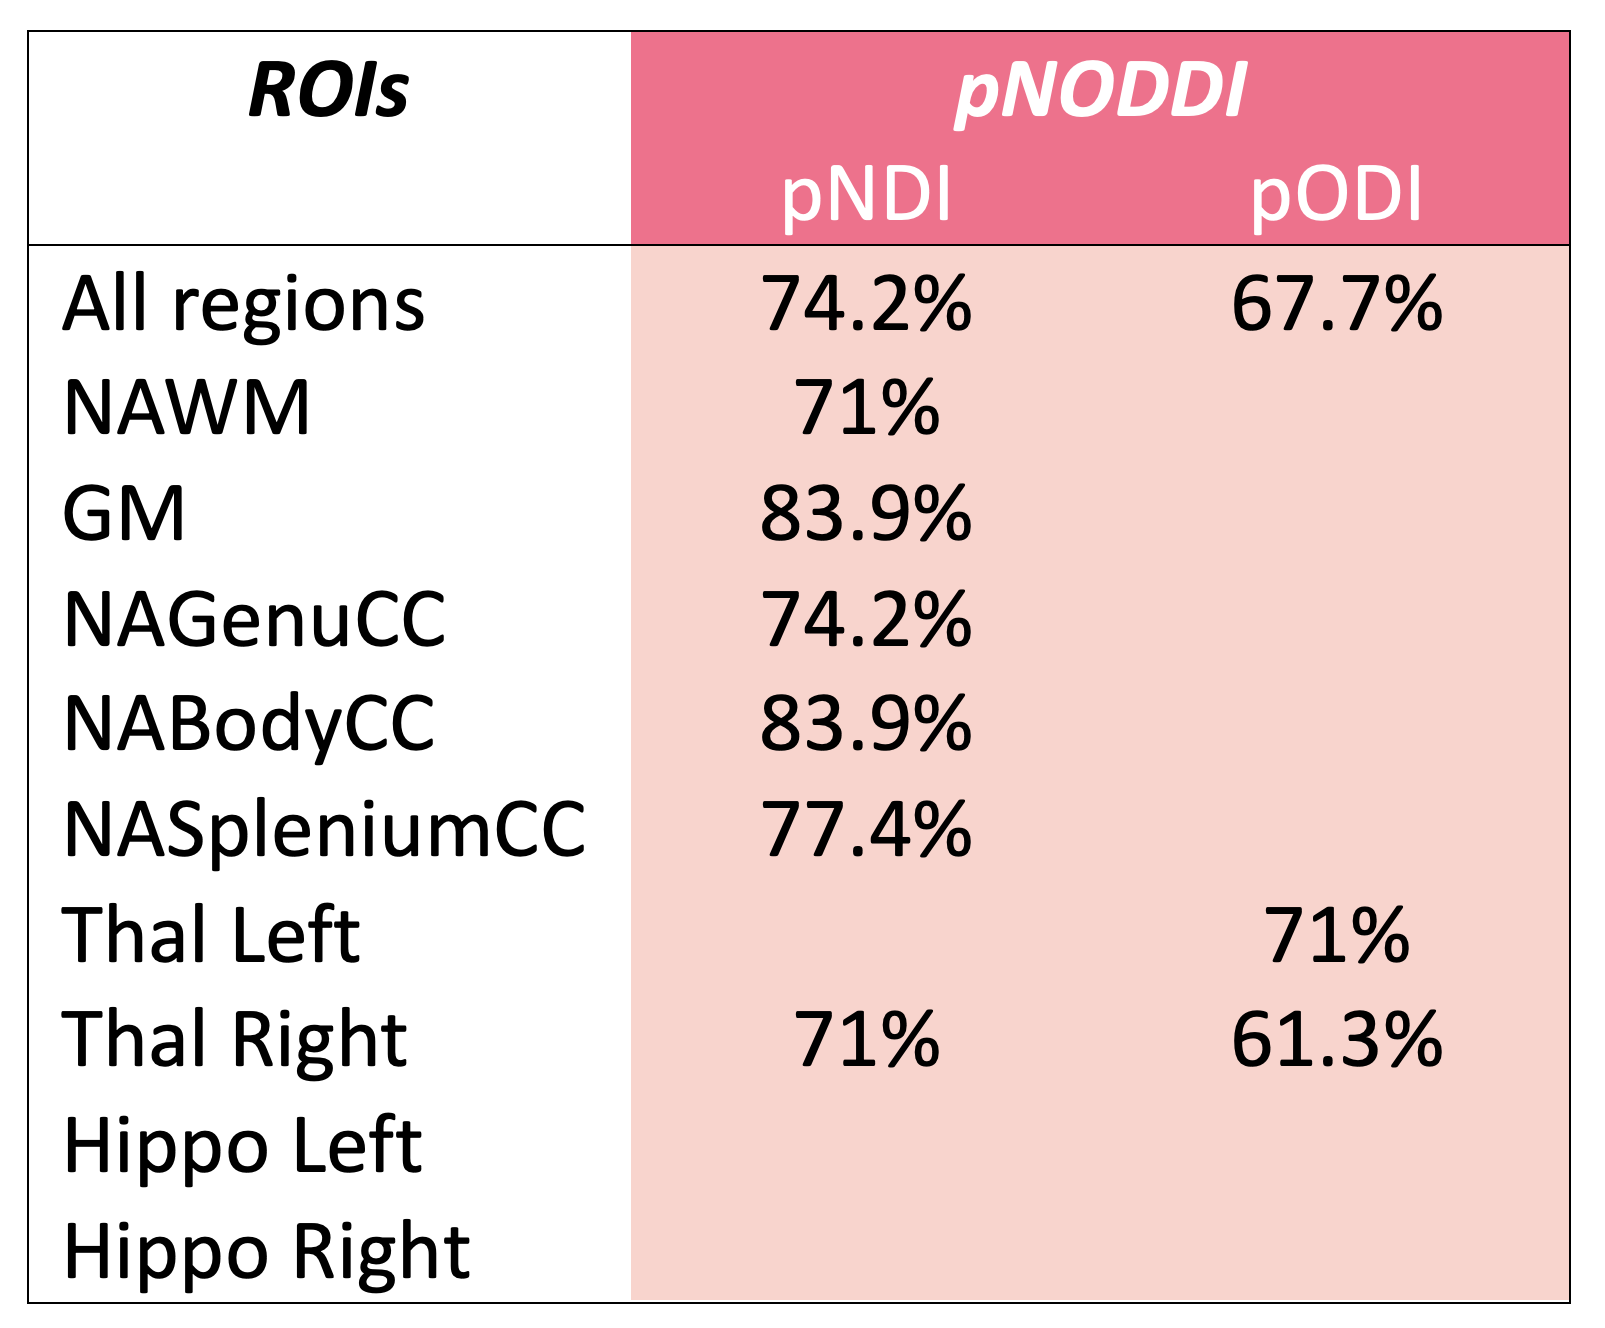
Furthermore, pNDI and pODI can discriminate between the two groups with high accuracy in the same regions in which they are sensitive to pathology (Figure 4).
DISCUSSION & CONCLUSIONS
Here, the pNODDI was tested on a cohort of progressive MS patients and HC. pNODDI was obtained by personalizing Da with subject-specific AD of the body of the corpus callosum. This method successfully discriminated between HC and MS in all the selected ROIs except for the hippocampi with a high sensitivity. In particular, pNDI can discriminate between the two groups when using metrics in the NAWM. Future studies are warranted to explore whether pNODDI is more sensitive than NODDI in MS lesions and whether it is sensitive to microstructural changes also in other neurological conditions.Acknowledgements
Data were collected as part of a study funded by the MS Society grant #77 awarded to CWK and RS. EG receives funding from TDC Technology Dedicated to Care. RS has received research funding from the UK MS Society ( grant #77), CureDRPLA and Ataxia UK & we thank the UCL-UCLH Biomedical Research Centre for ongoing support. ED and FP receive funding from H2020 Research and Innovation Action Grants Human Brain Project (#785907, SGA2 and #945539, SGA3). ED receives funding from the MNL Project “Local Neuronal Microcircuits” of the Centro Fermi (Rome, Italy). CGWK receives funding from Horizon2020 (#634541), BRC (#BRC704/CAP/CGW), MRC (#MR/S026088/1). CGWK is a shareholder in Queen Square Analytics Ltd. CT is currently being funded by a Junior Leader La Caixa Fellowship (fellowship code is LCF/BQ/PI20/11760008), awarded by “la Caixa” Foundation (ID 100010434). She has also received the 2021 Merck’s Award for the Investigation in MS, awarded by Fundación Merck Salud (Spain) and a grant awarded by the Instituto de Salud Carlos III (ISCIII), Ministerio de Ciencia e Innovación de España (PI21/01860). In 2015, she received an ECTRIMS Post-doctoral Research Fellowship and has received funding from the UK MS Society. She is a member of the Editorial Board of Neurology. She has also received honoraria from Roche and Novartis and is a steering committee member of the O’HAND trial and of the Consensus group on Follow-on DMTs. FG receives the support of a fellowship from “la Caixa” Foundation (ID 100010434). The fellowship code is “LCF/BQ/PR22/11920010”. AC is supported by the ECTRIMS post-doc fellowship (2022), previously received a UK MS Society PhD studentship (2020), a Guarantors of Brain “Entry” clinical fellowship (2019), and an ECTRIMS-MAGNIMS fellowship (2018).References
[1] Zhang, Hui, et al. "NODDI: practical in vivo neurite orientation dispersion and density imaging of the human brain." Neuroimage61.4 (2012): 1000-1016.
[2] Guerrero, Jose M., et al. "Optimizing the intrinsic parallel diffusivity in NODDI: an extensive empirical evaluation." PloS one 14.9 (2019): e0217118.
[3] Howard, A. F., Cottaar, M., Drakesmith, M., Fan, Q., Huang, S. Y., Jones, D. K., Lange, F. J., Mollink, J., Rudrapatna, S. U., Tian, Q., Miller, K. L., & Jbabdi, S. (2022). Estimating axial diffusivity in the NODDI model. NeuroImage, 262, 119535. https://doi.org/10.1016/j.neuroimage.2022.119535
[4] Grosso, E., Gandini Wheeler-Kingshott, C.A.M, Palesi, F., et al., “A personalized-NODDI (pNODDI) pipeline increases sensitivity to microstructural alterations in temporal lobe epilepsy”, ISMRM 2022
[5] Collorone, S., Battiston, M., Prados, F., et al., “Quantitative multi-modal MRI shows correlations between lesion iron deposition and neuro-axonal density in progressive multiple sclerosis” ISMRM 2021
[6] J. D. Tournier et al., “MRtrix3: A fast, flexible and open software framework for medical image processing and visualisation,” NeuroImage, vol. 202. Academic Press Inc., Nov. 15, 2019, doi: 10.1016/j.neuroimage.2019.116137.
[7] M. Jenkinson, C. F. Beckmann, T. E. J. Behrens, M. W. Woolrich, and S. M. Smith, “FSL,” Neuroimage, vol. 62, pp. 782–790, 2012, doi: 10.1016/j.neuroimage.2011.09.015.
[8] Valverde, Sergi, et al. “One-shot domain adaptation in multiple sclerosis lesion segmentation using convolutional neural networks” https://arxiv.org/abs/1805.12415
[9] Parker, C. S., Veale, T., Bocchetta, M., Slattery, C. F., Malone, I. B., Thomas, D. L., Schott, J. M., Cash, D. M., & Zhang, H. (2021). “Not all voxels are created equal: Reducing estimation bias in regional NODDI metrics using tissue-weighted means”. NeuroImage, 245, 118749. https://doi.org/10.1016/j.neuroimage.2021.118749
[10] IBM Corp. Released 2013, IBM SPSS Statistics for Linux, Version 22.0 Armonk, NY: IBM Corp
Figures
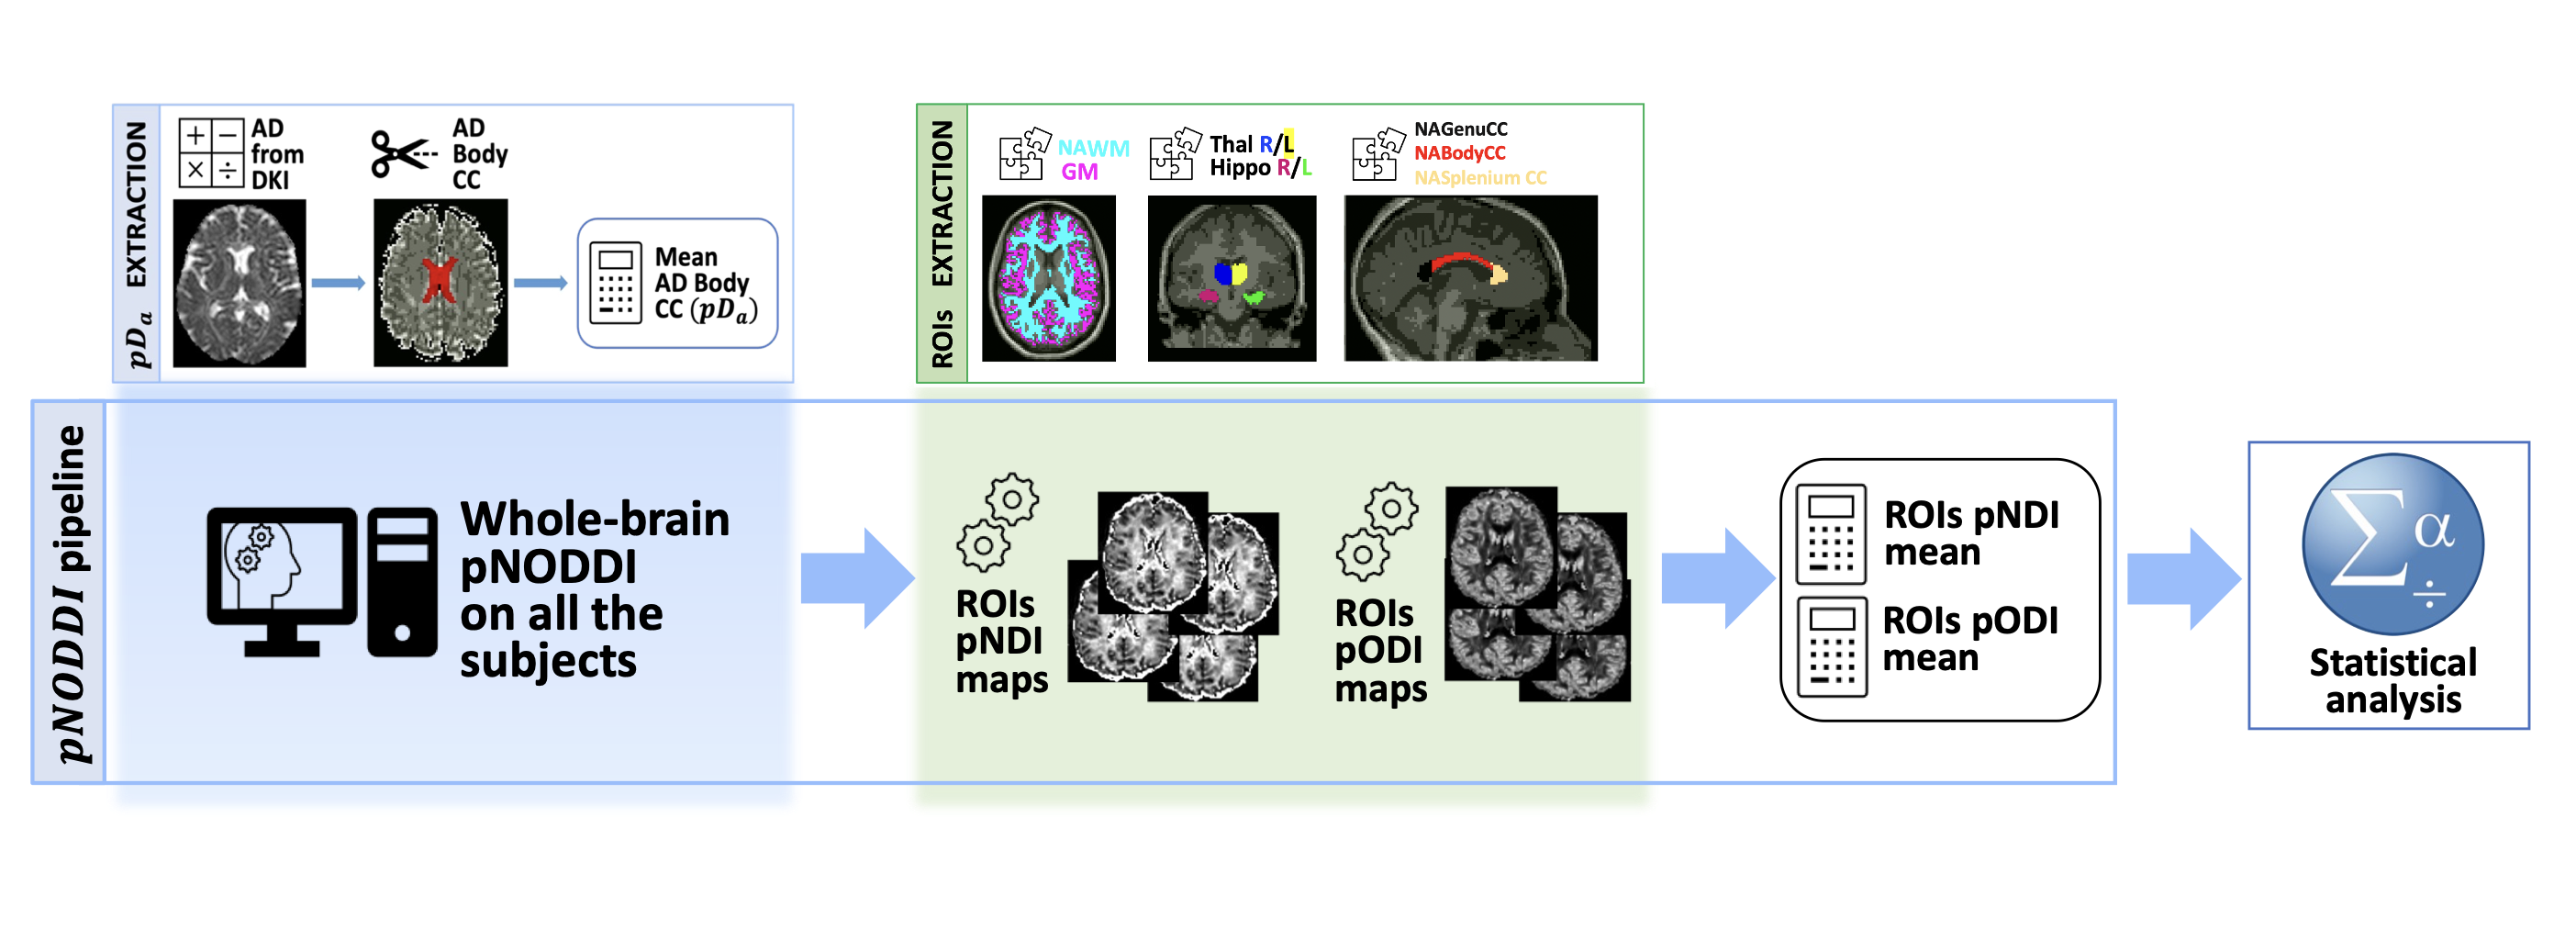
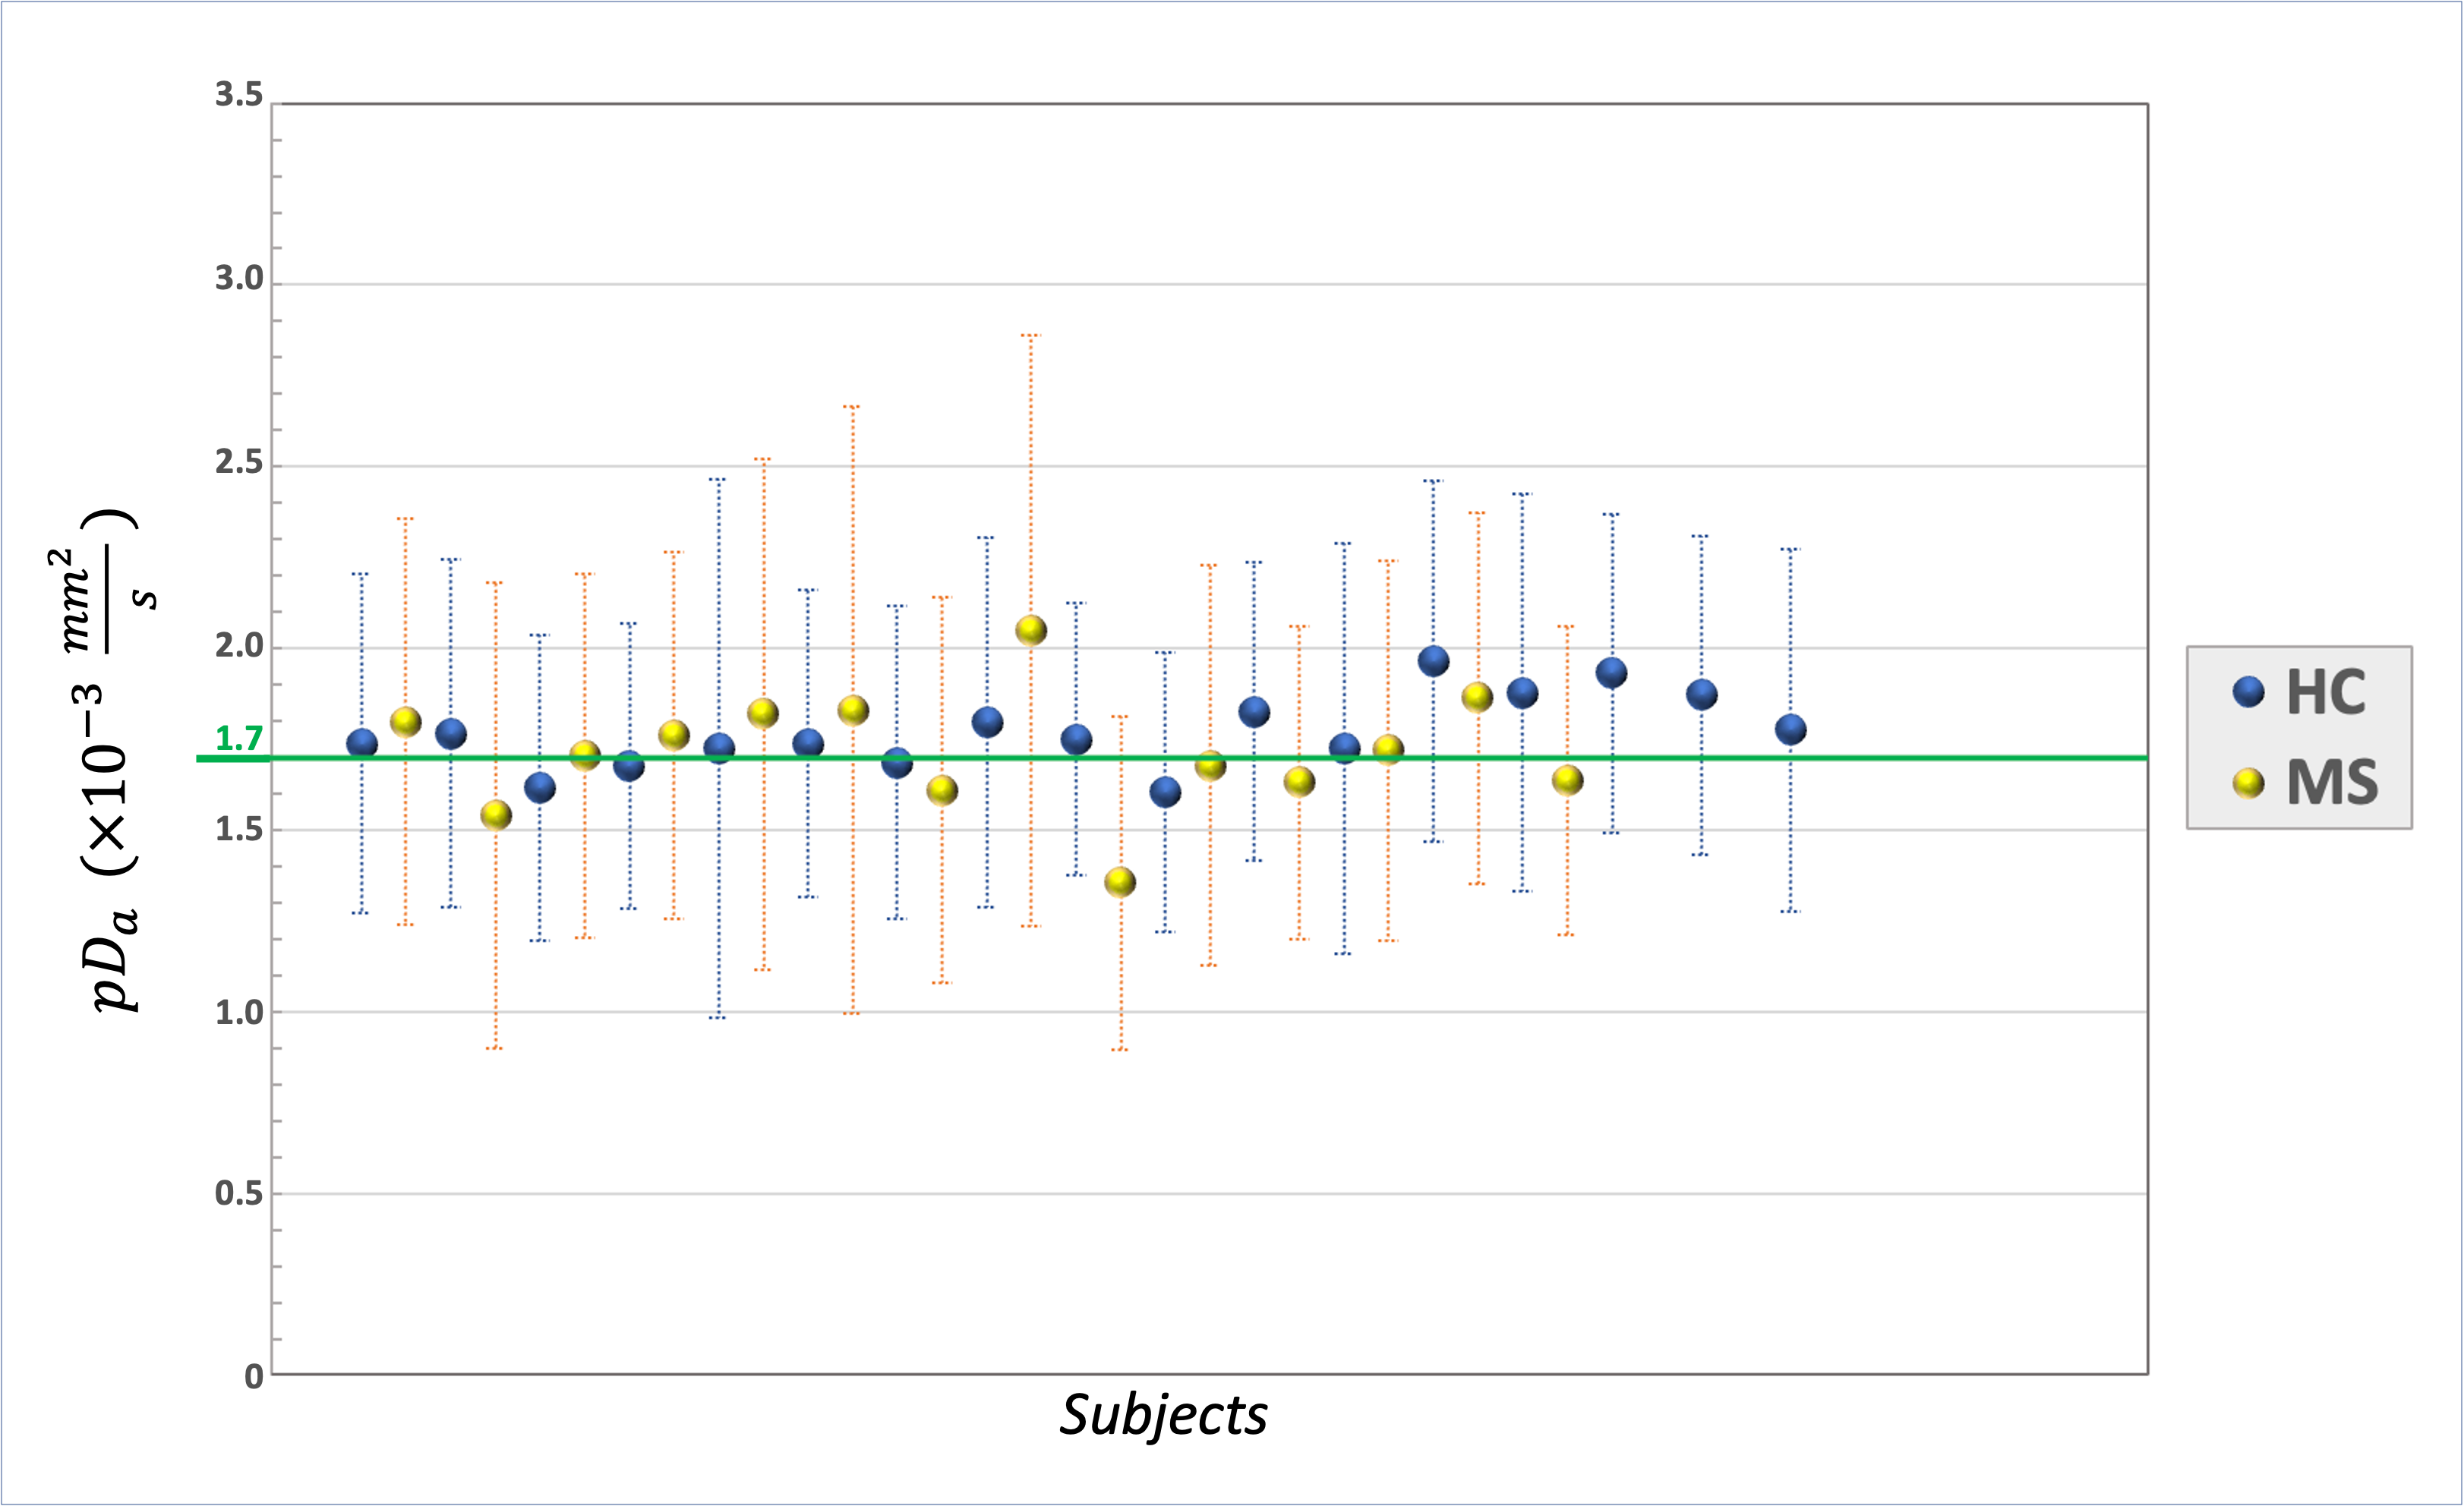
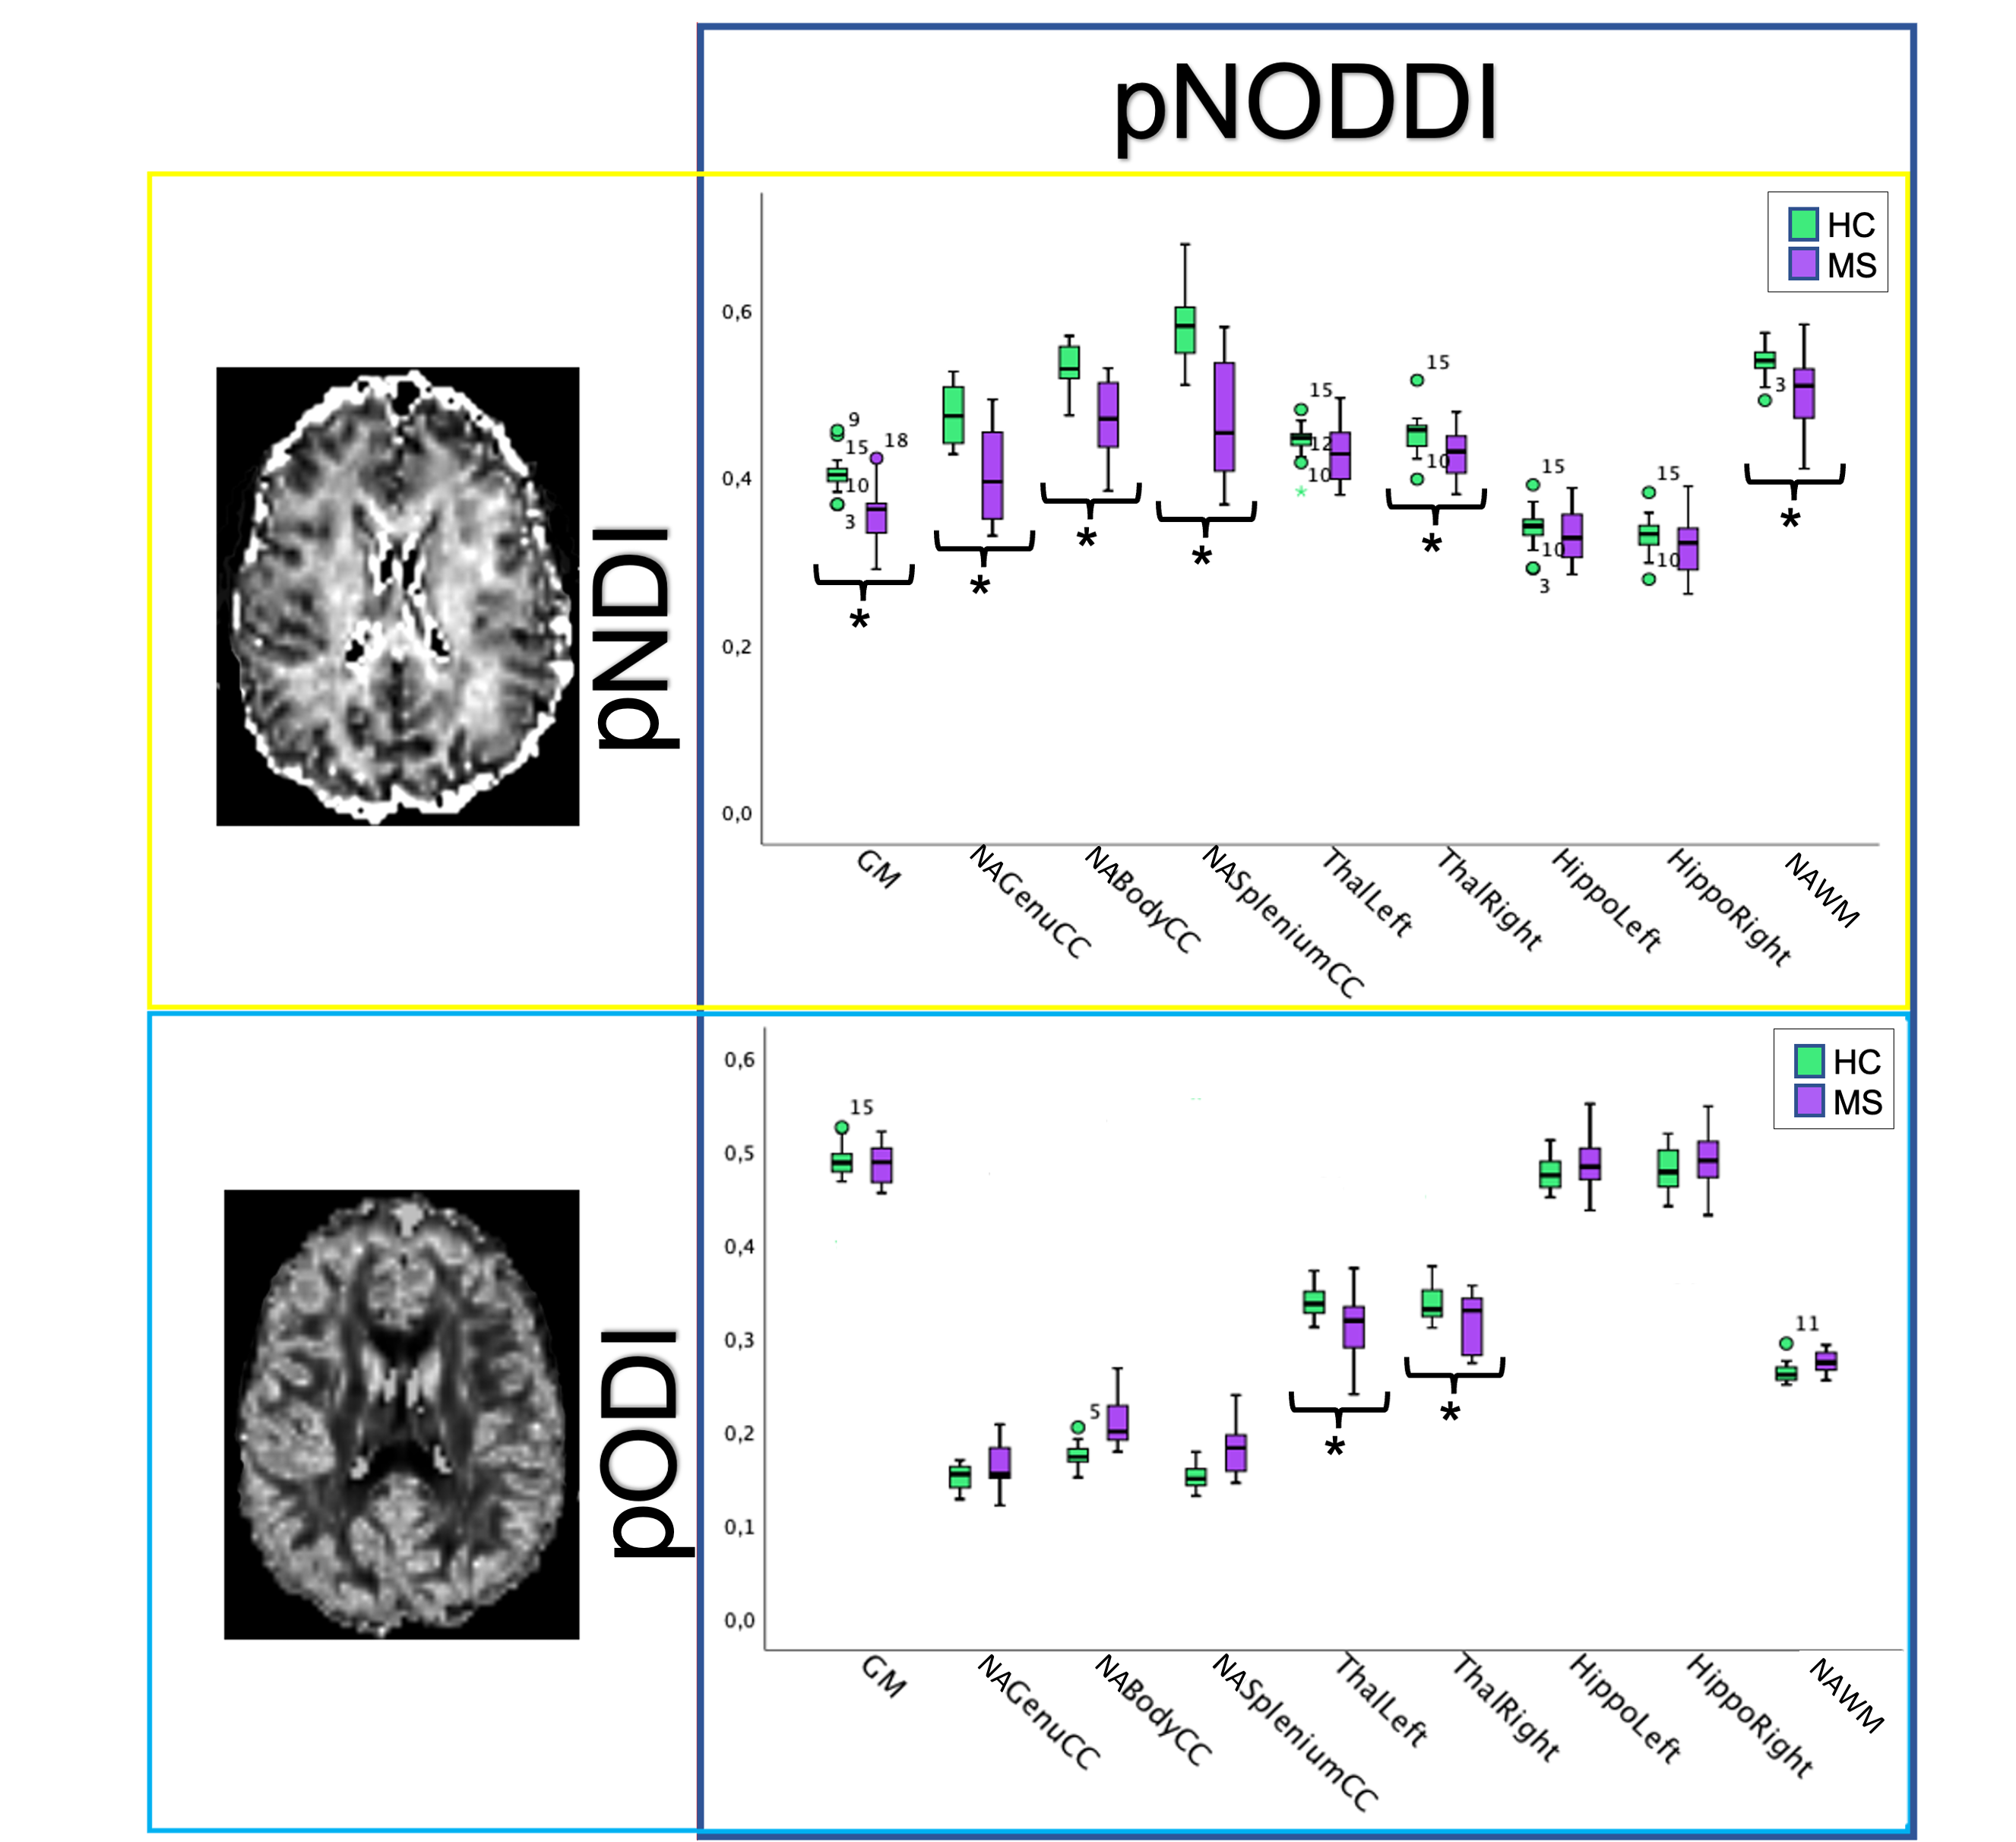
Figure 3 | Analysis of personalized-NODDI (pNODDI) metrics between Healthy Controls (HC) and Multiple Sclerosis (MS) subjects. Boxplots of pNODDI neurites density index (pNDI) (top) and orientation dispersion index (pODI) (bottom), showing differences between values calculated in HC and MS. Significant differences (p<0.05) between groups are marked with an asterisk.