2832
Association of subcortical structural shapes with fatigue in Multiple Sclerosis.1Department of Magnetic Resonance, Lanzhou University Second Hospital, Lanzhou, China, 2Second Clinical School, Lanzhou University, Lanzhou, China, 3Lanzhou University Second Hospital, Lanzhou, China, 4Philips Healthcare, Xi’an, China
Synopsis
Keywords: Multiple Sclerosis, Gray Matter
This study investigated the shape changes in the subcortical structure of patients with multiple sclerosis (PwMS) and how they are associated with MS-related fatigue. Surface-based vertex analysis was performed on 25 fatigued RRMS (F-MS), 25 non-fatigued RRMS (NF-MS), and 40 healthy controls (HCs). Compared to HCs, PwMS showed regional shape contractions in the areas of bilateral thalamus. The morphological changes in the bilateral thalamus occur only on the side closest to the ventricles. Compared to the NF-MS subgroup, F-MS patients showed regional surface atrophy in the areas of left caudate nucleus, which was negatively correlated with the severity of fatigue.Introduction
Multiple sclerosis (MS) is an immune-mediated, demyelinating disease of the central nervous system. Fatigue is a debilitating and prevalent symptom of MS. Although several pathogenic substrates have been postulated to explain the formation of fatigue in patients with MS (PwMS), its etiology remains obscure. The deep grey matter (DGM) has the fastest annual rate of tissue loss in relapsing-remitting MS (RRMS), thereby becoming a useful outcome measure in neuroprotective clinical trials [1]. The DGM is mainly divided into amygdalae, hippocampus, caudate, nucleus accumbens, putamina, pallida, thalamic nucleus. A Voxel-based morphometry (VBM) analysis of the subcortical nuclei revealed that PwMS with high fatigue had significantly reduced thalamic volume [2]. However, the association of MS-related fatigue with other nuclei atrophy has not been identified. Furthermore, The VBM method may obscure various local effects by averaging out more complicated shape alterations, which could result in false-negative results [3]. Surface-based vertex analysis (SVA) provides quantitative measurements by comparing relative distances among corresponding surfaces and permits the examination of shape differences across the subcortical structures [4]. We aimed to assess the shape changes in the subcortical structure of PwMS and how they are associated with fatigue.Methods
Fifty patients diagnosed with RRMS based on the 2017 revised McDonald criteria [5] were recruited. The inclusion criterion were: (1) age between 18 and 45 years; (2) no clinical relapse for at least 3 months; (3) stable disease-modifying treatment and no corticosteroid therapy for at least 3 months; (4) The Expanded Disability Status Scale (EDSS) score of up to 4; (5) The Montreal Cognitive Assessment (MoCA) score > 26; (6) The Beck Depression Inventory II (BDI-II) score < 14; and (7) no sleep disorders. MS-related fatigue was assessed using the self-reported fatigue severity scale (FSS). We also enrolled 40 age-, sex-, and education-matched healthy controls (HCs).Brain MRI data were collected using a 3.0 T MR scanner (Ingenia CX, Philips Healthcare, the Netherlands) with a 32-channel phased-array head coil. The structural sequence was acquired using a 3D T1-weighted MPRAGE sequence (TR = 7.9 ms; TE = 3.5 ms; matrix = 256 × 256, slice thickness = 1mm, voxel size = 1 × 1 × 1 cmm).
Using the Functional MRI of the Brain Software Library (FSL, version 6.0.30) fully automated segmentations of subcortical structures of amygdalae, hippocampi, caudate nuclei, nucleus accumbens, putamina, pallida, and thalami. The SVA were performed by the FMRIB’s Integrated Registration and Segmentation Tool (FIRST). The group comparisons were independently tested using two sample t-test analyses. The multiple comparison problem was corrected at the cluster level using the threshold-free cluster enhancement (TFCE) to a family-wise error (FWE) rate of P < 0.05.
Results
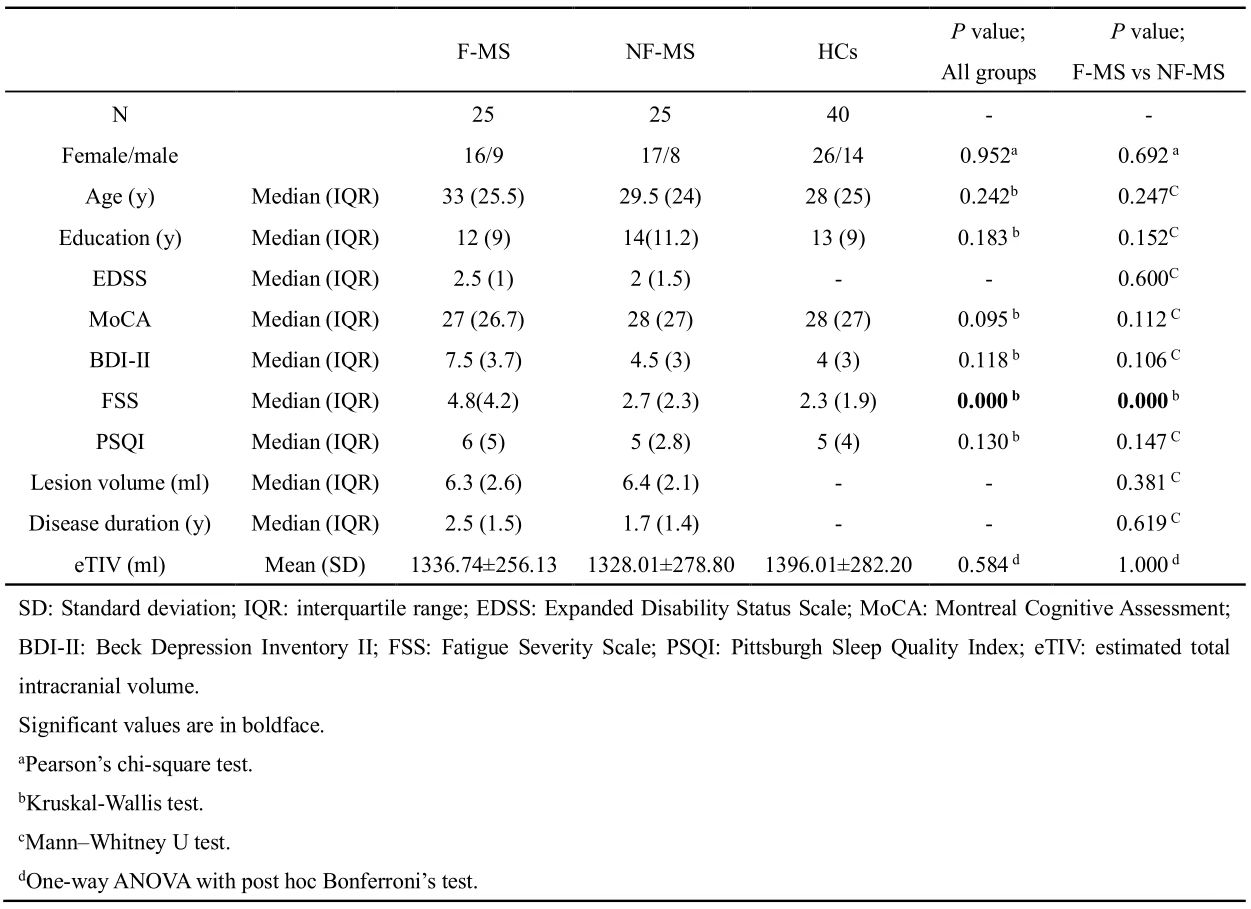
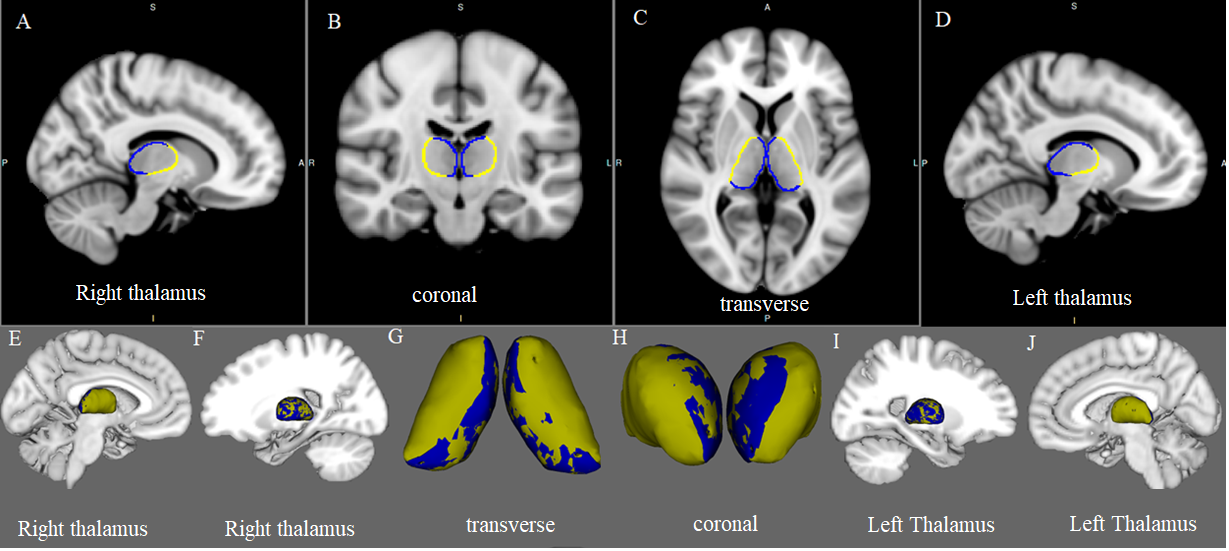
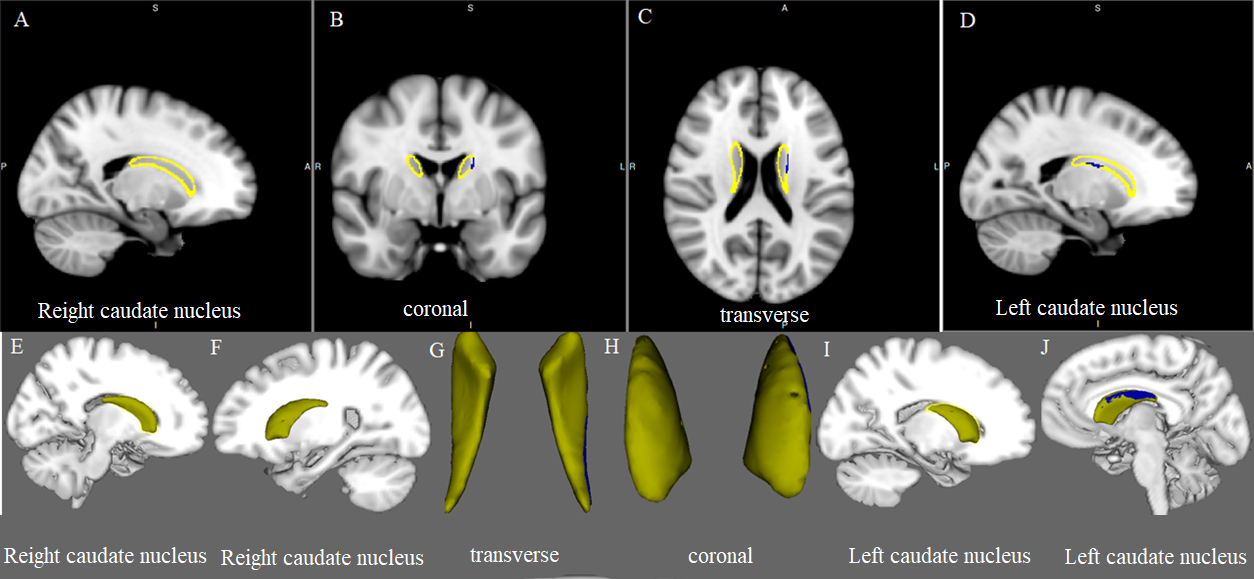
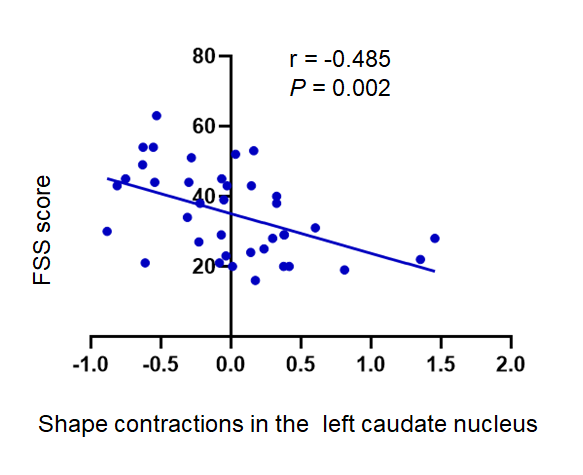
Table 1 summarizes the main demographic, clinical characteristics of the final data set of the F-MS (n = 25), NF-MS (n = 25), and HCs (n = 40) groups. Compared to HCs, PwMS showed regional shape contractions in the areas of bilateral thalamus. In the thalami, wide areas of bilateral anteroventral, ventral anterior, and mediodorsal medial magnocellular, and pulvinar medial nuclei were contracted. (Fig. 1; TFCE FWE corrected P < 0.05). Compared to the NF-MS subgroup, the F-MS subgroup showed regional surface atrophy in the areas of left caudate nucleus. The lateral wall/anterosuperior area of the left caudate nucleus was contracted (Fig. 2; TFCE FWE corrected P < 0.05). In vertex-wise shape correlation analysis, there was a negative significant correlation between regional shape deformations (lateral wall/anterosuperior area) on the left caudate nucleus and FSS score in PwMS (Fig. 3).Discussion and conclusion
This study revealed that (1) the morphological changes in the bilateral thalamus occur only on the side closest to the ventricles in PwMS. (2) the F-MS subgroup showed regional surface atrophy of left caudate nucleus, which was negatively correlated significantly with the FSS score.Preferential thalamic volume loss relative to cortical and other DGM structures is often a feature of MS [6]. Its cause is not completely understood. Using MRI, thalamic volume loss has been speculated to be due to either focal thalamic demyelinating lesions or global WM lesion burden. Although PwMS demonstrated no indication of thalamic degeneration by visually inspecting conventional MRI scans in this study, thalamic lesions have been found in around 71% of MS patients when imaged at 7 T [7]. We observed the morphological changes in the bilateral thalamus occur only on the side closest to the ventricles. This phenomenon may be related to the thin subependymal [6] (perhaps due to diffusion of soluble toxin and chemokine infiltration from the CSF) demyelinating lesions in the thalamus.
MS-related fatigue can arise from a global reduction in the activity of the network involving caudate nucleus. Jaeger et al revealed reduced caudate nucleus–sensorimotor functional connectivity (FC) in MS patients with fatigue, indicating a functional decoupling between these regions [8]. We hypothesize that this is related to caudate nucleus shape atrophy. A study on progressive resistance training revealed that greater post-training increases in FC between the caudate and left inferior parietal region were associated with greater decreases in cognitive fatigue specifically [9]. Consequently, our study provides initial evidence for the caudate as a potential neural substrate on fatigue in persons with MS.
Acknowledgements
None.References
1. Eshaghi, A.; Prados, F.; Brownlee, W.J.; Altmann, D.R.; Tur, C.; Cardoso, M.J.; De Angelis, F.; van de Pavert, S.H.; Cawley, N.; De Stefano, N.; et al. Deep gray matter volume loss drives disability worsening in multiple sclerosis. Ann Neurol 2018, 83, 210-222, doi:10.1002/ana.25145.
2. Bernitsas, E.; Yarraguntla, K.; Bao, F.; Sood, R.; Santiago-Martinez, C.; Govindan, R.; Khan, O.; Seraji-Bozorgzad, N. Structural and Neuronal Integrity Measures of Fatigue Severity in Multiple Sclerosis. Brain sciences 2017, 7, doi:10.3390/brainsci7080102.
3. Choi, K.W.; Han, K.M.; Kim, H.; Kim, A.; Kang, W.; Kang, Y.; Tae, W.S.; Ham, B.J. Comparison of shape alterations of the thalamus and caudate nucleus between drug-naïve major depressive disorder patients and healthy controls. Journal of affective disorders 2020, 264, 279-285, doi:10.1016/j.jad.2020.01.011.
4. Patenaude, B.; Smith, S.M.; Kennedy, D.N.; Jenkinson, M. A Bayesian model of shape and appearance for subcortical brain segmentation. NeuroImage 2011, 56, 907-922, doi:10.1016/j.neuroimage.2011.02.046.
5. Thompson, A.J.; Banwell, B.L.; Barkhof, F.; Carroll, W.M.; Coetzee, T.; Comi, G.; Correale, J.; Fazekas, F.; Filippi, M.; Freedman, M.S.; et al. Diagnosis of multiple sclerosis: 2017 revisions of the McDonald criteria. The Lancet. Neurology 2018, 17, 162-173, doi:10.1016/s1474-4422(17)30470-2. 6. Mahajan, K.R.; Nakamura, K.; Cohen, J.A.; Trapp, B.D.; Ontaneda, D. Intrinsic and Extrinsic Mechanisms of Thalamic Pathology in Multiple Sclerosis. Ann Neurol 2020, 88, 81-92, doi:10.1002/ana.25743.
7. Harrison, D.M.; Oh, J.; Roy, S.; Wood, E.T.; Whetstone, A.; Seigo, M.A.; Jones, C.K.; Pham, D.; van Zijl, P.; Reich, D.S.; et al. Thalamic lesions in multiple sclerosis by 7T MRI: Clinical implications and relationship to cortical pathology. Multiple sclerosis (Houndmills, Basingstoke, England) 2015, 21, 1139-1150, doi:10.1177/1352458514558134.
8. Jaeger, S.; Paul, F.; Scheel, M.; Brandt, A.; Heine, J.; Pach, D.; Witt, C.M.; Bellmann-Strobl, J.; Finke, C. Multiple sclerosis-related fatigue: Altered resting-state functional connectivity of the ventral striatum and dorsolateral prefrontal cortex. Multiple sclerosis (Houndmills, Basingstoke, England) 2019, 25, 554-564, doi:10.1177/1352458518758911.
9. Akbar, N.; Sandroff, B.M.; Wylie, G.R.; Strober, L.B.; Smith, A.; Goverover, Y.; Motl, R.W.; DeLuca, J.; Genova, H. Progressive resistance exercise training and changes in resting-state functional connectivity of the caudate in persons with multiple sclerosis and severe fatigue: A proof-of-concept study. Neuropsychological rehabilitation 2020, 30, 54-66, doi:10.1080/09602011.2018.1449758.
Figures