2831
Quantitative T2 measurements of diffusely-abnormal white matter in relapsing-remitting MS patients at baseline
Benjamin Charles Musall1, Yanyu Yang2, Arash Kamali1, John A Lincoln3, Vi Ly2, Xi Luo2, Ponnada A Narayana1, Refaat E Gabr1, and Khader M Hasan1
1Diagnostic and Interventional Imaging, UTHealth McGovern Medical School, Houston, TX, United States, 2Department of Biostatistics and Data Science, University of Texas School of Public Health, Houston, TX, United States, 3Department of Neurology, UTHealth McGovern Medical School, Houston, TX, United States
1Diagnostic and Interventional Imaging, UTHealth McGovern Medical School, Houston, TX, United States, 2Department of Biostatistics and Data Science, University of Texas School of Public Health, Houston, TX, United States, 3Department of Neurology, UTHealth McGovern Medical School, Houston, TX, United States
Synopsis
Keywords: Multiple Sclerosis, Quantitative Imaging
Quantitative T2 of diffusely-abnormal white matter (DAWM), assessed at baseline in a population of 800 patients with relapsing-remitting MS with U-Net segmentation and T2 mapping, is distinct and intermediate to T2-hyperintense focal lesions and normal-appearing white matter (NAWM).INTRODUCTION
MRI-based assessment of multiple sclerosis (MS) lesions show only moderate correlation with clinical symptoms1,2. In addition to focal lesions, diffuse regions of white matter with signal intensities intermediate to normal-appearing white matter (NAWM) and focal lesions are seen on T2-weighted and proton-density MRI. This diffusely-abnormal white matter (DAWM) is seen in more than 25% of relapsing-remitting MS patients3. DAWM pathology is not yet understood, and may be distinct from that of focal lesions3.Expert segmentation of DAWM is time-intensive and difficult, and automated methods are still under development3. Some preliminary studies using quantitative MRI have shown DAWM to have tissue properties distinct to NAWM and lesions3. Quantitative DAWM metrics may be useful for development of automated assessments and are also of interest as possible correlates with disability measures and disease progression.
In this report, we applied a U-Net model4 for segmentation of normal-appearing gray matter (NAGM), NAWM, DAWM, and T2 lesions on baseline scans of a large patient population with relapsing-remitting MS. The segmentations were used to extract quantitative T2 measurements for comparison between the tissues.
METHODS
The baseline scans of 800 relapsing-remitting MS patients from the multi-center CombiRx trial (NCT00211887) were analyzed. 223/800 (24%) of patients were men. Patient age ranged from 18 to 61 years (median age: 37). Scans were acquired using both 1.5 T and 3.0 T (73% at 1.5T) MRI scanners from multiple vendors. Patient scans included fluid-attenuated inversion recovery (FLAIR), pre-contrast T1-weighted, and dual spin-echo sequences. All series underwent skull stripping and bias field correction5.The dual spin-echo data were fit voxel-wise using a linear least-squares solution of T2 exponential decay to estimate quantitative T2 maps. The TR and TE of the dual echo scan were not fixed between sites, resulting in variable parameter settings. Ranges of the TR and TE were as follows: TRs from 5320 to 7000 ms, early echo = TE1 from 7.2 to 16 ms, and late echo =TE2 from 85 to 115 ms.
A U-Net model6, trained by weak supervision and refined on a small number of expert segmentations4, was used for segmentation of the brain into NAGM, NAWM, cerebrospinal fluid (CSF), DAWM, and T2 lesions (Figure 1).
Tissue volumes were calculated from U-Net segmentations. The percentage of the intracranial volume occupied by DAWM was calculated. T2 measurements were extracted from T2 maps using tissue segmentations. T2 tissue measurements were compared on a patient-wise basis using Wilcoxon Rank-Sum test. A visual abstract depicting these methods can be seen in Figure 2.
RESULTS
As segmented by the U-Net model, 81% of patients had >1 cm3 of DAWM, while 25% of patients has DAWM volumes of at least 6.6 cm3. DAWM volumes ranged up to 32 cm3 (average: 4.8 ± 4.7 cm3), while T2 lesion volumes ranged from 0.1 to 67.6 cm3 (average: 11.5 ± 12.0 cm3). The percentage of the intracranial volume occupied by DAWM ranged from 0% to 2.6%. (average: 0.35% ± 0.34%). Patient-wise comparisons (Figure 3) showed DAWM T2 to be significantly higher than NAWM (p < 0.001) and significantly lower than T2 lesions (p < 0.001). A scatter plot showing average T2 values for tissues across patients are shown in Figure 4.DISCUSSION
In a large population of relapsing-remitting MS patients, DAWM was seen to have distinct T2 measurements in comparison to NAWM and T2 lesions. This parallels the finding of a prior study by Papadaki et al., who found DAWM in 27/37 (73%) relapsing-remitting MS patients with T2 values distinct to NAWM and T2 lesions7. However; direct comparison of T2 values with this study is not possible due to differences in DAWM segmentation technique and in T2 acquisition, modeling and mapping techniques.The heterogeneity of MRI hardware and acquisition protocols in the scan dataset strengthens the finding of distinct T2 in DAWM on a patient-wise basis, though this heterogeneity also introduces variability in the T2 mapping. In addition, T2 values are known to vary by location in the brain and in relation to patient demographics such as age and sex. Inter-patient comparisons of T2 measurements and correlation with clinical endpoints may require an accounting of these related factors.
CONCLUSION
Our preliminary results show that quantitative T2 measurements in DAWM are distinct from T2 lesions and NAWM. Quantitative T2 may be useful for assessment of DAWM in relapsing-remitting MS patients.Acknowledgements
No acknowledgement found.References
- Trapp B, Peterson J, Ransohoff, et al. Axonal transection in the lesions of multiple sclerosis. N Engl J Med. 1998;338(5):278-85.
- Mollison D, Sellar R, Bastin M, et al. The clinico-radiological paradox of cognitive function and MRI burden of white matter lesions in people with multiple sclerosis: A systematic review and meta-analysis. PLoS One. 2017;12(5):e0177727.
- Cairns J, Vavasour I, Traboulsee A, et al. Diffusely Abnormal White Matter in Multiple Sclerosis. J Neuroimaging. 2022;32(1)5-16.
- Musall B, Kamali A, Lincoln J, et al. Weakly Supervised Convolutional Neural Networks for Segmentation of Diffusely Abnormal White Matter in Multiple Sclerosis. Proceedings of the American Association of Physicists in Medicine Annual Meeting, 2022.
- Sajja B, Datta S, He R, et al. Unified approach for multiple sclerosis lesion segmentation on brain MRI. Ann Biomed Eng. 2006;34(1):142-151.
- Ronneberger O, Fischer P, Brox T. U-Net: Convolutional Networks for Biomedical Image Segmentation. arXiv. 2015;1505.04597.
- Papadaki E, Mastorodemos V, Panou T, et al. T2 Relaxometry Evidence of Microstructural Changes in Diffusely Abnormal White Matter in Relapsing-Remitting Multiple Sclerosis and Clinically Isolated Syndrome: Impact on Visuomotor Performance. J Magn Reson Imaging. 2021;54(4):1077-1087.
Figures
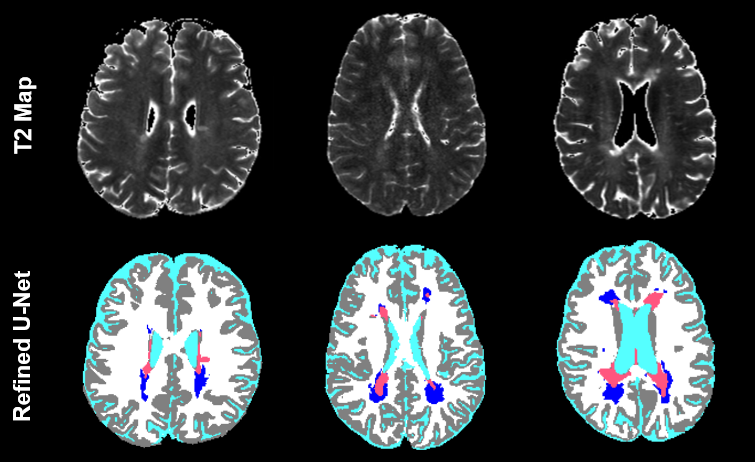
Figure 1. Segmentation
(NAGM = gray, NAWM = white, CSF = teal, DAWM = blue, T2 lesions = salmon) and
images from three baseline MRI scans of relapsing-remitting MS patients. From
left to right: a 22-year-old man, a 25-year-old woman, and a 30-year-old woman.
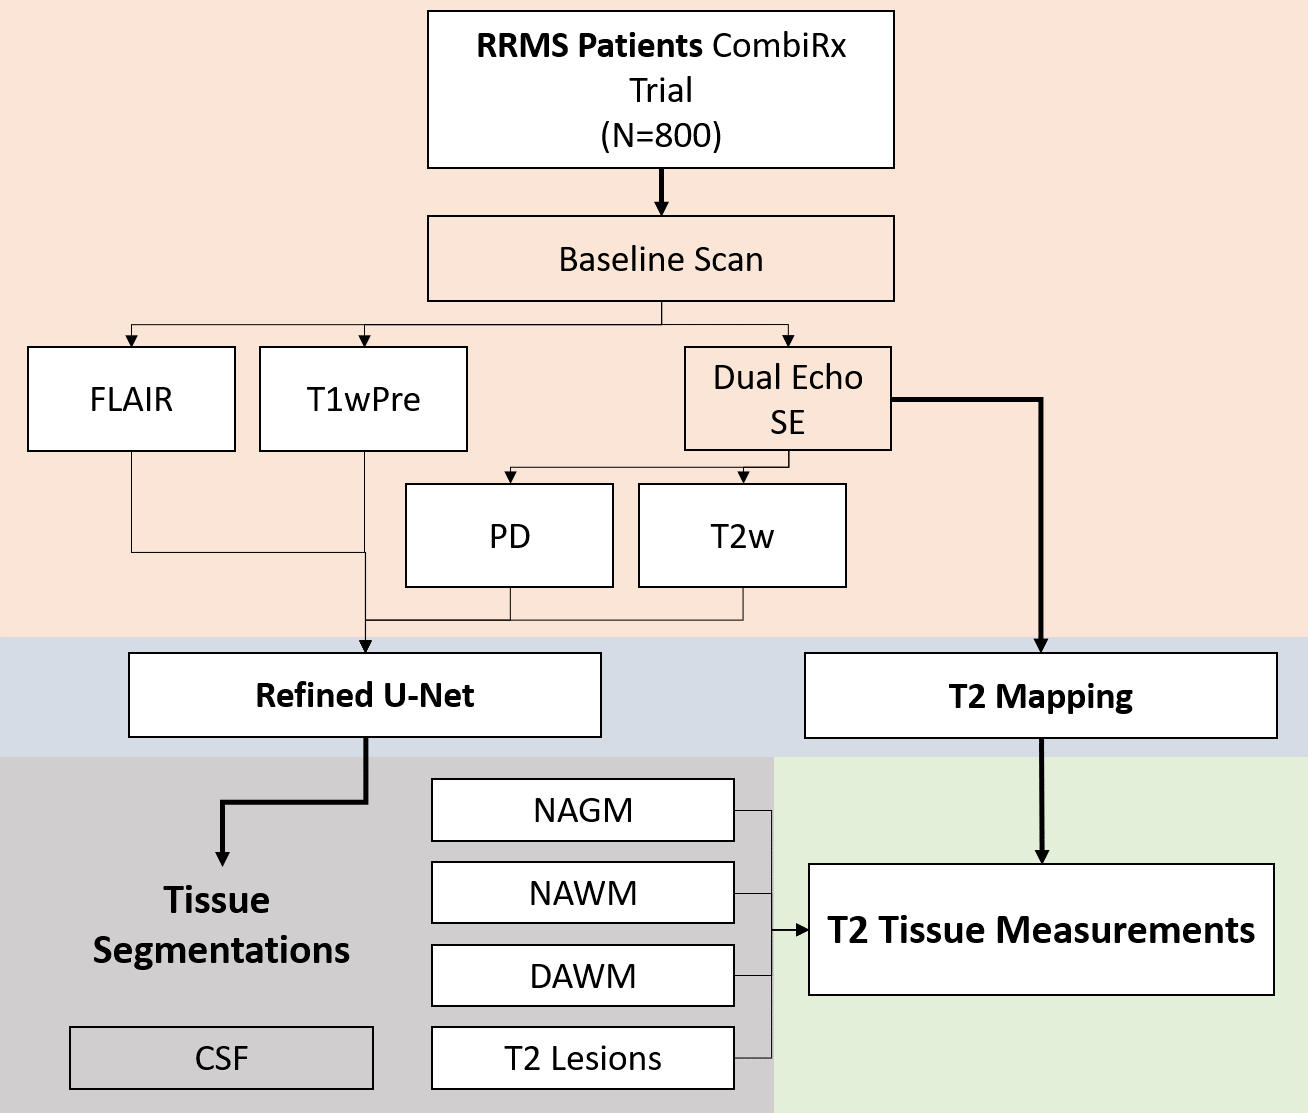
Figure 2. Visual
abstract depicting analysis of baseline MRI scans for tissue T2 measurements
using neural network segmentation and T2 mapping. CSF = cerebrospinal fluid, DAWM = diffusely-abnormal white matter,
FLAIR = fluid-attenuated inversion recovery, NAGM = normal-appearing gray
matter, NAWM = normal-appearing white matter, PD = proton density, RRMS = relapsing-remitting
multiple sclerosis, SE = spin echo
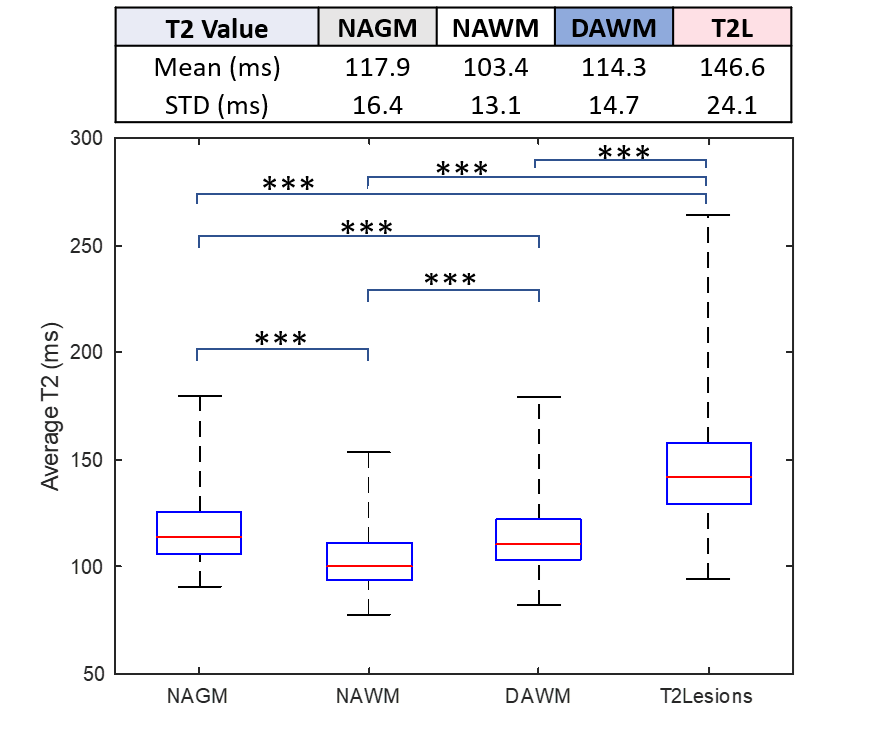
Figure 3. Table
and boxplot comparison of T2 measurements between tissues. Patient-wise
comparison of tissue T2 values using Wilcoxon sign-rank are shown on the
boxplot.
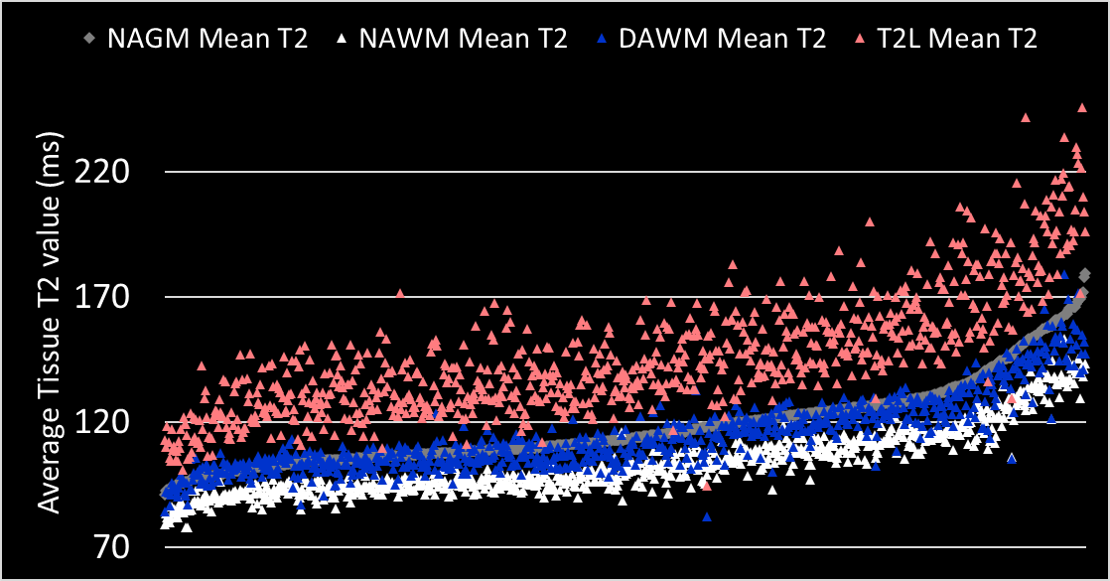
Figure 4. A
scatter plot displaying patient-wise comparison of tissue T2, in order of
increasing NAGM T2.
DOI: https://doi.org/10.58530/2023/2831