2830
Z-score maps to characterize spinal cord lesions in MS patients: Toward a semi-automated lesion identification/segmentation method1Aix Marseille Univ, CNRS, CRMBM, Marseille, France, 2APHM, Hôpital Universitaire Timone, CEMEREM, Marseille, France, 3iLab-Spine, International Associated Laboratory, Montreal, Canada, Marseille, France, 4APHM, Hôpital Universitaire Timone, Département de Neurologie, Marseille, France
Synopsis
Keywords: Multiple Sclerosis, Spinal Cord, z-score maps
Manual segmentation, considered as ground truth, remains time consuming and operator dependent. In this work, a strategy to identify and potentially segment individual cervical spinal cord lesions based on z-score maps(ZM) from 3T quantitative T1-MP2RAGE(T1q) imaging is proposed. All manually segmented lesions could be visually identified in ZM with a lower threshold(LT) of 2. Conversely, Sixty-nine% of the lesions could be isolated automatically using LT=3 and analyzing the characteristics of the ZM clusters in combination with ZM gradient maps. Four patients (/4) without lesions, and 21/23 controls showed no significant cluster.
Introduction
The identification and segmentation of lesions is crucial in the diagnosis, prognosis and follow-up of Multiple Sclerosis patients, especially at the cord level1,2.Interestingly, the quantitative T1-MP2RAGE(T1q) method has recently shown great potential for cord lesion and tissue damage detection at 3T3. Nonetheless, manual lesion segmentation remains a laborious, time-consuming, and operator-dependent task.
Various methods of automatic lesion segmentation, often based on deep learning, have been proposed in the brain4,5 and the spinal cord (SC)6, however they generally do not achieve full agreement as compared to manual segmentation (median DICE ~ 67% 6).
In this study, we investigate the potentialities of unbiased quantitative T1 mapping in identifying and potentially segmenting individual lesions in MS patients, based on T1q z-score maps.
Material and Methods
PopulationFifteen MS patients (11 women/ 4 men, mean age = 31± 6 years, Disease duration = 31±24 months, EDSS = 0.7±1 [0–3] [median [range]]) diagnosed using the revised McDonald criteria2 and twenty-three healthy controls (HC) (10 women/ 13 men, age = 38±13years) participated to the study.
MR acquisition / Lesion detection
All subjects were scanned in a 3T scanner (Siemens Healthcare, Germany) using conventional imaging (T2-w, T2*-w, as well as STIR and post-Gd injection T1-w for MS patients) and a Magnetization 2 Rapid Acquisition Gradient Echoes MP2RAGE7 optimized for SC8 (TI1/TI2 = 650ms/2000ms; α1/α2= 4°/5°; spatial resolution=0.9x0.9x1mm3; Tacq= 7min) with a B1+ map for RF inhomogeneities corrections.
Lesions were first identified by 2 experimented clinicians and then reviewed by 2 additional experts leading to a final consensus reading.
Data analyses
Unbiased T1q map, corrected for B1+inhomogeneities9 were first computed for all participants and then used for manual lesion segmentation (1 clinician + verification agreement with 1 expert) in the subject space.
T1q maps and lesions masks were then co-registered in the PAM5010 space using SCT11.
Averaged T1q maps($$$MeanT_{1q}^{AllHC}$$$) and standard deviation map($$$STDEVT_{1q}^{AllHC}$$$) from the HC cohort were then generated using FSL12. Individual ZM were then computed for each subject i using the z-score formulae:
$$Zscore(i)=\frac{T_{1q}^i-MeanT_{1q}^{AllHC}}{STDEVT_{1q}^{AllHC}}$$
Individual gradient maps were also derivated from z-score maps (ZM) using ANTS13(ImageMath) as complementary information to further characterize lesion edges and center.
Z-score of the manually segmented lesions were first calculated to give a glimpse of the z-score distribution across the lesions.
Conversely, the use of ZMs, combined with different constraints (z-score lower thresholds, cluster size and z-score gradient shape) was then investigated to identify MS lesions.
Results and Discussion
Table.1 summaries the lesions detected for each patient. Four (/15) had no apparent lesion in the cervical cord (C1-C7). A total of 49 lesions was detected over the entire population.Z-score distribution across segmented lesions
Fig.1A shows the mean, standard deviation (STDEV), Minimum (Min), Maximum (Max), Median of z-score, and volume and voxel size of each segmented lesion. No correlations were observed between z-score and lesion volume (Pearson correlation coefficient, r=0.32). Fig.1B summaries the number of manually segmented lesions detected when using different lower z-score thresholds (LT). No single threshold could characterize all the lesions.
Lesion identification based on z-score maps and gradients
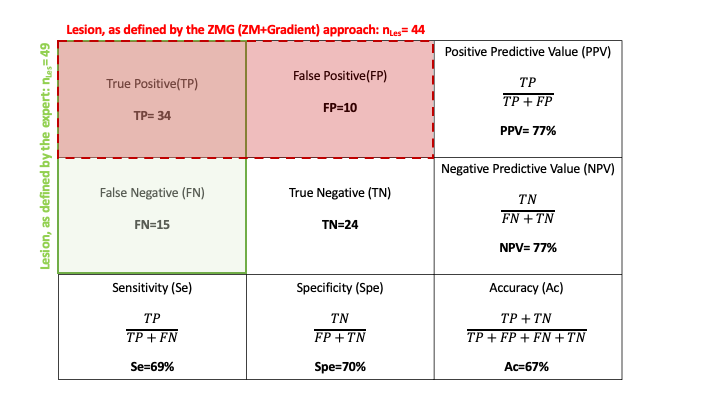
Heterogeneity of patient lesions in terms of contrast, edge delineation, size or position (i.e near cerebrospinal fluid (CSF) makes the use of a unique threshold for ZM impossible. An empirical approach was thus defined: (i) a starting z-score threshold of 3 was first applied on all individual ZM (Fig.2C) to minimize the number of false positive (FP) (as shown on Fig.2B, despite this threshold, a few clusters remain near the CSF/cord interface) (ii) cluster_size <35 voxels were excluded (which preserves 48 lesions/49) ; (iii) the z-score gradient map (scaled between 1 and individual maximal gradient value) (Fig.2D) was then used to exclude clusters according to the criterion of having a ring shape with a center intensity <1. Using this approach (ZMG), all patients without lesions and 21/23 (i.e 91%) controls without tissue damage showed no significant lesion cluster and a total of 34/49 lesions were detected. Sensitivity/ Specificity were 0.69 and 0.70, respectively (Table.2).
False Positive/False Negative were most often explained by artefacts and partial volume effects, especially in the vicinity of CSF. It would be interesting to investigate similar approaches using 7T imaging from which higher spatial resolution can be reached within the same acquisition time (Fig.3).
Conclusion and Perspectives
In this exploratory work, z-score maps associated to qT1-MP2RAGE acquisition in MS patients were proposed for the first time in spinal cord to facilitate lesion identification and potentially segmentation.At least all segmented lesions could be identified visually in the z-score maps and 69% could be isolated automatically by analyzing the z-scores maps combined to associated gradient maps.
Short-term perspectives involve: enrichment of the database with new HC and MS data to be computed, z-score map study on 7T T1q data to evaluate whether SNR and higher resolution improve the results, automated method to generate lesion masks from ZMGs, open source availability, and multi-center study.
Acknowledgements
This work was supported by ARSEP Foundation, France Life Imaging and A*midex.The authors thanks C.Costes, P. Viout, V. Gimenez and MP.Ranjeva for study logistics, as well as P.Lehman, N. Fabiani and B. Testud for lesion consensus reading.
References
1. Kearney H, Altmann DR, Samson RS, et al. Cervical cord lesion load is associated with disability independently from atrophy in MS. Neurology. 2015;84(4):367-373. doi:10.1212/WNL.0000000000001186
2. Vattoth S, Kadam GH, Gaddikeri S. Revised McDonald Criteria, MAGNIMS Consensus and Other Relevant Guidelines for Diagnosis and Follow Up of MS: What Radiologists Need to Know? Curr Probl Diagn Radiol. 2021;50(3):389-400. doi:10.1067/j.cpradiol.2020.06.006
3. Demortière S, Lehmann P, Pelletier J, Audoin B, Callot V. Improved Cervical Cord Lesion Detection with 3D-MP2RAGE Sequence in Patients with Multiple Sclerosis. Am J Neuroradiol. 2020;41(6):1131-1134. doi:10.3174/ajnr.A6567
4. Zeng C, Gu L, Liu Z, Zhao S. Review of Deep Learning Approaches for the Segmentation of Multiple Sclerosis Lesions on Brain MRI. Front Neuroinformatics. 2020;14:610967. doi:10.3389/fninf.2020.610967
5. García-Lorenzo D, Francis S, Narayanan S, Arnold DL, Collins DL. Review of automatic segmentation methods of multiple sclerosis white matter lesions on conventional magnetic resonance imaging. Med Image Anal. 2013;17(1):1-18. doi:10.1016/j.media.2012.09.004
6. Gros C, De Leener B, Badji A, et al. Automatic segmentation of the spinal cord and intramedullary multiple sclerosis lesions with convolutional neural networks. NeuroImage. 2019;184:901-915. doi:10.1016/j.neuroimage.2018.09.081
7. Marques JP, Kober T, Krueger G, van der Zwaag W, Van de Moortele PF, Gruetter R. MP2RAGE, a self bias-field corrected sequence for improved segmentation and T1-mapping at high field. NeuroImage. 2010;49(2):1271-1281. doi:10.1016/j.neuroimage.2009.10.002
8. Rasoanandrianina H, Massire A, Taso M, et al. Regional T1 mapping of the whole cervical spinal cord using an optimized MP2RAGE sequence. NMR Biomed. 2019;32(11):e4142. doi:10.1002/nbm.4142
9. Massire A, Taso M, Besson P, Guye M, Ranjeva JP, Callot V. High-resolution multi-parametric quantitative magnetic resonance imaging of the human cervical spinal cord at 7T. NeuroImage. 2016;143:58-69. doi:10.1016/j.neuroimage.2016.08.055
10. De Leener B, Fonov VS, Collins DL, Callot V, Stikov N, Cohen-Adad J. PAM50: Unbiased multimodal template of the brainstem and spinal cord aligned with the ICBM152 space. NeuroImage. 2018;165:170-179. doi:10.1016/j.neuroimage.2017.10.041
11. De Leener B, Lévy S, Dupont SM, et al. SCT: Spinal Cord Toolbox, an open-source software for processing spinal cord MRI data. NeuroImage. 2017;145:24-43. doi:10.1016/j.neuroimage.2016.10.009
12. Jenkinson M, Beckmann CF, Behrens TEJ, Woolrich MW, Smith SM. FSL. NeuroImage. 2012;62(2):782-790. doi:10.1016/j.neuroimage.2011.09.015
13. Avants BB, Tustison NJ, Song G, Cook PA, Klein A, Gee JC. A reproducible evaluation of ANTs similarity metric performance in brain image registration. NeuroImage. 2011;54(3):2033-2044. doi:10.1016/j.neuroimage.2010.09.025Figures
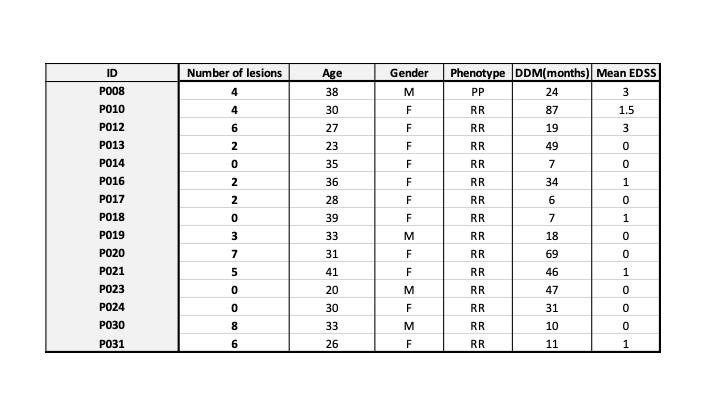
Table.1: Demographic information of MS cohort – RRMS (Relapsing Remitting ): 14; PP (Primary Progressive): 1; Mean EDSS : 0.7±1; DD: Disease duration in months; ID: patient identifier. A total of 49 lesions was detected in the cervical spinal cord (C1-C7)
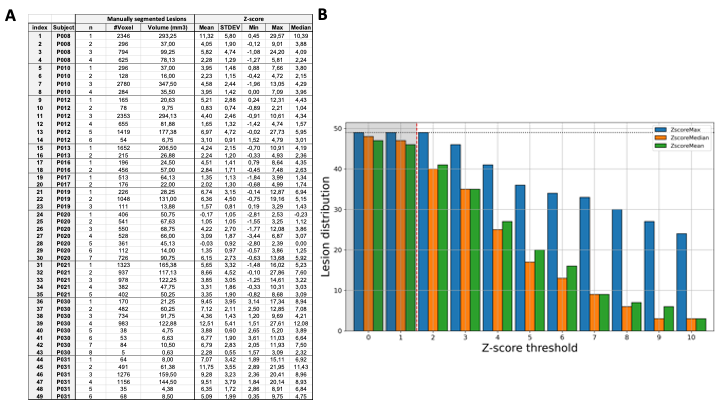
Figure.1: (A) Manually segmented lesions (n) of each MS patients with voxel / volume and mean, standard deviation (STDEV), Minimum (Min), Maximum (Max) and Median of z-scores within the segmented ROI.(B) Lesion distribution as a function of z-score threshold. The dotted horizontal line represents the maximum number of lesions (nLes=49) and the shaded area below a threshold of 2 represents non-significant value. For instance, 41 (/49) lesions (ie. 84%) presented with a mean z-score ≥ 2; 20 lesions (41%) with a mean-zscore ≥ 5.
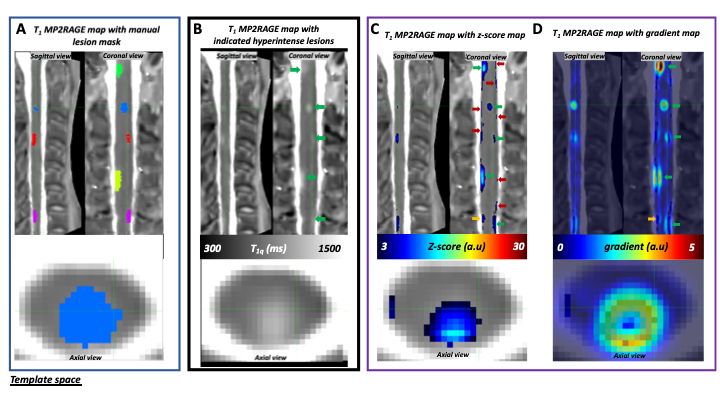
Figure.2: (A) Manual lesion segmentation by the expert. (B)3T T1-MP2RAGE map of MS-patient P021 co-registered in PAM50 template space in sagittal, coronal, and axial (C2 level) views, with lesions identified by the experts pointed with green arrows (nLes=5). (C) z-score map thresholded at 3 and (D) z-score gradient map. Orange arrows indicate doubtful signals and red arrows indicate false positives (FP) signals, mostly at the outer surface of the cord and attributed to partial volume effect, present on z-score maps but that are eliminated once combined with gradient maps.
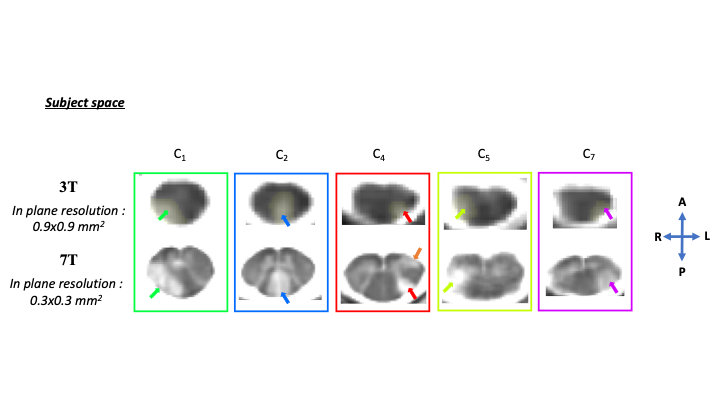
Figure.3: T1-MP2RAGE map of MS patient P021 in subject space in axial view on the lesioned levels identified by the experts at both 3T and 7T : (top part) nLes=5 at 3T (expert and z-score approach) and (bottom part) nLes=6 at 7T (a supplementary lesion, was identified by the experts and is pointed with an orange arrow). Thanks to increased resolution and contrast, lesion contours are more resolved and therefore better delineated at 7T. The z-score map approach should now be investigated for 7T data.