2829
Myelin Volume Fraction Estimation in Multiple Sclerosis Lesions1Electrical and Computer Engineering, Cornell University, Ithaca, NY, United States, 2Department of Radiology, Weill Cornell Medicine, New York, NY, United States, 3Department of Neurology, Weill Cornell Medicine, New York, NY, United States, 4Biomedical Engineering, Cornell University, Ithaca, NY, United States
Synopsis
Keywords: Multiple Sclerosis, White Matter
Monitoring myelin content quantitatively is important in the study of Multiple Sclerosis (MS). Here, a novel approach is proposed to estimate myelin volume fraction (MVF) of MS lesions from routine multi-echo gradient echo (mGRE) using biophysical modeling of the myelin sheaths. The obtained MVF values correlated significantly with the myelin water fraction (MWF) values obtained in the same lesions using conventional multicomponent T2 relaxometry. Moreover, the change in MVF values in newly enhancing lesions over the first year also correlated significantly with the change in MWF values over the same period.Introduction
Multiple sclerosis (MS) is an autoimmune disease that manifests with several symptoms such as edema, inflammation, and demyelination1. The loss of the myelin content and the failure of the oligodendrocytes to repair the damaged myelin sheaths characterizes the process of demyelination and the corresponding cause is still an open question2. The quantitative measurement of myelin content in the central nervous system is of great interest in clinical MS research. Myelin water fraction imaging is a promising imaging modality for this purpose3. It traditionally uses a 3-compartment multi-exponential fitting of multi-echo spin echo (MESE) signal exploiting the relatively small values of the myelin water3,4. However, due to the long acquisition times of the spin echo-based signals, faster methods that use-prep pulses with gradient echo readouts have been developed, such as FAST-T25.Recently, multi-gradient Echo (mGRE) methods have been proposed to perform MWF mapping, either using magnitude6 or the complex signal7. The MWF maps obtained using this approach are highly susceptible to noise due to the high number of parameters fitted, and the authors suggested the usage of relatively low resolution and long acquisition times. Hédouin et al.8 proposed a dictionary-matching algorithm to quantify white matter microstructural properties based on Hollow Cylindrical Fiber Model9. In this study, an extension of the dictionary matching approach is utilized to obtain quantitative myelin volume fraction values of MS lesions from routine clinical mGRE acquisition utilizing both the magnitude signal decay modeling and Quantitative Susceptibility Mapping (QSM) modeling of the phase10.
Methods
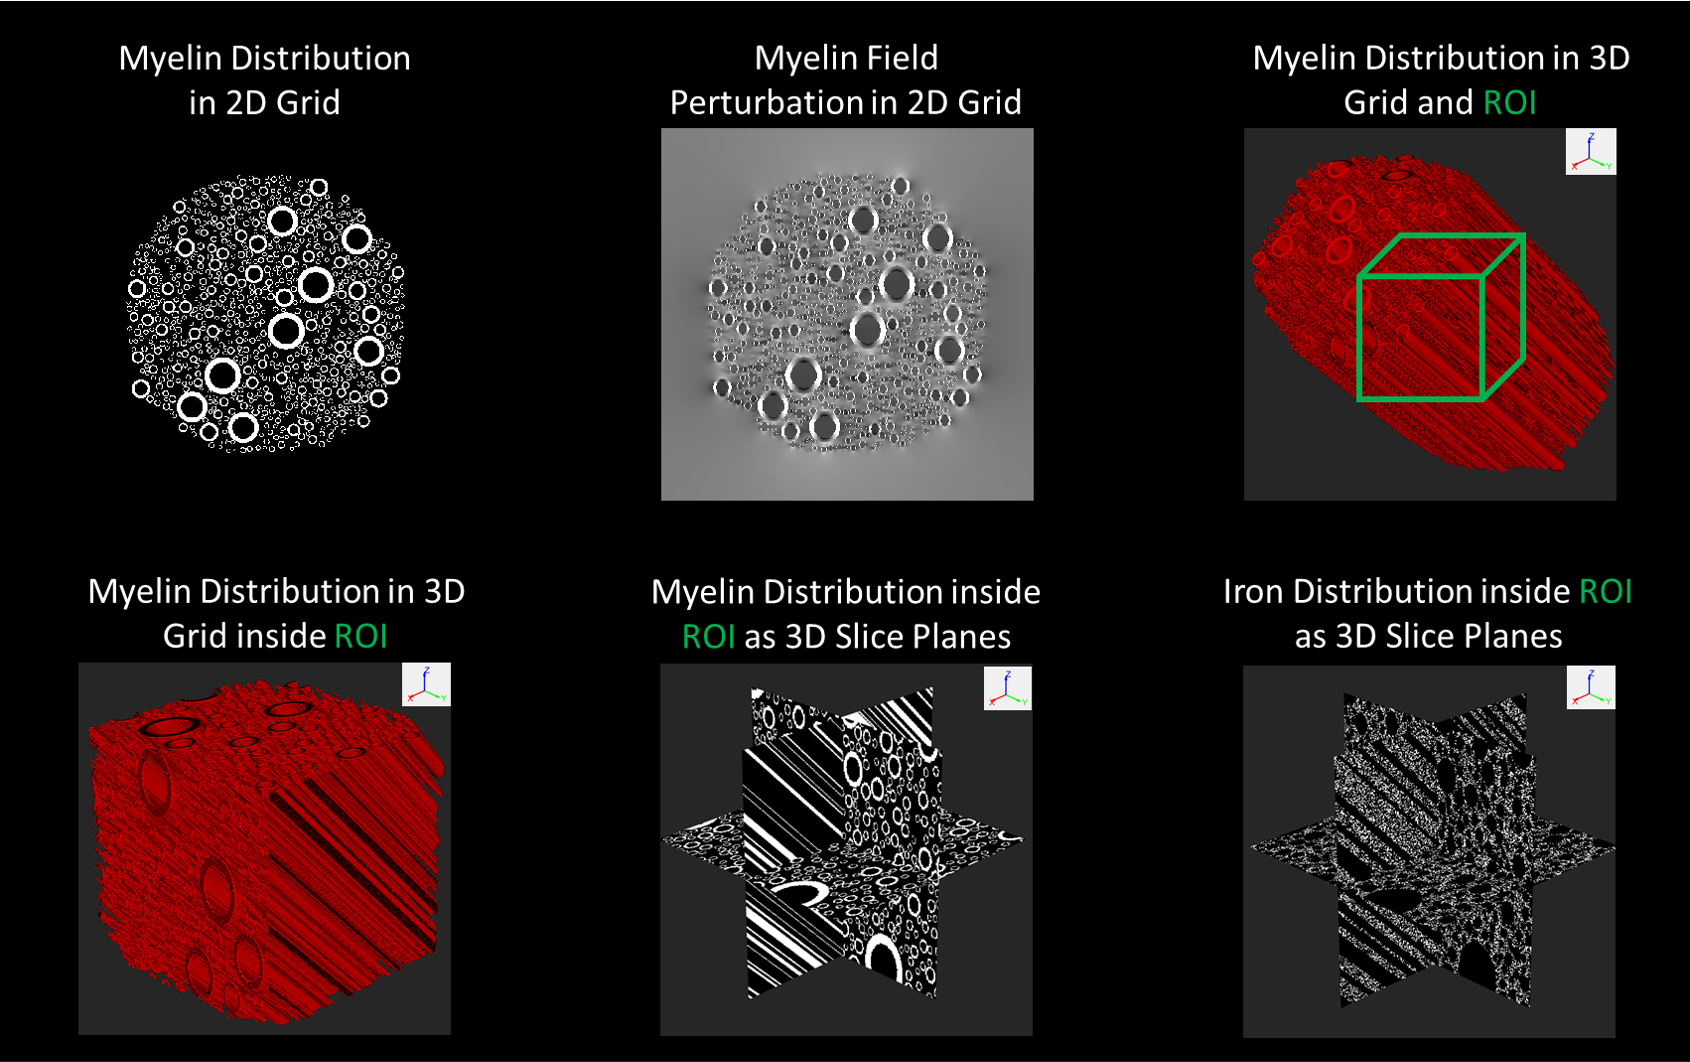
The numerical simulation-based dictionary simulation is summarized in Figure 1. For each simulated volume a magnitude signal decay and a scalar bulk susceptibility are computed. To estimate the myelin content from mGRE signal, a voxel-wise dictionary matching is performed. The similarity index is chosen as a weighted sum of the cosine similarity between the dictionary and the measured magnitude signal evolutions; and the absolute difference between the total susceptibility of the dictionary elements and the QSM of each voxel. An important point here is that HCFM requires fiber orientation information with respect to the main magnetic field of the MR scanner. This information can either be obtained from an additional Diffusion Tensor Imaging (DTI) scan or a DTI Atlas-based orientation map can be utilized. ICBM DTI-81 atlas is utilized in this study11.In order to assess the performance of the proposed method on MS lesion MVF quantification, a dataset of MS patient scans is used under an IRB-approved retrospective protocol. Two different datasets are used for evaluation purposes. The first dataset consisted of mGRE and DTI scans of 50 MS patients with 410 MS lesions in total. The mGRE data were acquired with voxel size = 0.75×0.75×3 mm3; first echo time (TE) = 6.3 ms; echo spacing (ΔTE) = 4.1 ms; the number of echoes (NE)=10; repetition time (TR) = 48 ms; flip angle = 15°; and readout bandwidth = 260 Hz/pixel. DTI data were acquired using Single-Shot Spin-Echo EPI-DWI with 30 diffusion encoding directions and b=1000 s/mm2. The voxel size was 1.9×1.9×2.5mm3.
A second data dataset of 12 MS patients with 44 new Gadolinium-enhancing lesions with 1-year follow-up scans is also used for longitudinal assessment of the proposed method. Fast acquisition with spiral trajectory and T2prep (FAST-T2) based MWF maps are used as the reference method5. The FAST-T2 data were acquired with 0.9×0.9×5 mm3 voxel size and with 6 T2prep echo times (0, 7.5, 17.5, 67.5, 147.5, 307.5 ms).
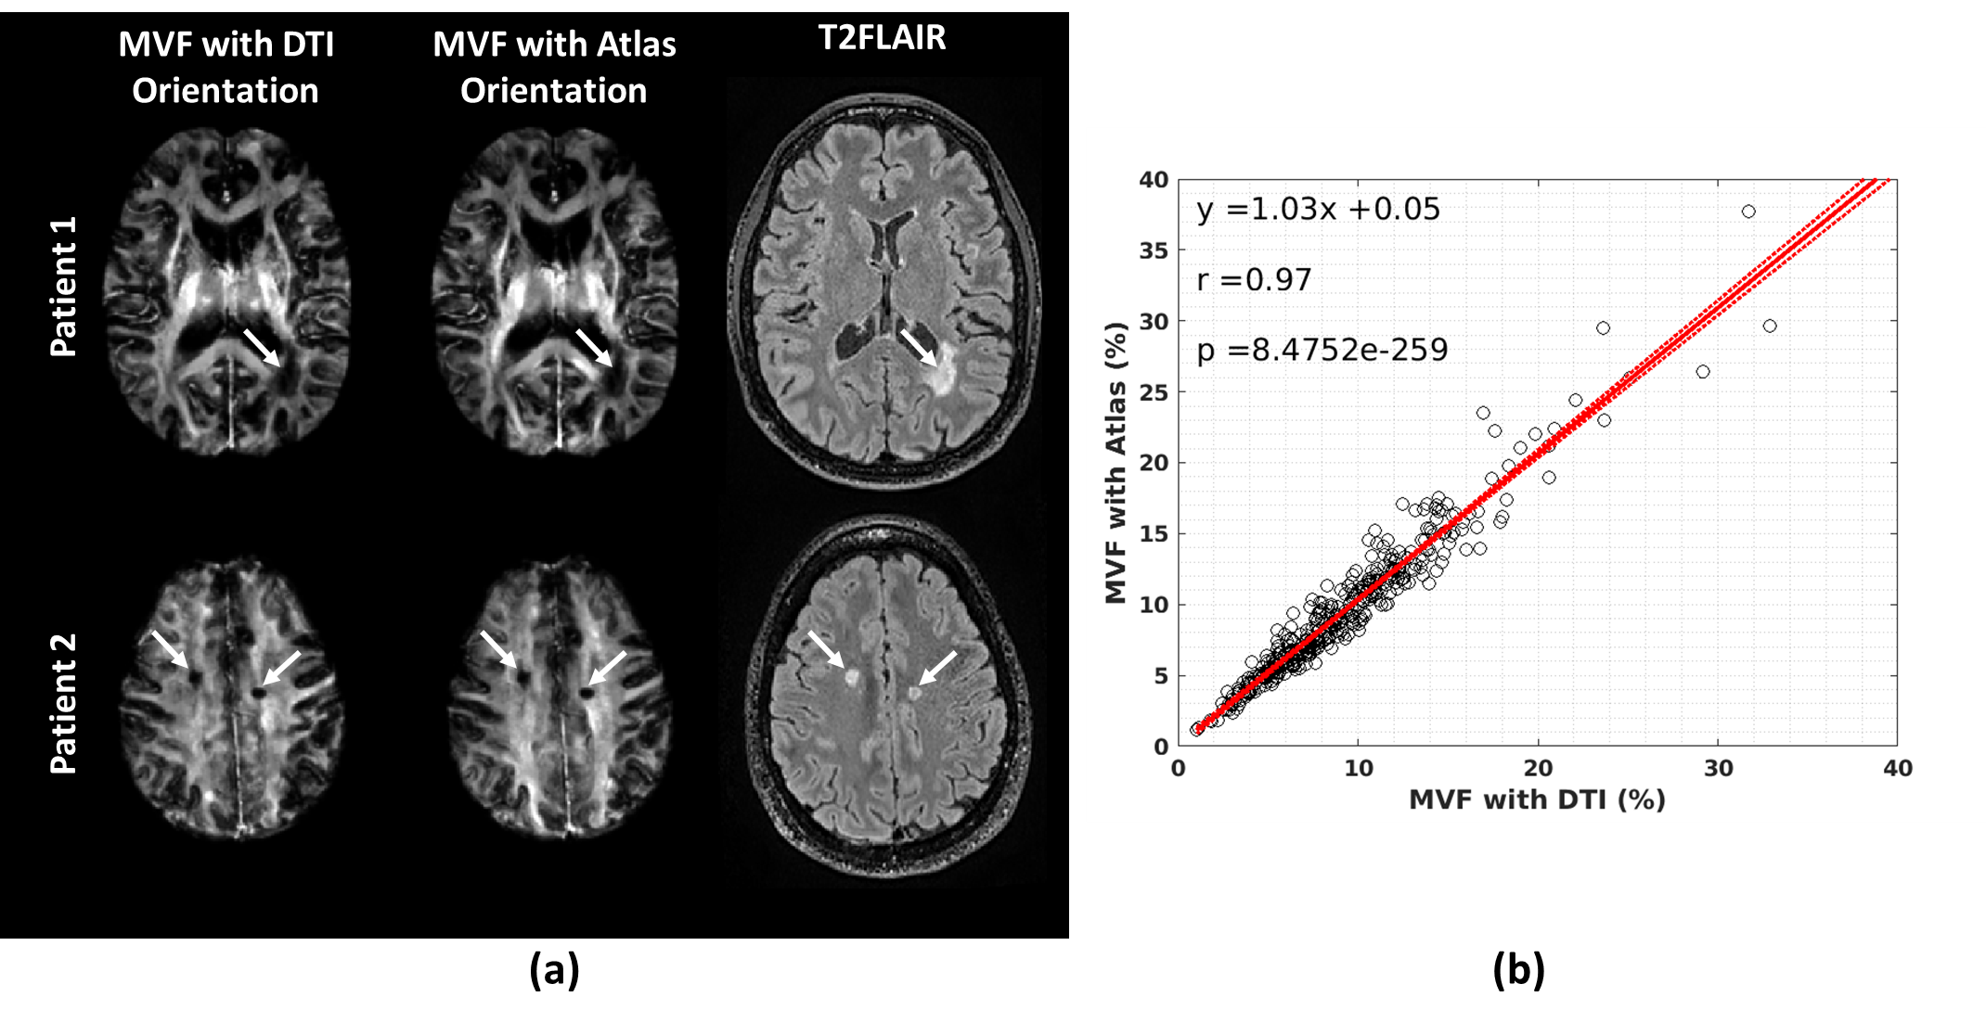
In order to validate the usability of the DTI Atlas for the fiber orientation source, MVF maps of the 50 MS patient dataset are reconstructed and the linear regression analysis on the lesion is conducted between the maps obtained with two different orientation maps is conducted.
Results
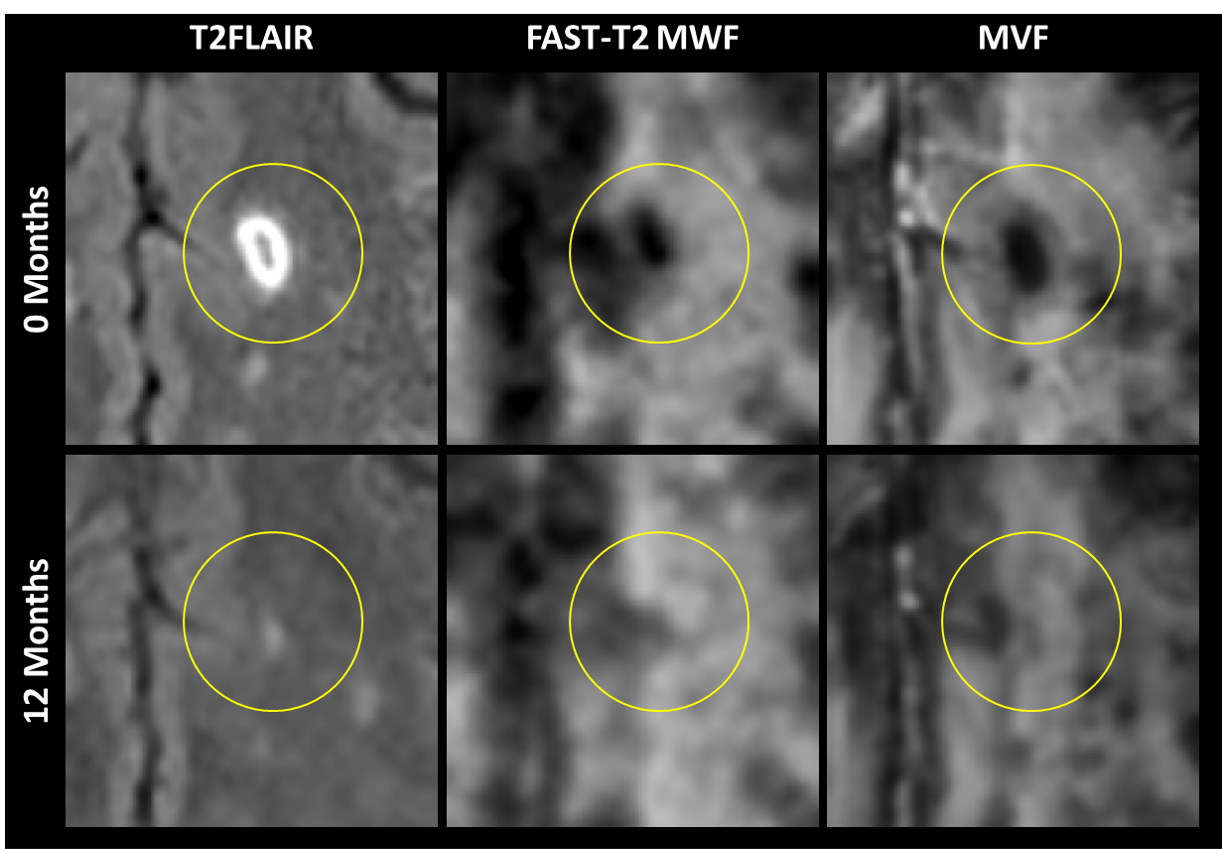
Sample MVF maps, T2FLAIR images, and the results of the linear regression analysis are presented in Figure 2.An example of the enhancing lesions is demonstrated in Figure 3 for the scans at the onset and 12 months after the onset of enhancement. T2FLAIR and FAST-T2 MWF images are also shown as references.
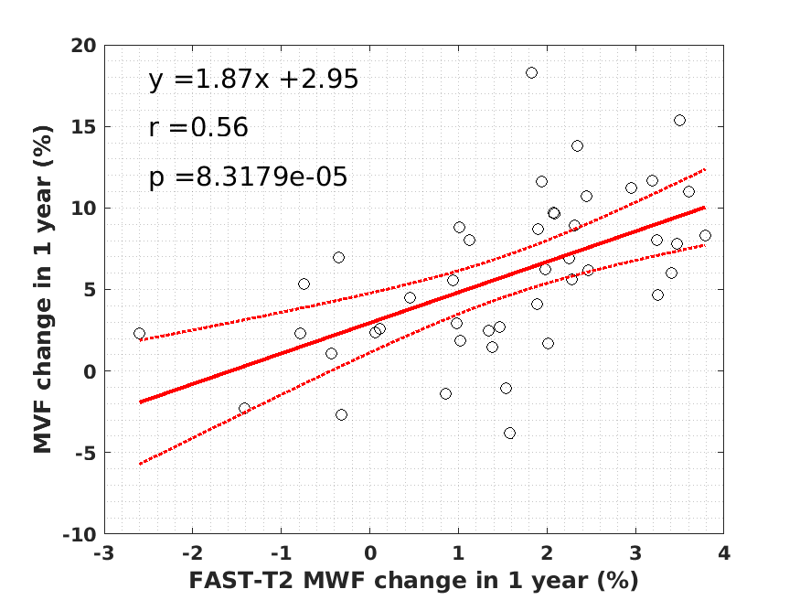
In Figure 4, the linear regression analysis between the change in the mean values of the MVF and FAST-T2 MWF 12 months after the onset of enhancement.
Discussion and Conclusion
In this study, we present a novel approach based on dictionary matching using mGRE data to quantify the myelin content in MS lesions. Although the physical model requires fiber orientation, here we show that a DTI Atlas-based orientation map can be employed for this purpose without the loss of accuracy. Moreover, lesion MVF values showed a significant correlation with multicomponent T2 relaxometry-derived MWF values in the longitudinal dataset. Thus, we confirm the proposed approach is a promising tool for the monitoring of myelin content in MS patients.Acknowledgements
This work was supported in part by the NIH R01NS105144, and NMSS RR-1602-07671.References
1 Dobson R, Giovannoni G. Multiple sclerosis–a review. European journal of neurology. 2019;26(1): 27-40.
2. Miller RH, Mi S. Dissecting demyelination. Nature neuroscience. 2007;10(11):1351-1354.
3. Laule C, Vavasour IM, Moore GRW, Oger J, Li DK, Paty DW, MacKay AL. Water content and myelin water fraction in multiple sclerosis. Journal of neurology. 2004;251(3):284-293.
4. Lee J, Hyun JW, Lee J, Choi EJ, Shin HG, Min K, Nam Y, Kim HJ, Oh SH. So you want to image myelin using MRI: an overview and practical guide for myelin water imaging. ournal of Magnetic Resonance Imaging. 2021;53(2):360-373.
5. Nguyen TD, Deh K, Monohan, E. PS, Spincemaille P, Raj A, Wang Y, Gauthier SA. Feasibility and reproducibility of whole brain myelin water mapping in 4 minutes using fast acquisition with spiral trajectory and adiabatic T2prep (FAST‐T2) at 3T. Magnetic resonance in medicine. 2016;76(2):456-465.
6. Du YP, Chu R, Hwang D, Brown MS, Kleinschmidt‐DeMasters BK, Singel D, Simon JH. Fast multislice mapping of the myelin water fraction using multicompartment analysis of T decay at 3T: A preliminary postmortem study. Magnetic Resonance in Medicine: An Official Journal of the International Society for Magnetic Resonance in Medicine. 2007;58(5):865-870.
7. Nam Y, Lee J, Hwang D, Kim DH. Improved estimation of myelin water fraction using complex model fitting. NeuroImage. 2015 214-221.
8. Hédouin R, Metere R, Chan KS, Licht C, Mollink J, Van Walsum AMC, Marques JP. Decoding the microstructural properties of white matter using realistic models. NeuroImage. 2021;237:118138.
9. Wharton S, Bowtell R. Fiber orientation-dependent white matter contrast in gradient echo MRI. Proceedings of the National Academy of Sciences. 2012;109(45):18559-18564.
10. Liu J, Liu T, de Rochefort L, Ledoux J, Khalidov I, Chen W, Tsiouris AJ, Wisnieff C, Spincemaille P, Prince MR, et al. Morphology enabled dipole inversion for quantitative susceptibility mapping using structural consistency between the magnitude image and the susceptibility map. Neuroimage. 2012;59(3):2560-2568.
11. Mori S, Oishi K, Jiang H, Jiang L, Li X, Akhter K, Hua K, Faria AV, Mahmood A, Woods R, et al. Stereotaxic white matter atlas based on diffusion tensor imaging in an ICBM template. Neuroimage. 2008;40(2):570-582.
Figures