2828
Time-dependent Diffusion in Acute and Chronic Plaques of Multiple Sclerosis Investigated with Oscillating-gradient Spin-echo.1Juntendo University School of Medicine, Tokyo, Japan, 2Toho University Omori Medical Center, Tokyo, Japan, 3Siemens Healthcare K.K., Tokyo, Japan, 4Faculty of Health Data Science, Juntendo University, Chiba, Japan, 5The University of Tokyo, Tokyo, Japan
Synopsis
Keywords: Multiple Sclerosis, Diffusion/other diffusion imaging techniques, Microstructure
The purpose of our study was to investigate the utility of changes in diffusivity between short and long diffusion time in evaluating acute and chronic plaques of multiple sclerosis. Chronic plaques showed weak diffusion time-dependence with diffusion times between 6.5 ms and 35.2 ms. The differences in diffusion time-dependence were attributed to the internal structure of plaques. DWI with a short diffusion time may provide additional information about the microstructure of MS plaques.Introduction
Oscillating gradient spin-echo (OGSE) sequences can shorten diffusion times by replacing the long-lasting diffusion-sensitizing gradients used in pulsed gradient spin-echo (PGSE) methods with rapidly oscillating gradients1~5. It is expected that diffusion-weighted imaging (DWI) with the OGSE sequence can estimate the substrate's viscosity and spatially restricted diffusion on the basis of the internal structures of pathologic lesions from changes in the ADC values with differing diffusion times6,7. We hypothesized that changes in diffusion tensor imaging (DTI) eigenvalues and mean diffusivity (MD) acquired with a shorter diffusion time using OGSE combined with PGSE might enable to estimate the internal structure of plaques of multiple sclerosis (MS) more precisely than PGSE alone. The purpose of our study was to investigate the utility of changes in diffusivity between short and long diffusion times in evaluating acute and chronic plaques of MS.Methods
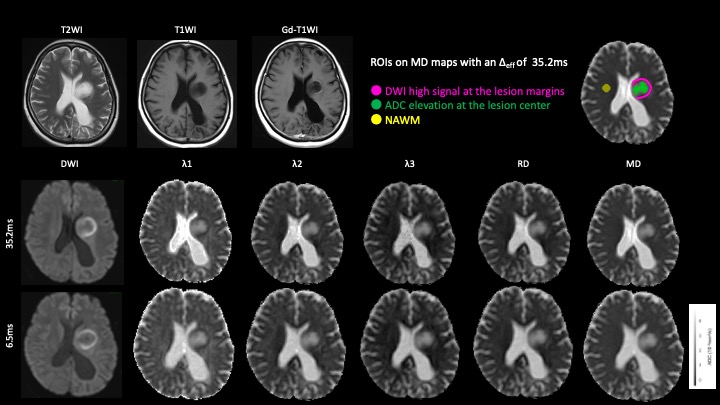
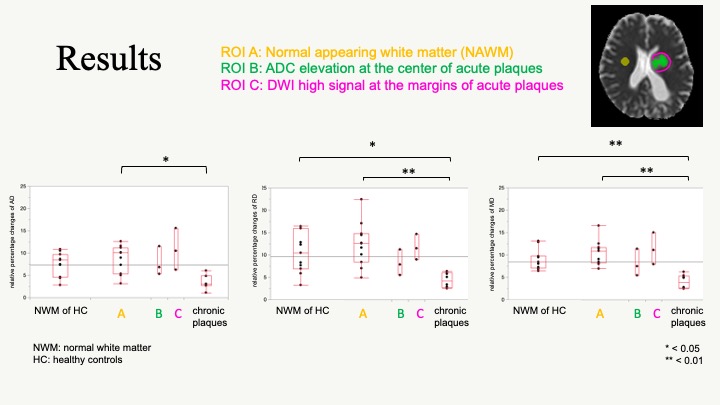
Three MS patients with acute plaques and 8 MS patients with chronic plaques were scanned using a 3T MR scanner (MAGNETOM Prisma, Siemens Healthcare GmbH, Erlangen, Germany). MRI data from 11 patients without intracranial lesions were included for comparison. DTI was performed with a prototype sequence using b-values of 0 and 1000 s/mm2 and six uniformly distributed directions. OGSE using a trapezoid-cosine waveform was performed with effective diffusion time (Δeff) of 6.5 ms and 35.2 ms8. Other parameters were as follows: TR, 4800 ms; TE, 101 ms; FOV, 200 × 200 mm2; matrix size, 82 × 82; slice thickness, 5 mm; and acquisition time, approximately 2 mins. Acute plaques were defined as plaques with contrast enhancement or new or enlarging plaques. Regions of interest (ROIs) of acute plaques were set at the lesion margin showing DWI high signal and the lesion center with high ADC (Fig. 1). Chronic plaques were defined as being stable without enlargement or shrinkage for more than one year, and a white matter area > 5 mm in diameter, with abnormally high intensity on T2WI and FLAIR images. ROIs of chronic plaques were set at high intensity areas on T2WI and FLAIR images. Normal appearing white matter (NAWM) was manually segmented on the white matter while avoiding plaques. The AD, RD, and MD for each lesion were measured with ROIs. The relative percentage change between shorter and longer diffusion times was then calculated.When the Kruskal Wallis test was performed and a difference was found, the relative percentage changes of the margins of acute plaques showing DWI high signal, the center of acute plaques with elevated ADC, chronic plaques, NAWM of MS patients, and normal white matter (NWM) of healthy controls were compared using a multiple comparison test by Steel-Dwass test (P < 0.05).Results
The relative percentage changes of AD were significantly lower in chronic plaques than in NAWM of MS patients (Fig. 2). The relative percentage changes of RD and MD were significantly lower in chronic plaques than in NWM of healthy controls and NAWM of MS patients. The relative percentage changes of AD, RD, and MD were not significantly different between acute plaques and other lesions. The relative percentage changes of AD, RD, and MD were not significantly different between the margins showing DWI high signal and the center of acute plaques with elevated ADC.Discussion
Previous studies have reported that chronic plaques are less diffusion time-dependent than NAWM9. The results of our study are consistent with previous studies. These results suggest that chronic plaques have a sparse internal structure compared to NAWM. Although not significantly different, the relative percentage changes of acute plaques tended to be higher than that in chronic plaques. It may be due to the sparser structure and lower diffusion time dependence of the chronic plaques than the acute plaques. The relative percentage changes of AD, RD, and MD were not significantly different between acute plaques, NWM of healthy controls, and NAWM of MS patients. Acute plaques show demyelination and edema at the center and inflammatory cell infiltration at the margins10-12. In the range of diffusion times between 6.5 ms and 35.2 ms, the relative percentage change may not be sensitive enough to capture these abnormalities. Although not significantly different, the relative percentage changes of the margins showing DWI high signal tended to be higher than that of the center of acute plaques with elevated ADC. Acute plaques show demyelination and edema at the center and inflammatory cell infiltration at the margins, and water molecules tend to move more easily in the central area10-12. Therefore, the diffusion time dependence may be higher at the margins than at the center of acute plaques.Mean square distances of water molecule movement for diffusion times of Δeff = 6.5 ms and 35.2 ms at body temperature are 10.8 μm and 25.1 μm, respectively13. Though the diffusion time that we can probe with a clinical MR scanner is still too long for direct quantification of cell sizes14, the differences in relative percentage changes among plaque types and NAWM presumably reflect the differences in the structural complexity of lesions15,16.Conclusion
Chronic plaques showed weak diffusion time-dependence, suggesting their sparse internal structures. DWI with a short diffusion time may provide additional information about the microstructure of MS plaques.Acknowledgements
This work was supported in part by JSPS KAKENHI (grant no. 18K15643).References
1. Martin M. Magn Reson Insights. 2013;6:59-64.
2. Does MD, Parsons EC, Gore JC. Magn Reson Med. 2003;49:206-215.
3. Aggarwal M, Jones MV, Calabresi PA, et al. Magn Reson Med. 2012;67:98-109.
4. Wu D, Martin LJ, Northington FJ, et al. Magn Reson Med. 2014;72:1366-1374.
5. Novikov DS, Jensen JH, Helpern JA, et al. Proc Natl Acad Sci U S A. 2014;111:5088-5093.
6. Baron CA, Kate M, Gioia L, et al. Stroke. 2015;46:2136-41.
7. Andica C, Hori M, Kamiya K, et al. Magn Reson Med Sci. 2018;17:2692-72.
8. Van AT, Holdsworth SJ, Bammer R. Magn Reson Med. 2014;71:83-94.
9. Lee HH, Papaioannou A, Kim SL, et al. Commun Biol. 2020;3(1):354.
10. Roychowdhury S, Maldjian JA, Grossman RI. AJNR Am J Neuroradiol. 2000;21(5):869-874.
11. Nusbaum AO, Lu D, Tang CY, et al. AJR Am J Roentgenol. 2000;175(3):821-825.
12. Degaonkar MN, Jayasundar R, Jagannathan NR. J Magn Reson Imaging. 2002;16(2):153-159.
13. Einstein A. Ann Phys. 1906;324(2):371.
14. Reynaud R. Front Phys. 2017;5(58):1-16.
15. Novikov DS, Jensen JH, Helpern JA, et al. Proc Natl Acad Sci U S A. 2014;111(14):5088-5093.
16. Xu J, Attia A, Arlinghaus LR, et al. Proceedings of the International Society for Magnetic Resonance in Medicine; 2018 June 16-21; Paris, France. 0953.
Figures