2826
Comparison of chi-separation and chi-separation*: A clinical feasibility study1Radiology, Seoul St. Mary's Hospital, Seoul, Korea, Republic of, 2Radiology, Johns Hopkins University, Baltimore, MD, United States, 3F.M. Kirby Research Center for Functional Brain Imaging, Kennedy Krieger Institute, Baltimore, MD, United States, 4Electrical and Computer Engineering, Seoul National University, Seoul, Korea, Republic of, 5Neurology, Seoul St. Mary's Hospital, Seoul, Korea, Republic of
Synopsis
Keywords: Multiple Sclerosis, Quantitative Susceptibility mapping
While χ-separation gives unique and valuable information, requirement of R2 limited its clinical application. This study assessed the clinical feasibility of two R2*-based magnetic source separation. From 24 MR scans of MS subjects, four sets of magnetic source separation maps were generated; (1) χ-separation (originally proposed method), (2) χ-separation* (exploiting R2*), (3) χ-sepnet (DL-based), and (4) χ-sepnet* (DL-based, utilizing R2*). χ-separation* and χ-sepnet* showed good agreement to χ-separation and χ-sepnet in MS lesions and the brain. However, there are small but consistent biases in each method, which are important caveats for R2*-based χ-separation. These biases were relatively smaller in χ-sepnet*.Introduction
Recent advances of the MRI regarding phase contrast and magnetic property mapping gives another clinical value of MRI. Among them, chi-separation, or χ-separation (1) is a novel method for the separation of two different magnetic susceptibilities (para- and diamagnetic). It enables the detailed in vivo investigation of the brain tissues and their pathologic changes of several important diseases such as multiple sclerosis (MS)(2,3). The proposed method required R2’(=R2-R2*) and frequency mapping for mapping positive and negative sources of each voxel. While R2* and local frequency mapping could be obtained from multi-echo gradient echo image (MGRE), additional R2 mapping is required for R2’, which is very challenging to acquire in clinical situations. To mitigate this problem, several methods providing R2*-based χ-separation has been proposed (4,5), such as χ-sepnet*. In this work, the clinical feasibility of these approaches was explored, as compared to the original x-separation.Methods
This study included 12 participants diagnosed with multiple sclerosis and their 24 MR exams. MRI was performed with dedicated protocols for neuroinflammatory diseases using 3T MRI (Magnetom Vida) and 64 channel coil. It included MGRE for local frequency and R2* mapping and dual-echo turbo spin echo (DE-TSE) for R2 mapping. The MGRE data were acquired with 0.7x0.7x1 mm3 resolution, TE/𝚫TE/TR = 6.2/5.6/30 ms, 4 echoes. The parameters of DE-TSE were as follows: 0.6x0.6x2 mm3 resolution, TE1/TE2/TR = 10/100/11000 ms. To estimate the local frequency map, the phase images of MGRE were sequentially processed with ROMEO for phase unwrapping (6), V-SHARP for background removal (7), and weighted echo averaging. R2 were estimated by matching the dictionary generated by StimFit toolbox (7) to DE-TSE images. For R2* mapping, an exponential function was fit to the MGRE signal decay. Using R2’ (=R2*-R2) and local frequency, susceptibility source separation was conducted using two different algorithms: mathematical optimization (1) and deep learning (DL)-based method (χ-sepnet) (4,8). Additionally, to evaluate the feasibility of susceptibility source separation using R2* instead of R2’, the positive and negative susceptibility maps were estimated using R2*-based χ-separation (χ-separation*) and R2*-based χ-sepnet (χ-sepnet*)(4,5). Note that, for x-separation*, R2’ was estimated by scaling R2* by 52% (5).Image Evaluation
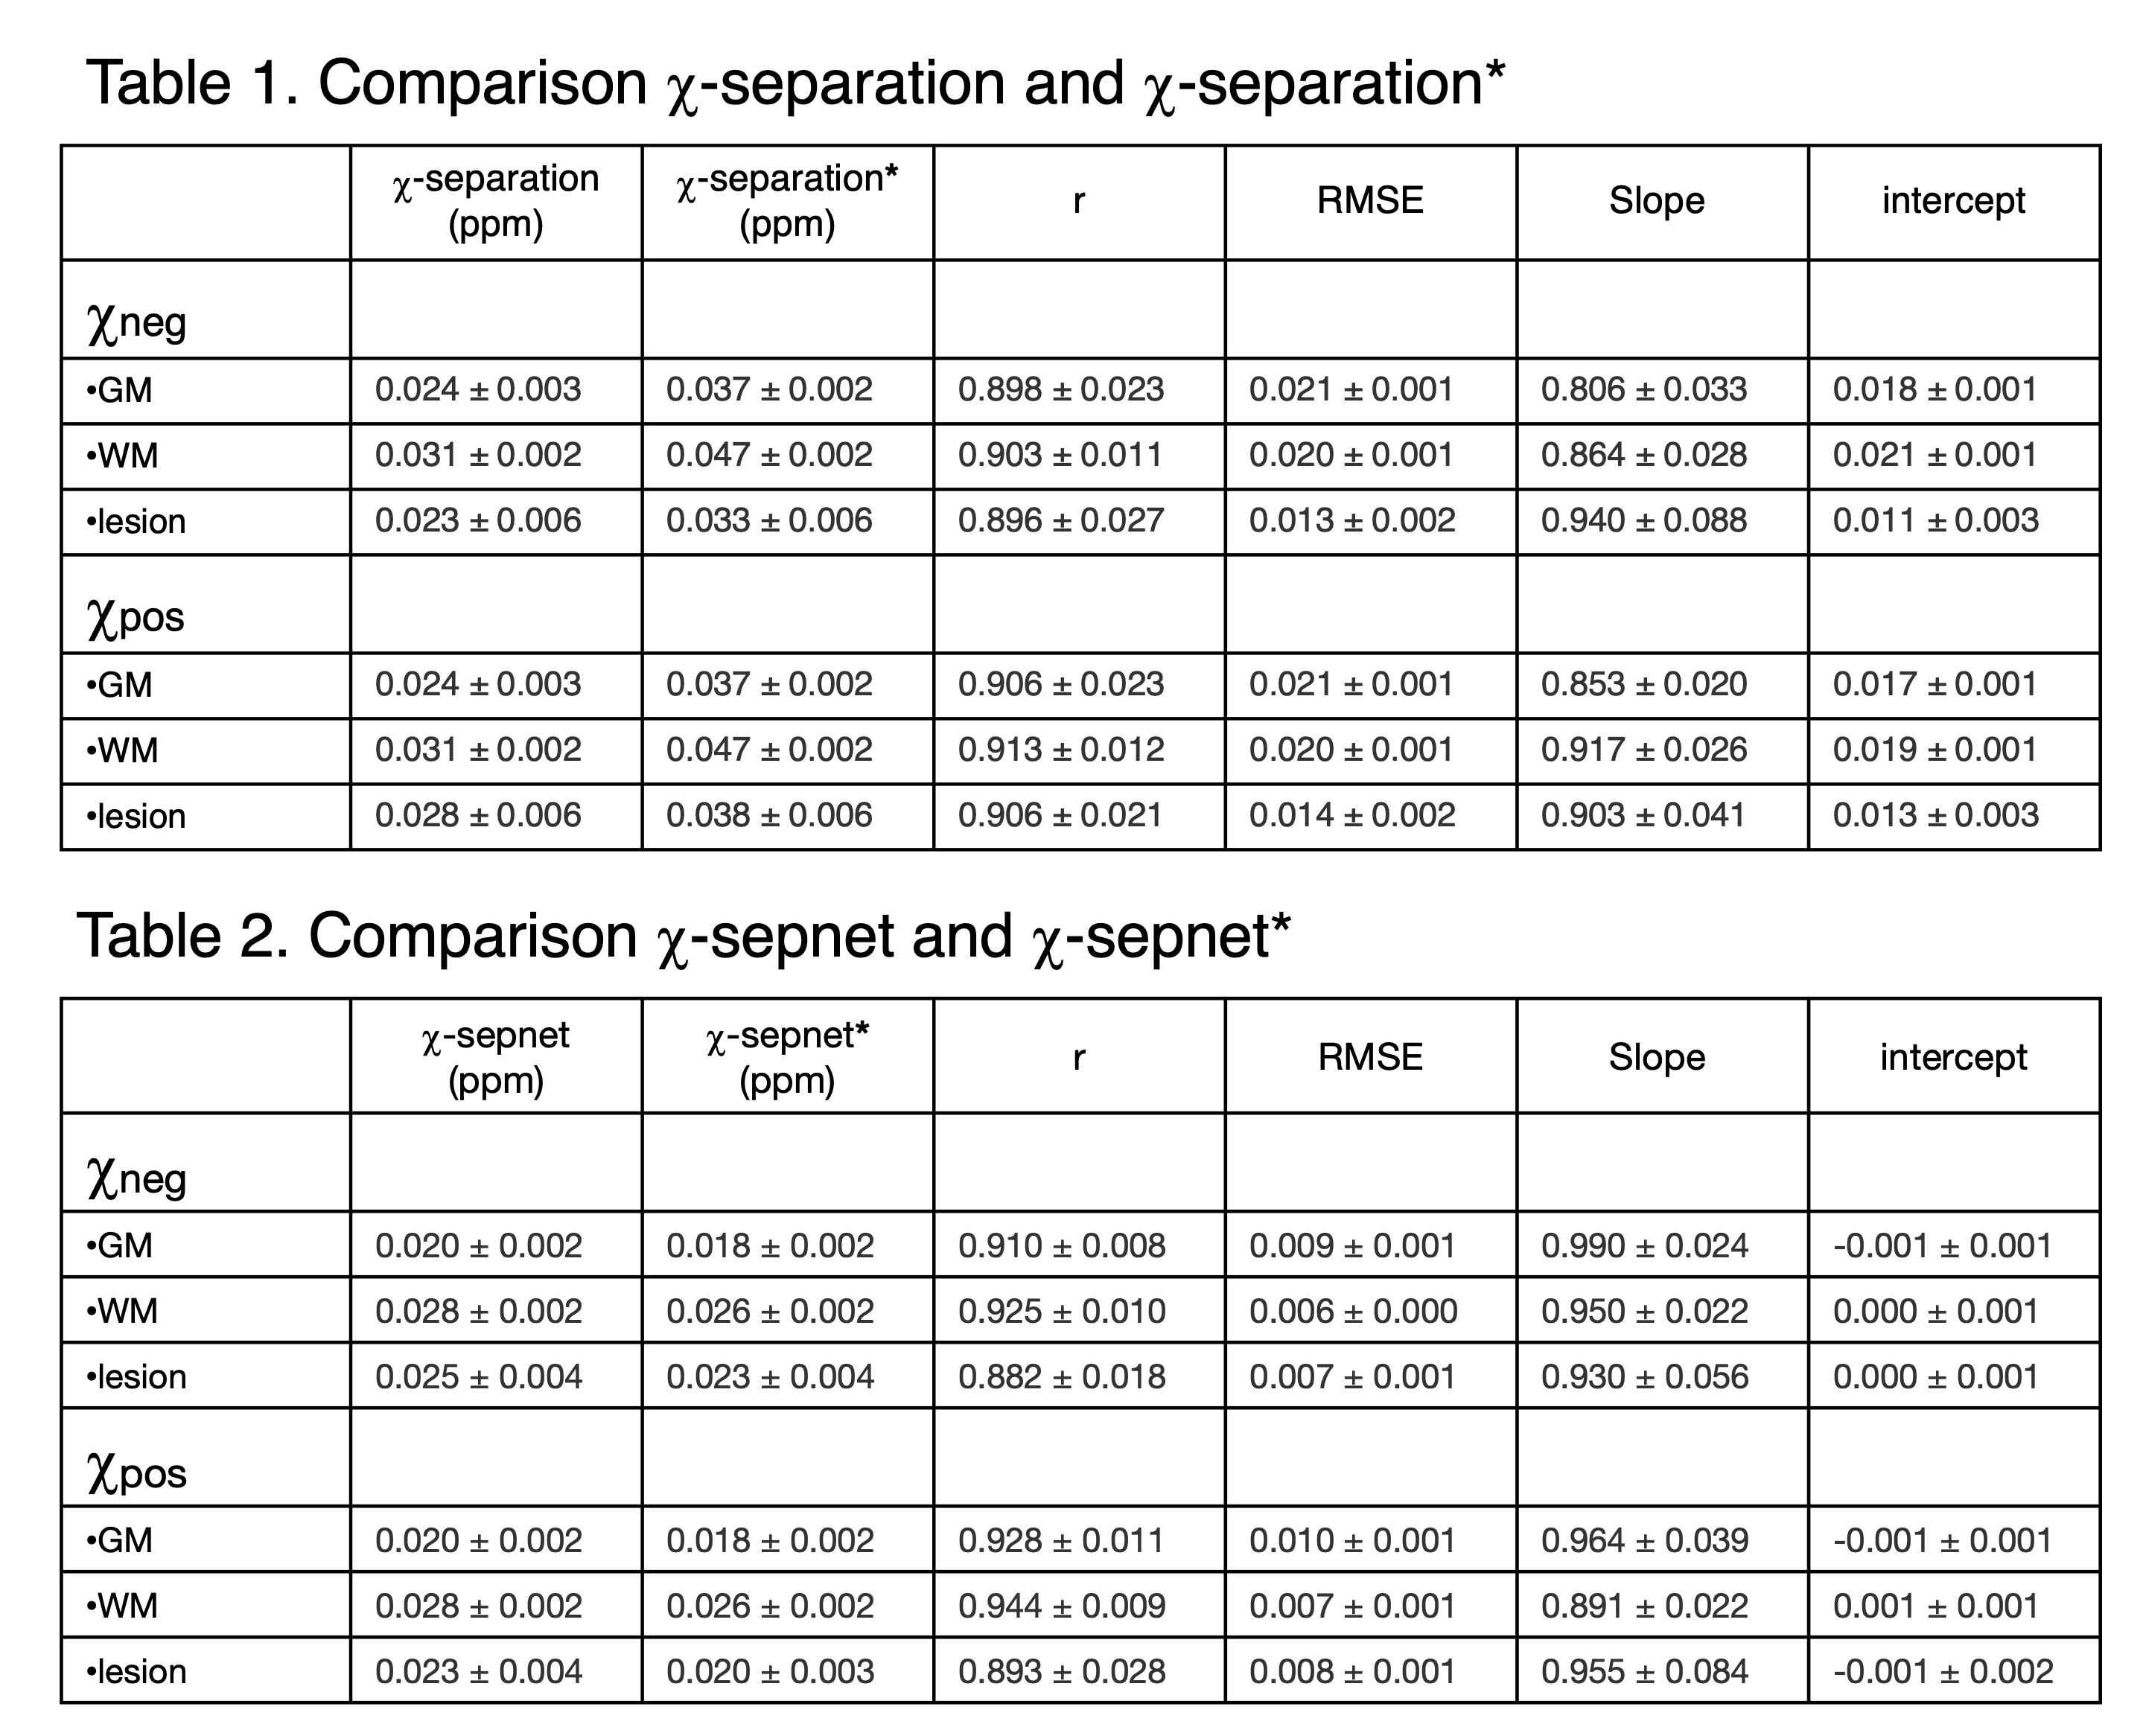
We performed pairwise comparisons between χ-separation and χ-separation*, and χ-sepnet and χ-sepnet*. After segmentation of gray and white matter using registered 3D T1-weighted images and FSL FAST, mean signal intensity of the gray and white matters on positive and negative magnetic susceptibility (χneg and χpos) maps was calculated. In addition, mean signal intensities of MS lesions from χpos and χneg maps, from semi-automatic brain lesion masks. Also RMSE, correlation coefficient, and the slope and intercept on linear regression line between χ-separation and χ-separation*, as well as between χ-sepnet and χ-sepnet*. Finally, visual comparison was performed by an experienced neuroradiologist, for contrast of the lesions on χ-separation maps.
Results
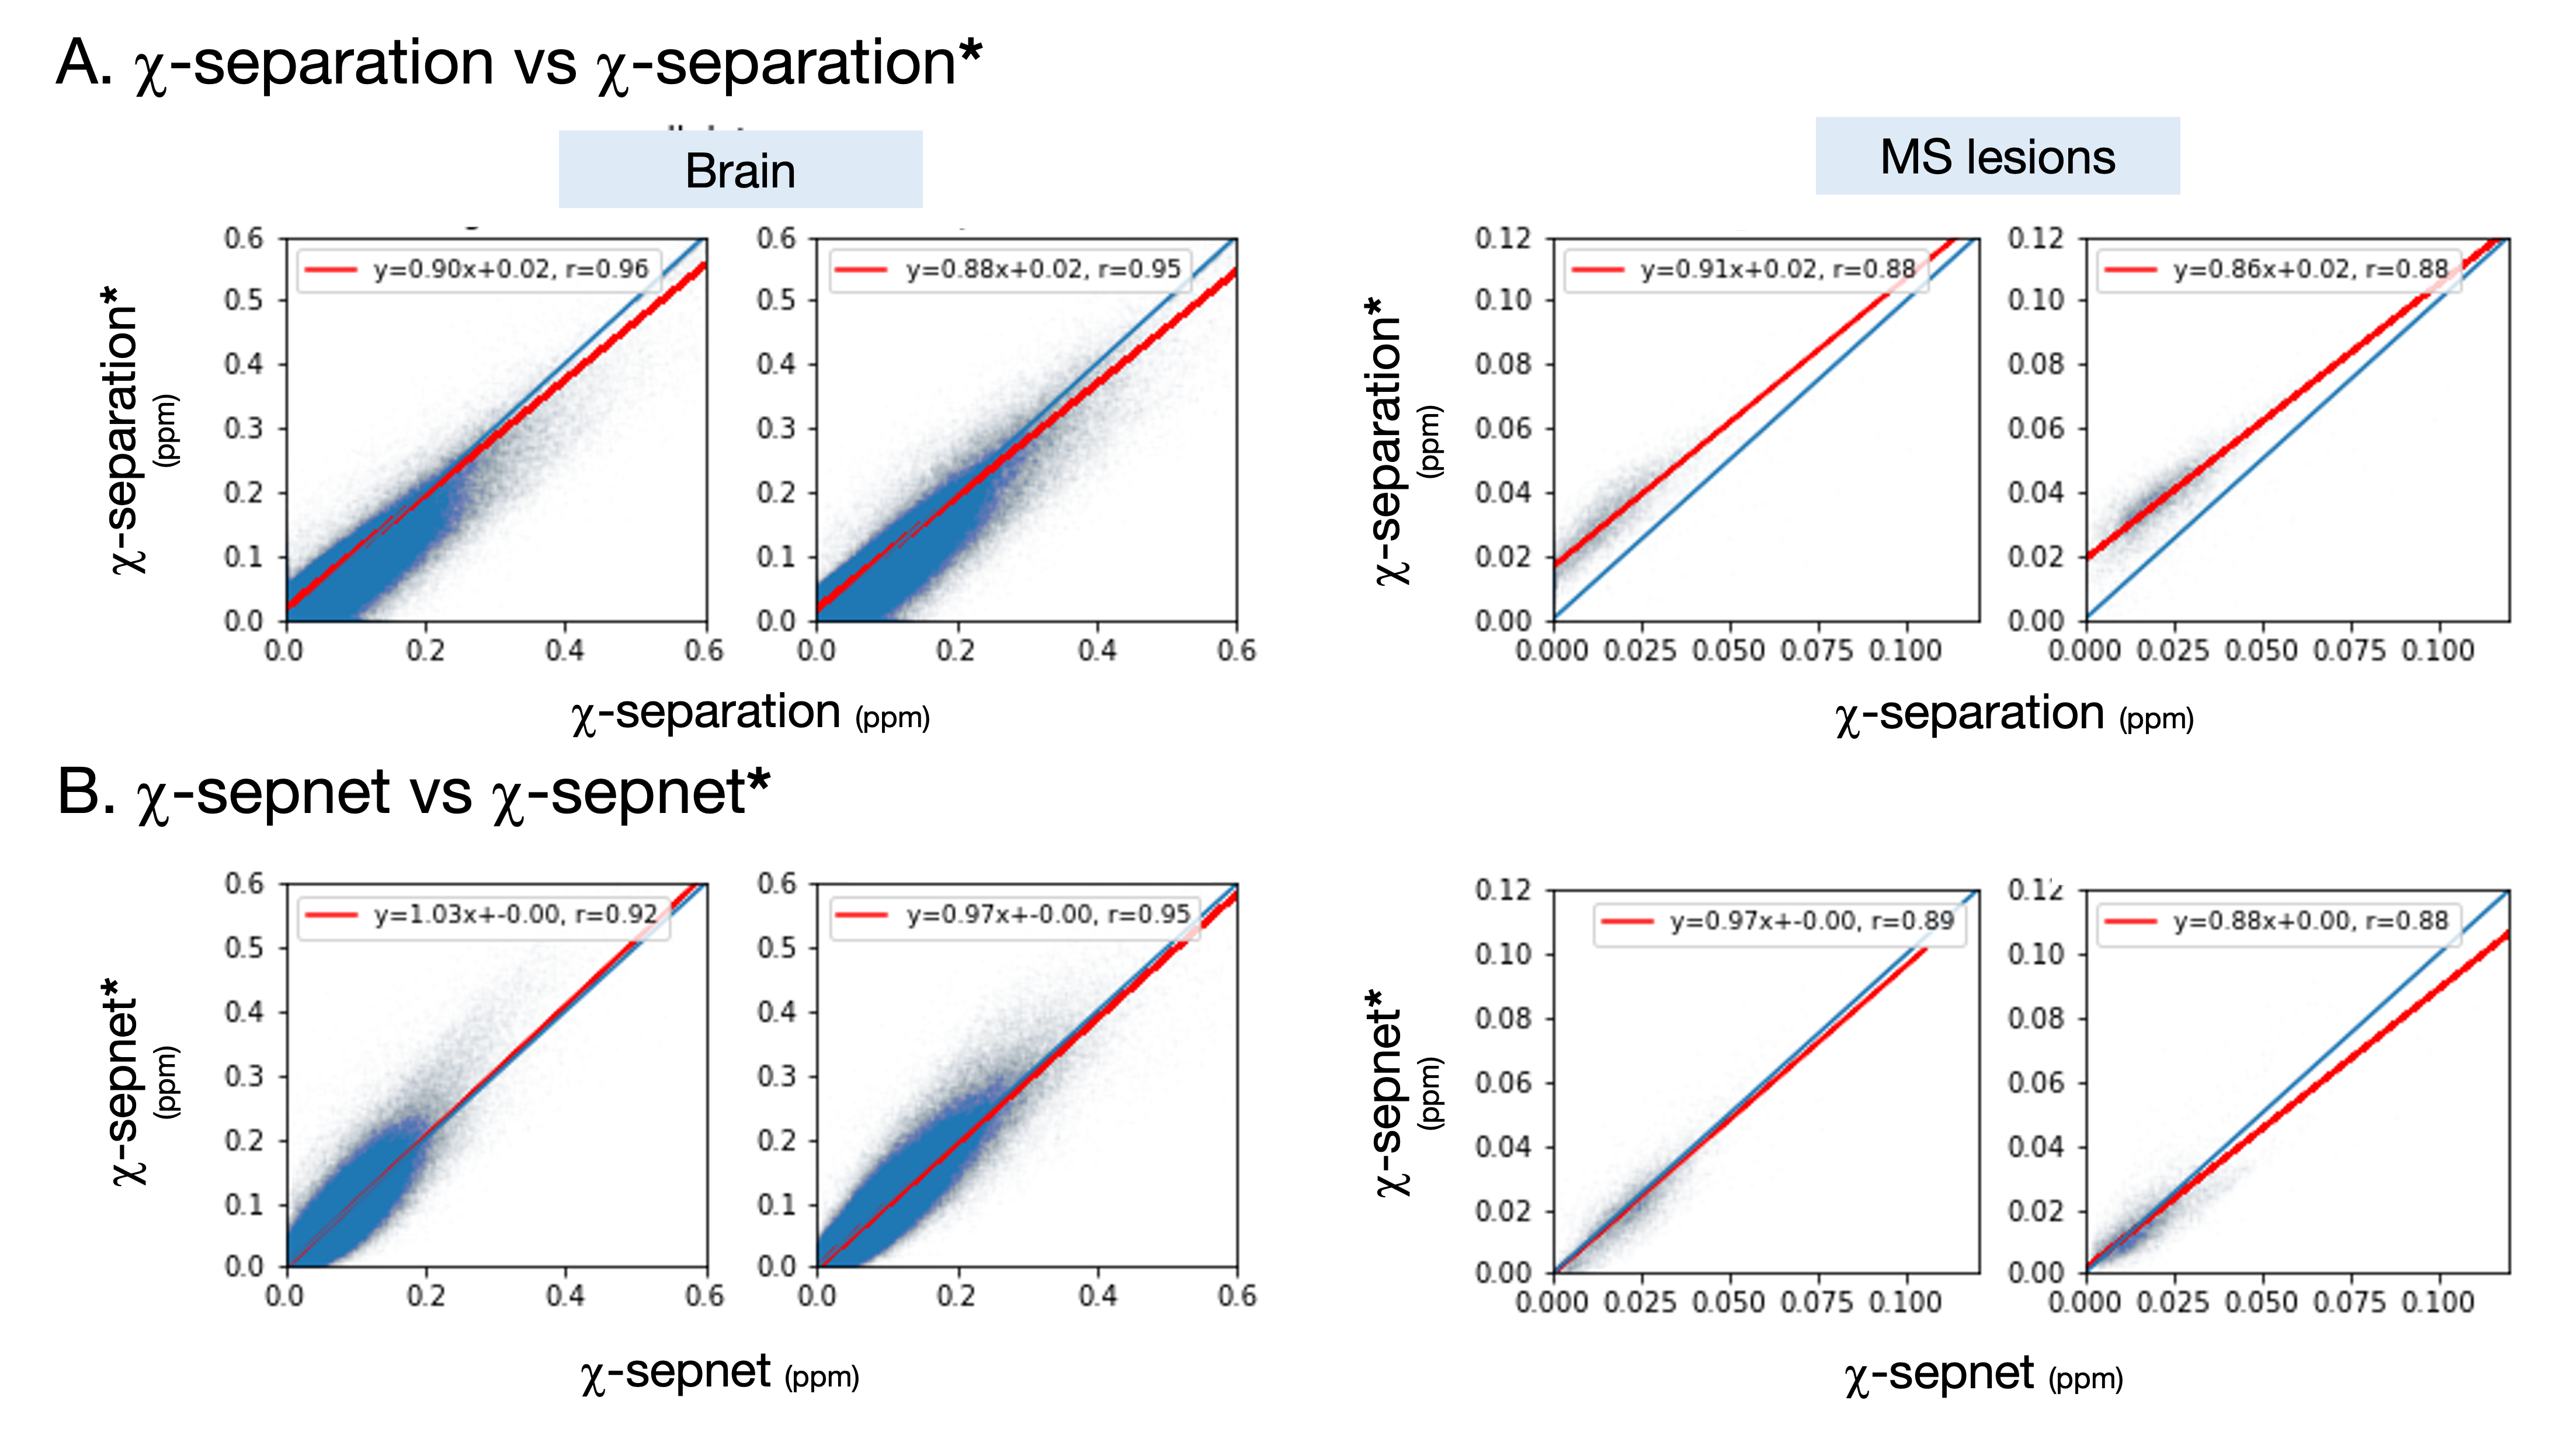
The voxel-wise correlation coefficients was excellent in both between χ-separation and χ-separation* (r=0.896~0.913) and between χ-sepnet and χ-sepnet* (r=0.882~0.944). The χ-separation* showed a tendency of over-estimation of susceptibility measures in the brain and the MS lesions as compared to χ-separation (Table 1 in Figure 1). On the contrary, the mean value of χ-sepnet* showed the tendency of subtle under-estimation of mean susceptibility as compared to χ-sepnet (Table 2 in Figure 1). There were more variations (high SD) of statistical measures (slope, r and RMSE) between χ-separation and χ-separation* as compared to those between χ-sepnet and χ-sepnet*.The biases were relatively smaller in DL-based method (RMSE between χ-sepnet and χ-sepnet* 0.006-0.010) as compared to mathematical approach (RMSE between χ-separation and χ-separation* 0.013 ~0.021). Interestingly, the RMSE of MS lesions between χ-separation and χ-separation* is smaller than the RMSE of gray and white matter. Additionally there is small offset at the MS lesions on χ-separation* (Figure 2).
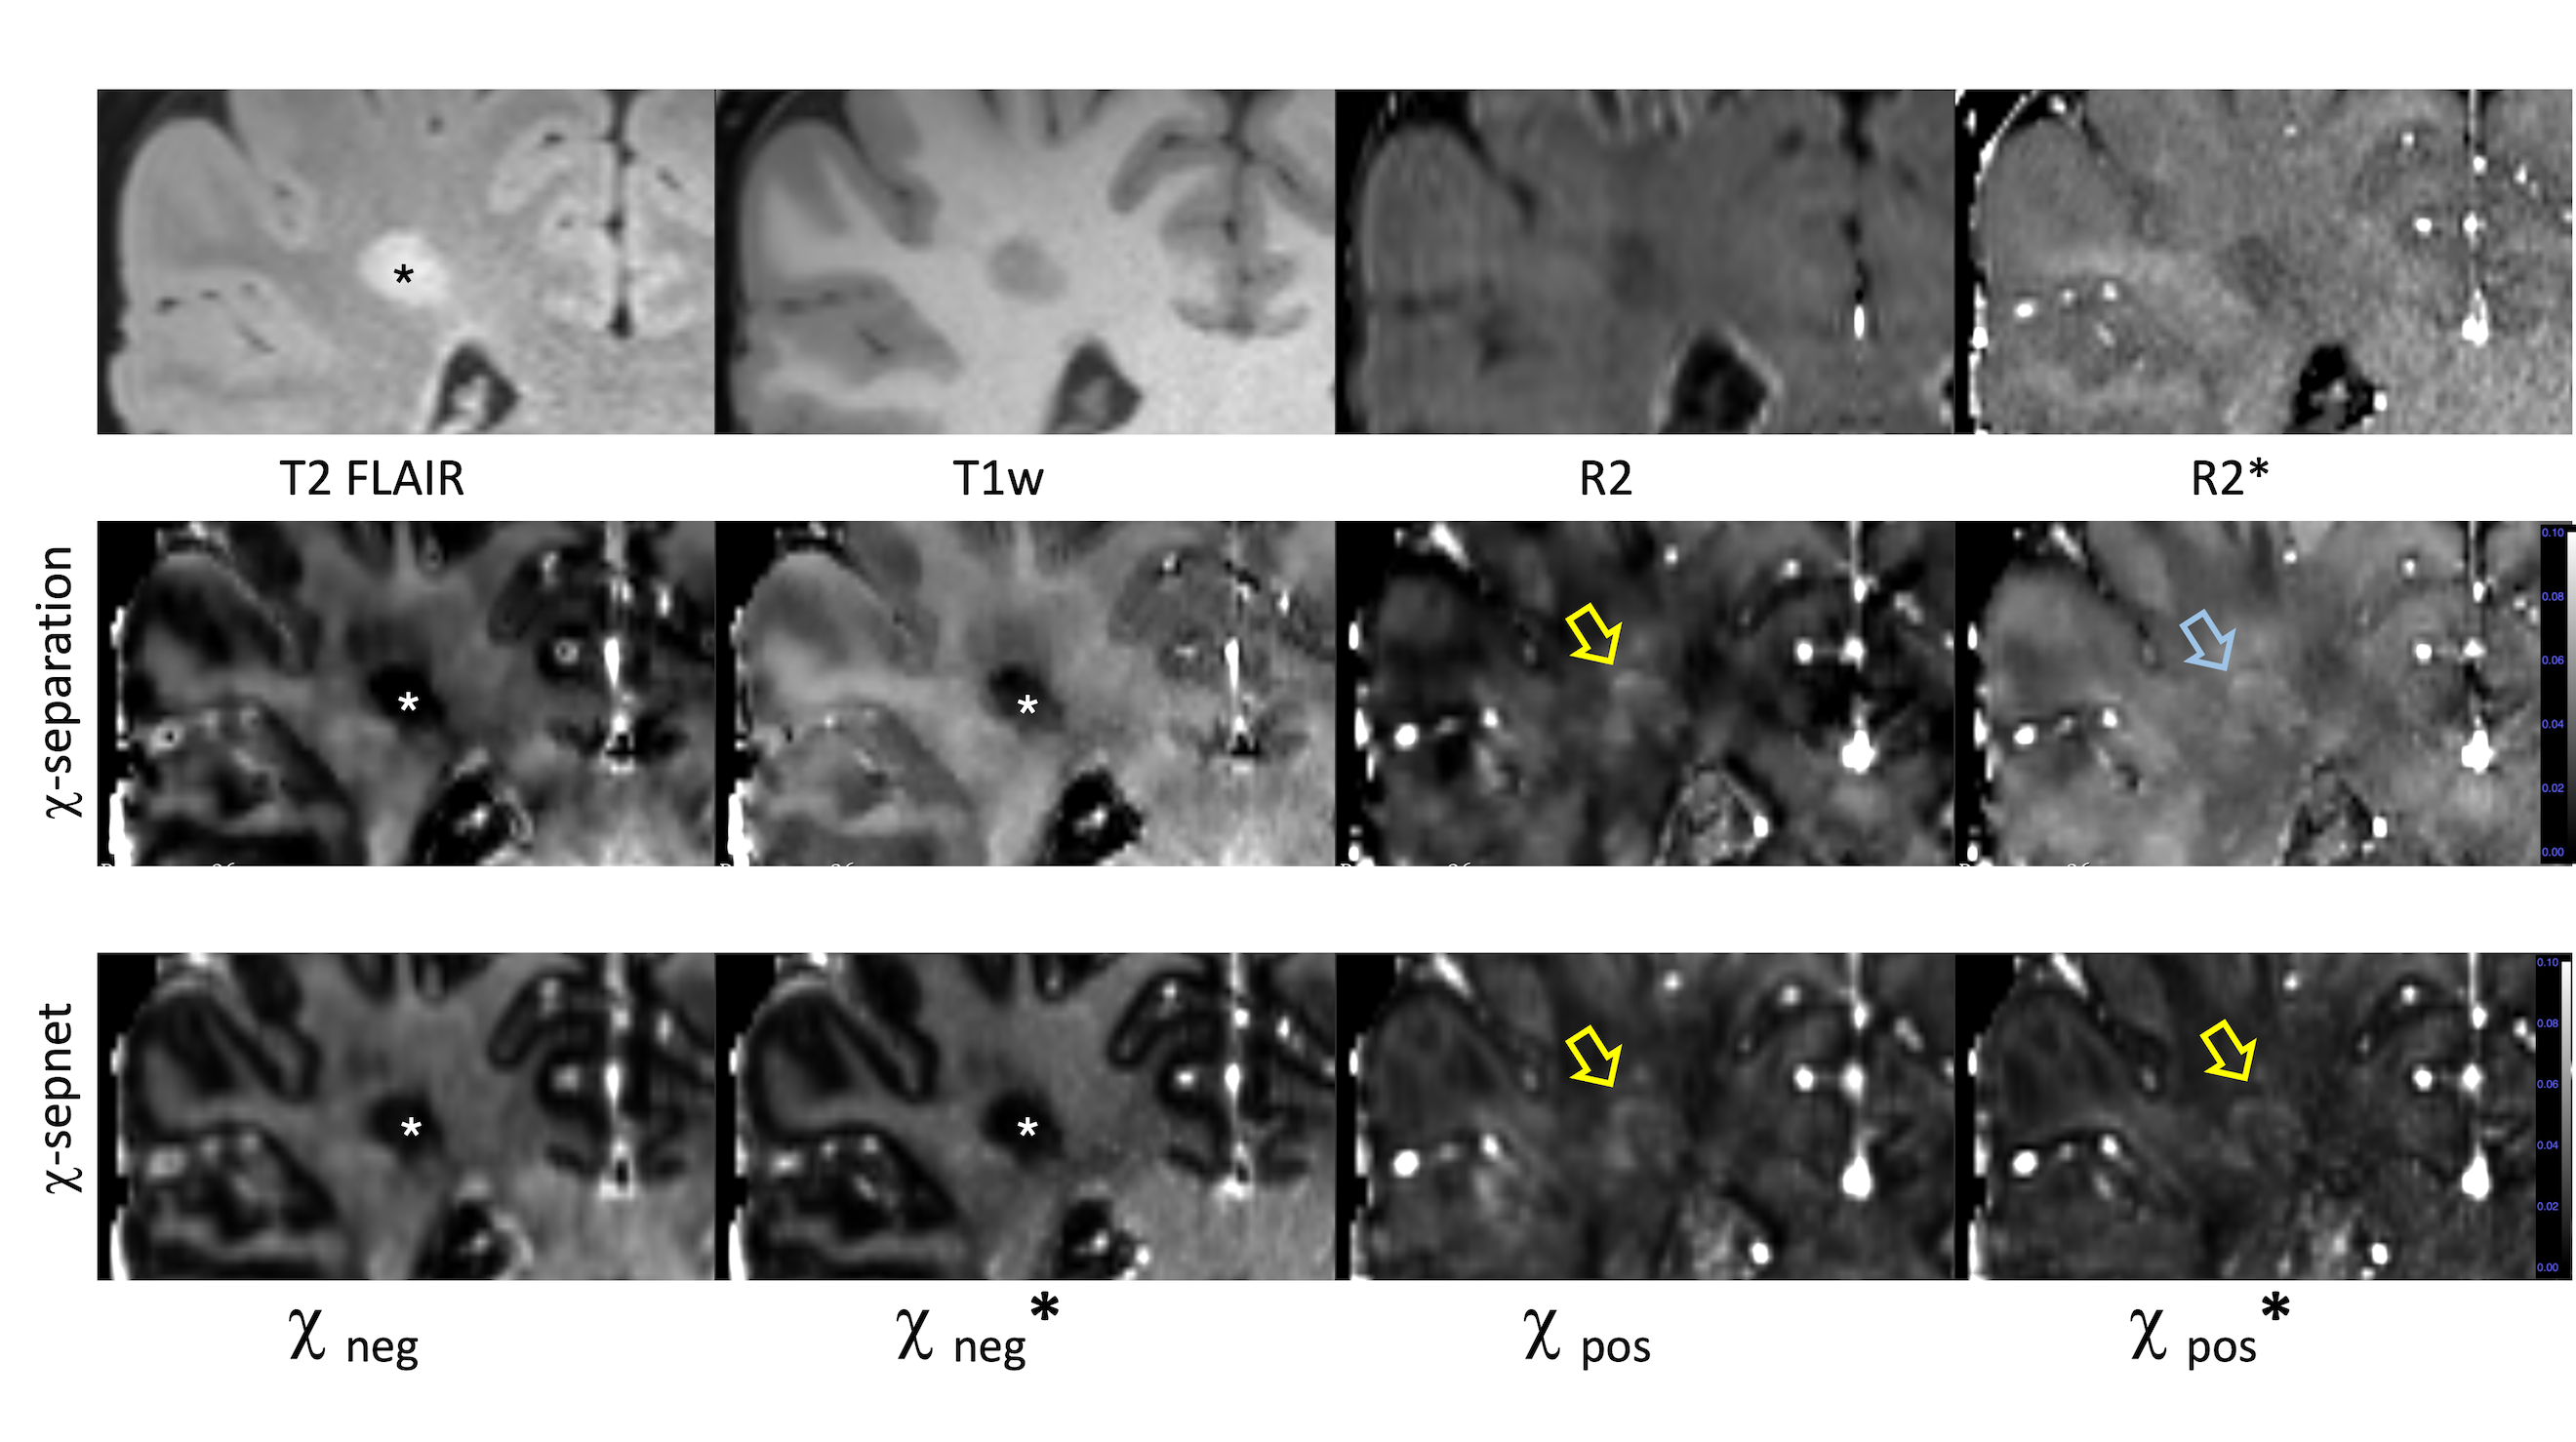
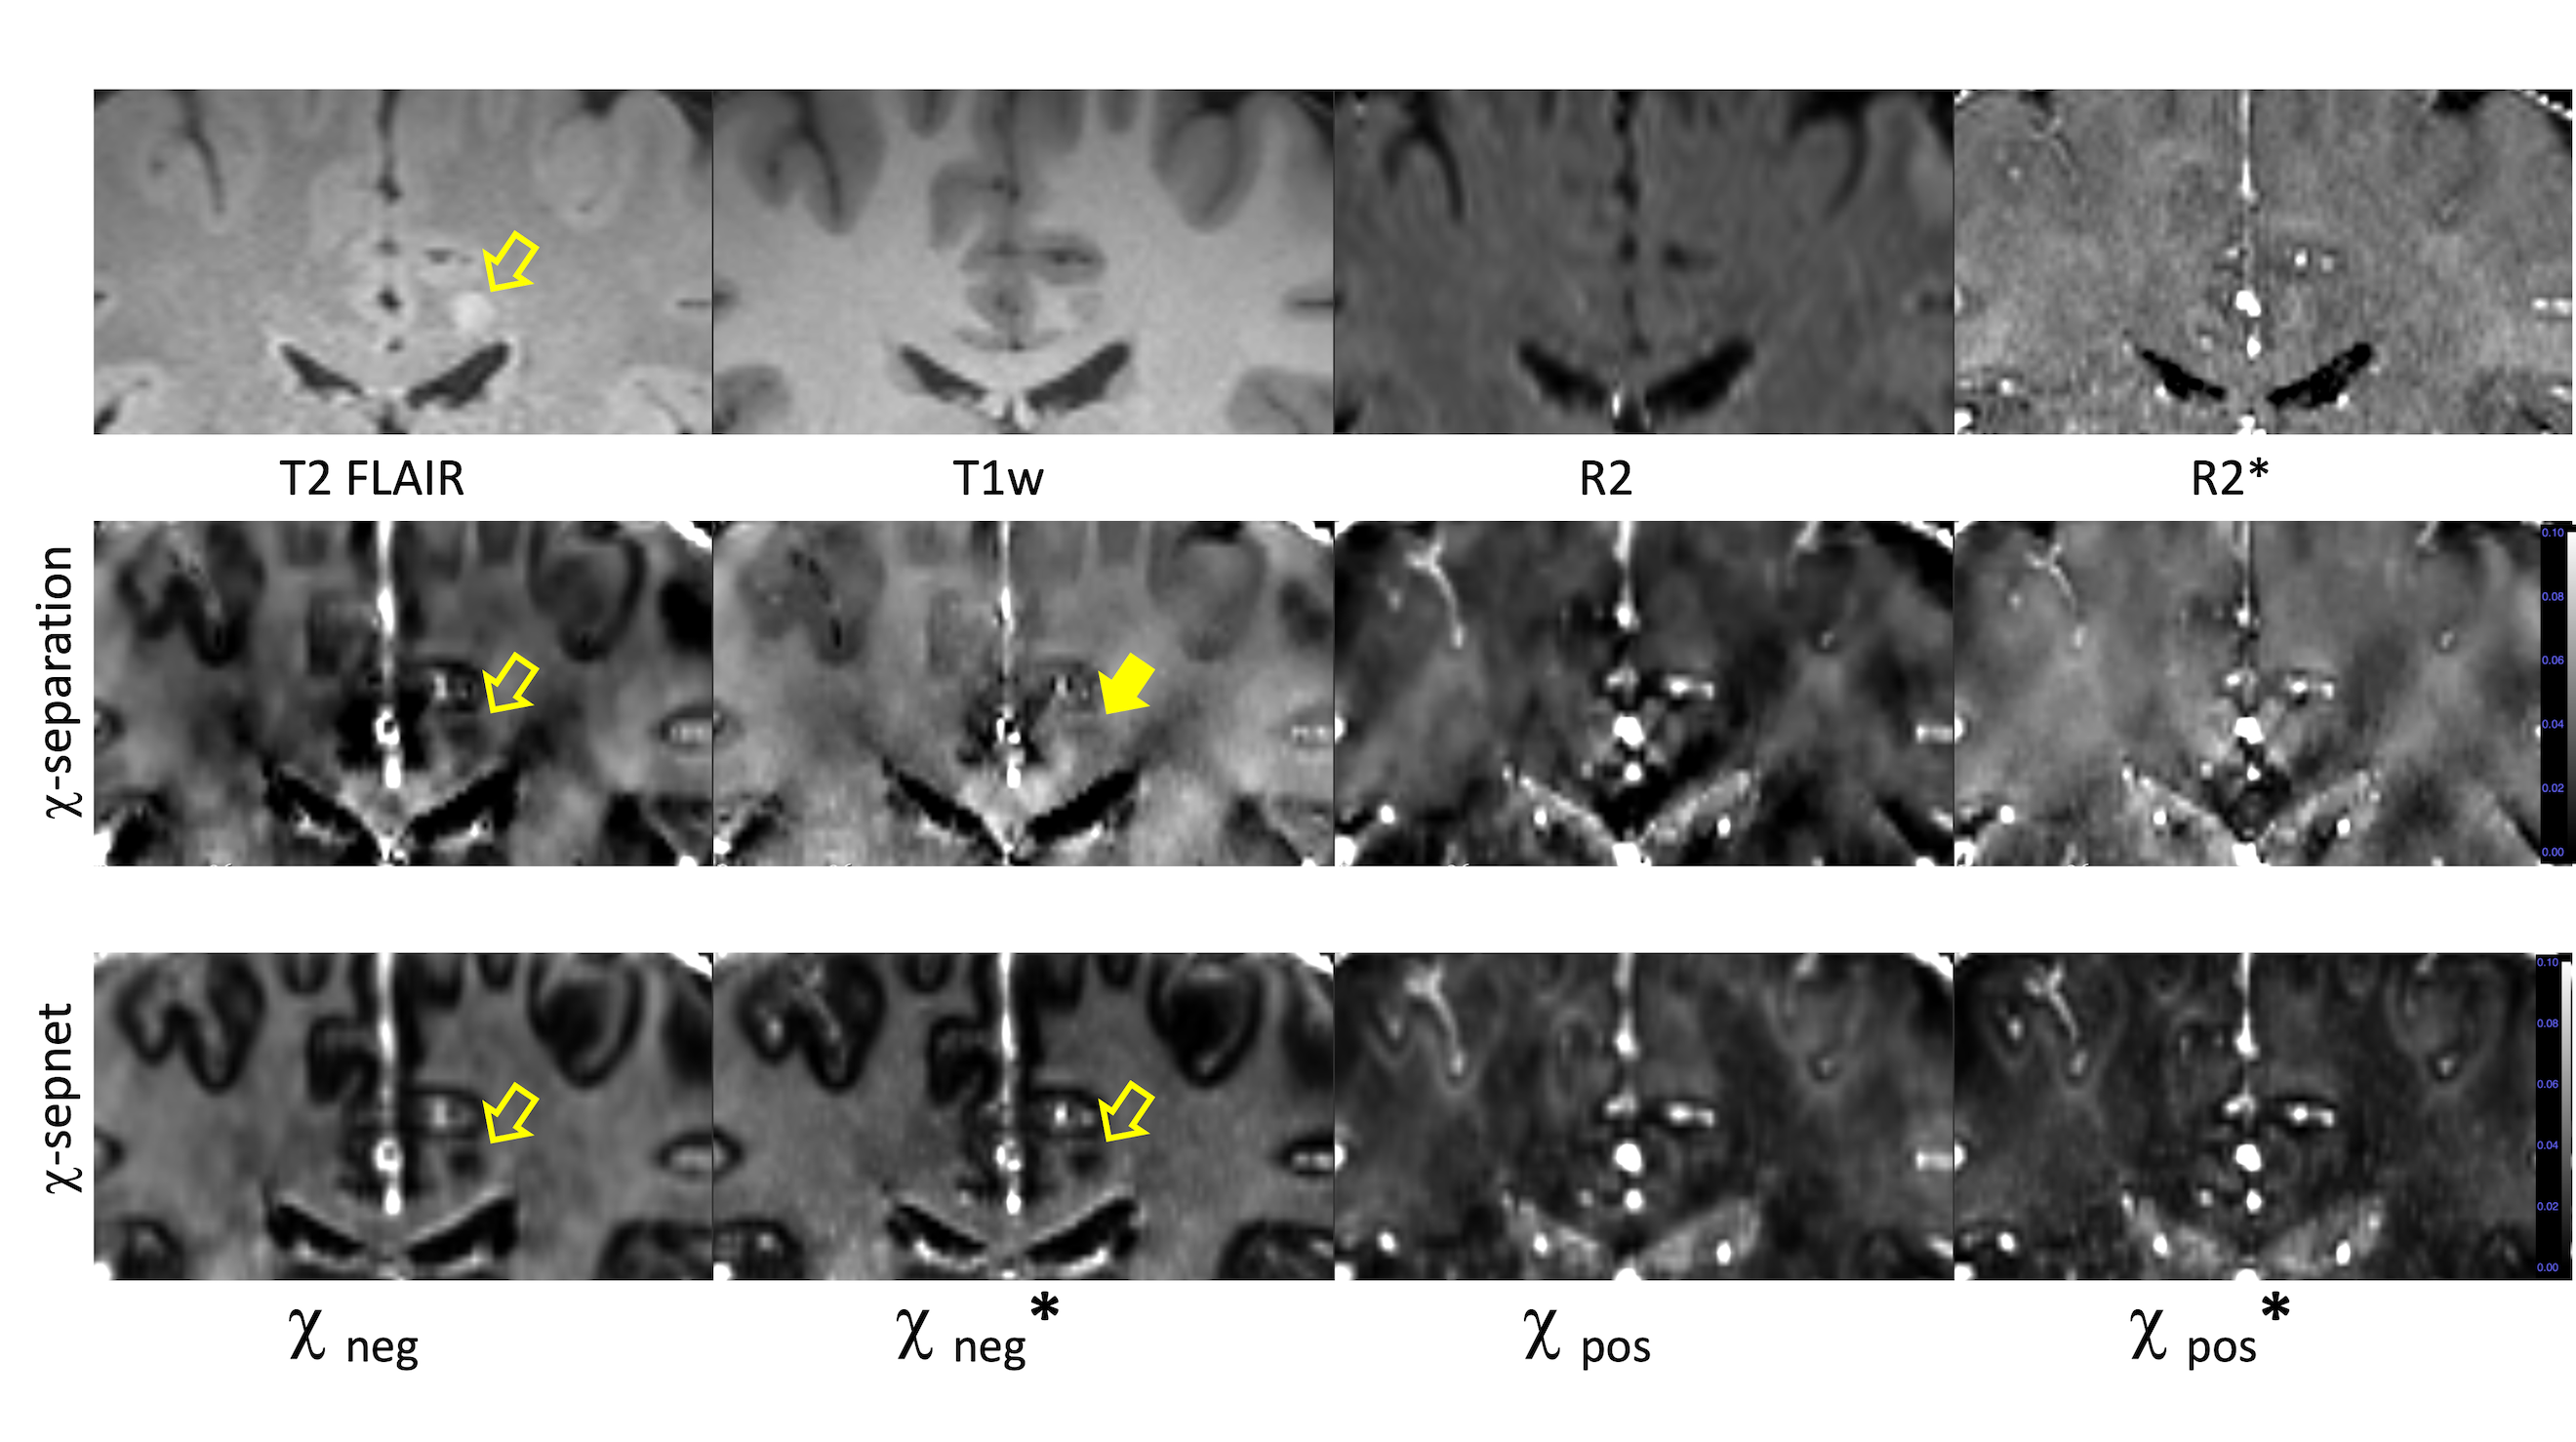
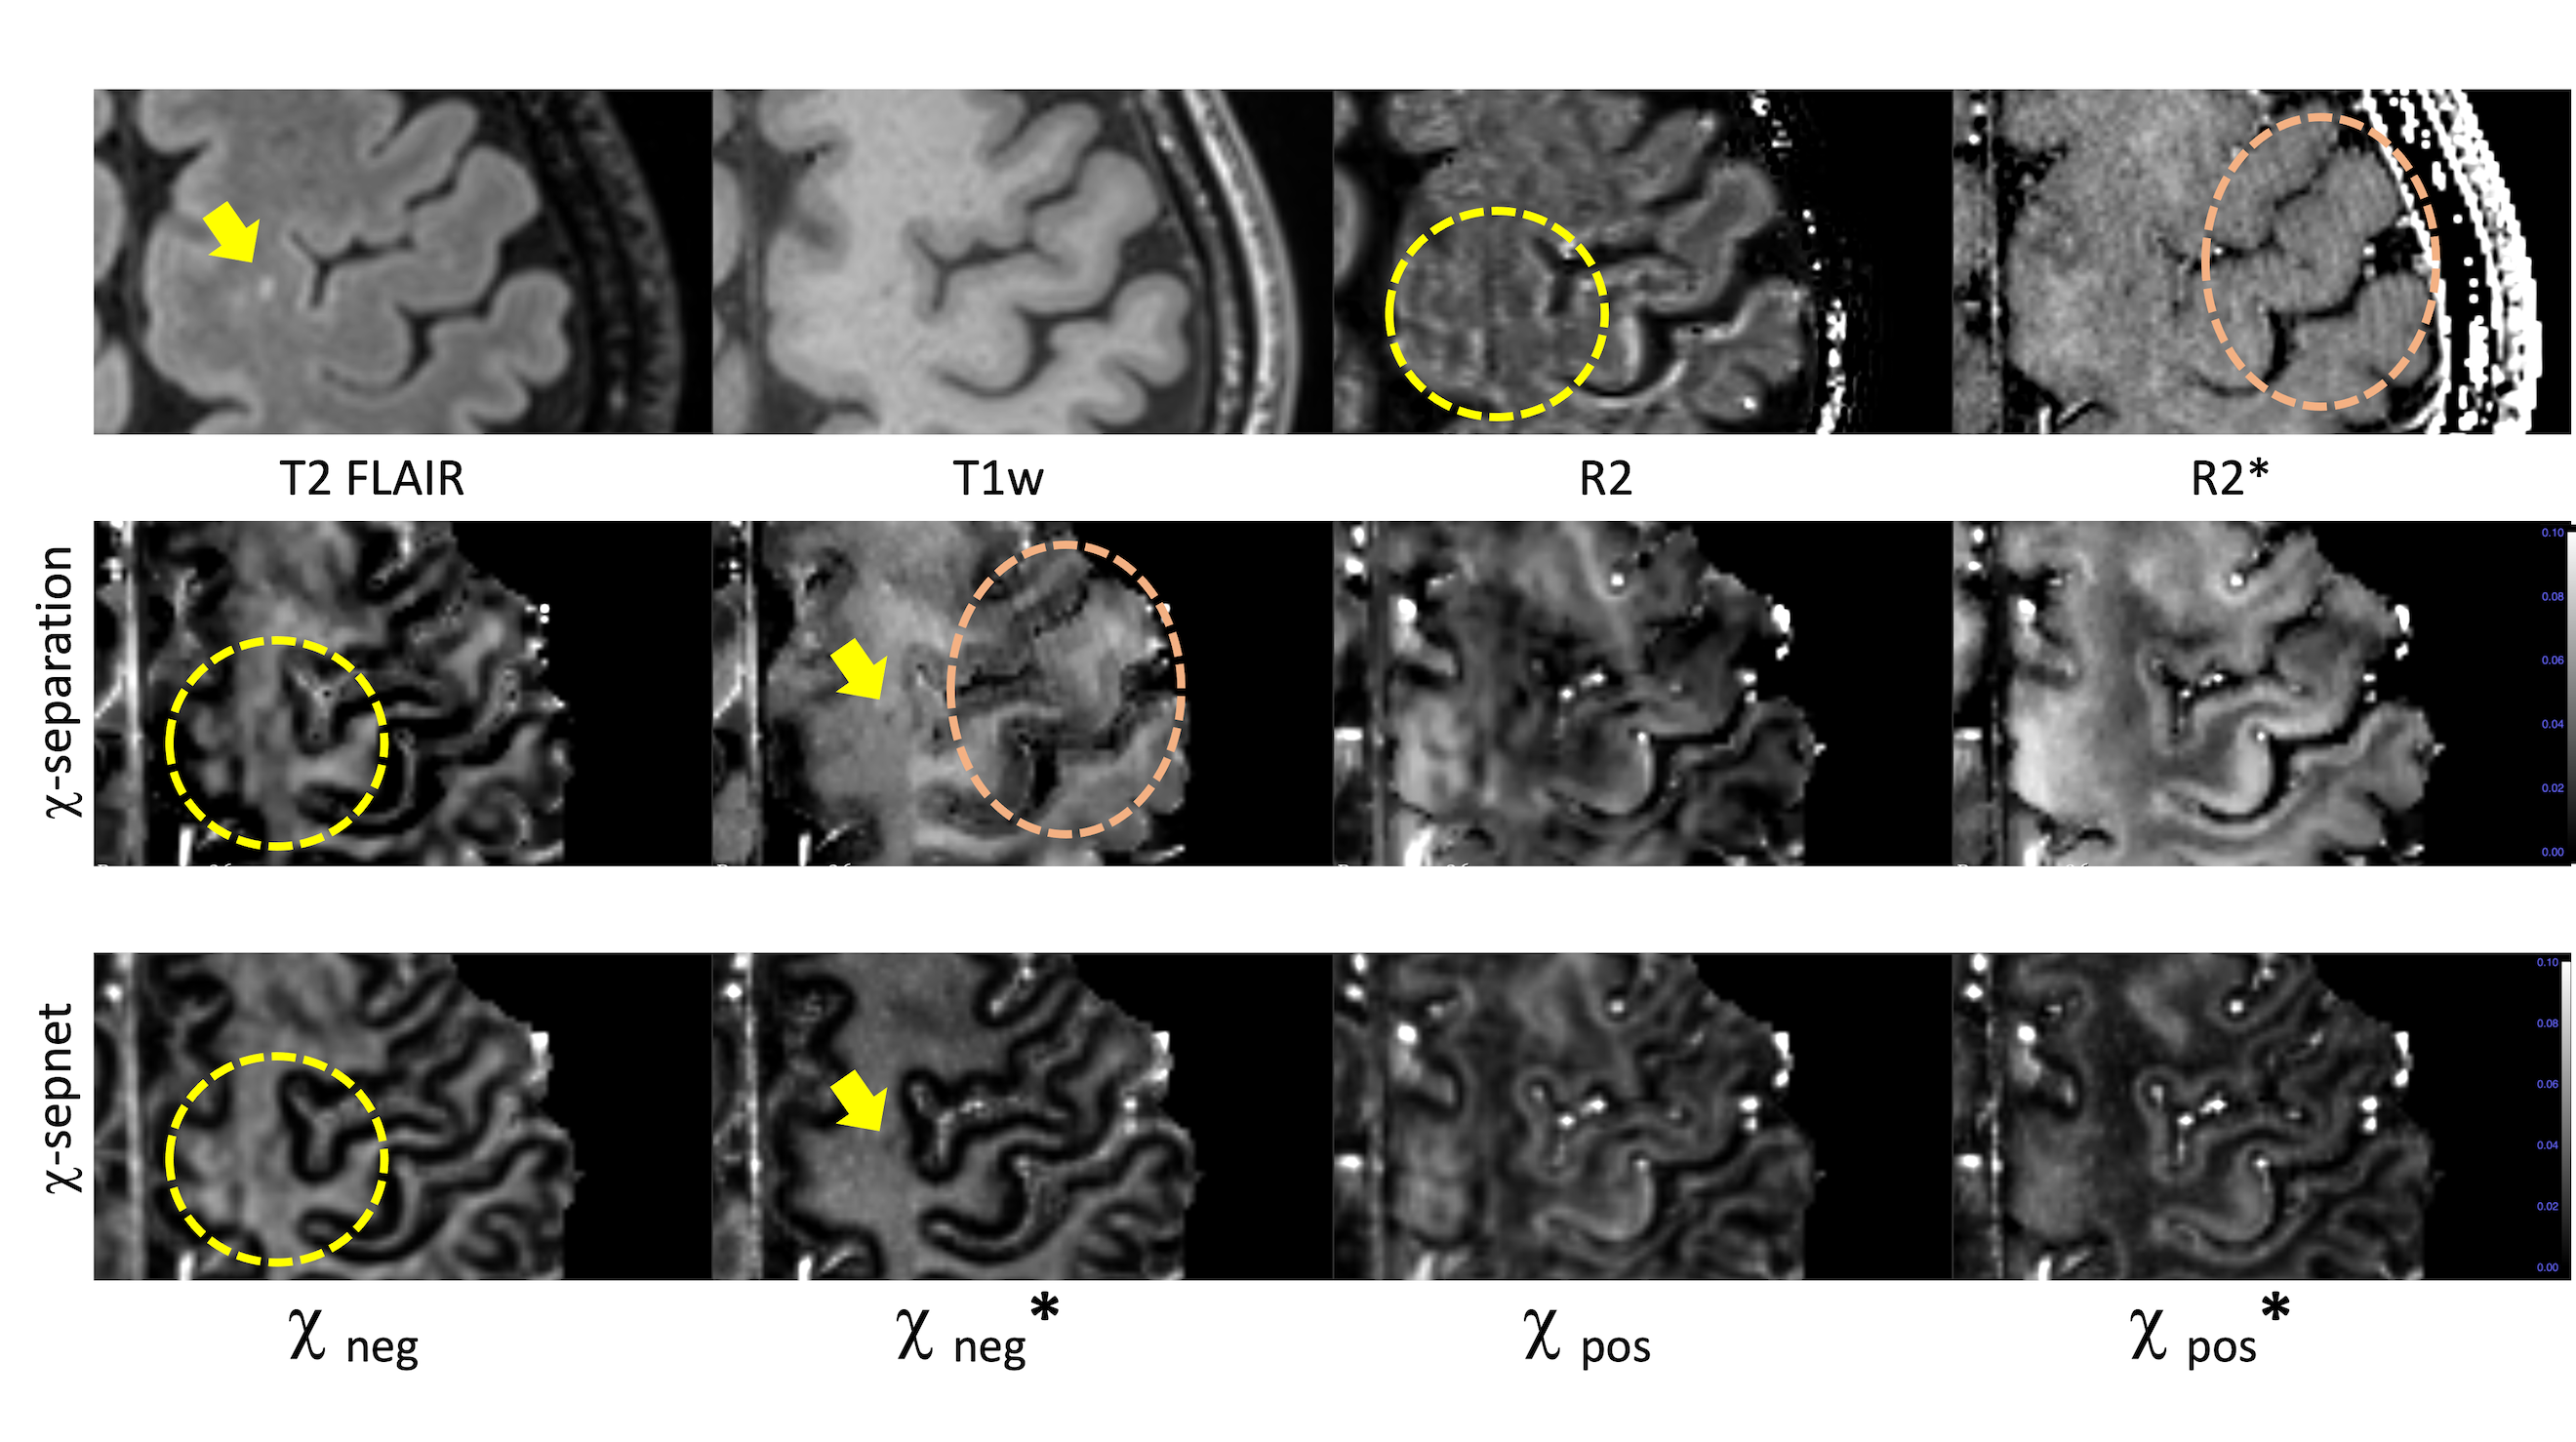
In visual assessment, R2*-based source separation images exhibit similar contrasts with R2’-based separation images (Figure 3-4). The χ-separation* contrasts between gray and white matter are somewhat different to those of χ-separation but the general trends were concordant. The MS lesions on DL-based reconstruction showed better visual agreement than between mathematical approaches. The DL-based algorithm alleviates the gap between R2*- vs. R2’-based separation maps (see χ-sepnet vs. χ-sepnet* comparison in Figure 3-4).
Discussion and conclusion
Two R2*-based susceptibility source separation methods, χ-separation* and χ-sepnet*, showed good agreement to the originally proposed method using R2’; they do not require expansive R2 mapping, and might be free from potential errors of the extended acquisition and registration (Figure 5).Besides the good correlation, we found non trivial offsets and biases in χ-separation* and χ-sepnet*. These were different according to the methods, and the presence of pathologic changes, which is an important caveat when applying R2*-based source separation. Meanwhile, as compared to x-separation*, χ-sepnet* showed robust performances, with less effect from tissue types and subject-wise variations.
In conclusion, χ-separation using R2* could be a good clinical alternative for original χ-separation. In addition, χ-separation* and χ-sepnet* can be rescue protocols for standard χ-separation and χ-sepnet results, especially when R2 mapping quality is unacceptable. However, there are some offset and biases, which should be acknowledged before their clinical applications. DL-based approach could be a solution for these errors.
Acknowledgements
Supported by the National Research Foundation of Korea funded by the Ministry of Science and ICT (NRF-2020R1C1C1012320).References
1. Shin et al. χ-separation: Magnetic susceptibility source separation toward iron and myelin mapping in the brain. Neuroimage 2021 240:118371
2. Jang et al, χ-Separation Imaging for Diagnosis of Multiple Sclerosis versus Neuromyelitis Optica Spectrum Disorder. Radiology, In Press
3. Shin et al, Imaging multiple sclerosis histopathology using susceptibility source separation: a postmortem brain study. ISMRM 2022, 137
4. Kim et al, Chi-sepnet: Susceptibility source separation using deep neural network. ISMRM 2022, 2464
5. Dimov AV, Nguyen TD, Gillen KM, et al. Susceptibility source separation from gradient echo data using magnitude decay modeling. Journal of Neuroimaging 2022;32(5):852-859.
6. Dymerska et al. Phase unwrapping with a rapid opensource minimum spanning tree algorithm (ROMEO). MRM 2021;85(4):2294-2308.
7. Wu B et al. Whole brain susceptibility mapping using compressed sensing. MRM 2012;67(1):137-147.
8. M Lebel, StimFit: A Toolbox for Robust T2 Mapping with Stimulated Echo Compensation ISMRM 2012, 2558
9. Shin et al, chi-separation using multi-orientation data in invivo and exvivo brains: Visualization of histology up to the resolution of 350 μm, ISMRM, 2022, 8228
Figures