2825
Tissue damage and impaired processing speed are related to brain parenchyma free water fraction in multiple sclerosis1Department of Neurosciences, Imaging and Clinical Sciences, 'G. d'Annunzio University' of Chieti-Pescara, Chieti, Italy, 2Institute for Advanced Biomedical Technologies (ITAB), 'G. d'Annunzio University' of Chieti-Pescara, Chieti, Italy, 3Department of Neurophysics, Max Planck Institute for Human Cognitive and Brain Sciences, Leipzig, Germany, 4MS Centre, Department of Clinical Neurology, ‘SS. Annunziata’ University Hospital, Chieti, Italy, 5Cardiff University Brain Research Imaging Centre (CUBRIC), School of Psychology, Cardiff University, Cardiff, United Kingdom
Synopsis
Keywords: Multiple Sclerosis, White Matter, normal appearing white matter, neurodegeneration, cognitive impairment
In 99 relapsing-remitting multiple sclerosis (MS) patients and 25 healthy controls we quantified cerebral free water fraction (FWF) and investigated its relationship with lesion burden and information processing speed, measured with Symbol Digit Modalities Test (SDMT). FWF was obtained from the mcDESPOT method, fitting a three-compartment relaxation model to spoiled-gradient-echo and balanced-SSFP signals with varying flip angles. MS patients showed higher FWF than controls, in the lesioned tissue and in normal appearing white matter (NAWM). In NAWM and perilesional tissue, FWF correlated with lesion load. FWF spatial heterogeneity increased with worsening SDMT performance in regions involved in MS-related cognitive impairment.
Introduction
Multiple sclerosis (MS) is an inflammatory autoimmune disorder, where processes including demyelination, axonal loss, gliosis, microglial activation, and blood brain barrier (BBB) disruption concur to alter brain parenchyma1, where normal nervous tissue is gradually degraded and replaced by water2. Cognitive deterioration follows, with the information processing speed as one of the most consistently affected cognitive domains3. By means of the mcDESPOT technique (multi-component driven equilibrium single pulse observation of T1/T2)4, we sought to quantify the amount of bulk free water in the brain tissue of MS patients versus healthy controls, and to investigate its relationship with MS lesion burden and information processing speed.Methods
Data were included from 99 relapsing-remitting right-handed MS patients (RRMS, 68/31 F/M, age=43.3±9.9y, disease duration=12.3±7.7y, Expanded Disability Status Scale (EDSS)=2.6±1.5, range 0-6.5), and 25 healthy controls (HC, 13/12 F/M, age=38.8±11.0y), matched for age and sex, taken from a study previously published by some of the co-authors5. Information processing speed performance was evaluated by means of a written Symbol Digit Modalities Test (SDMT)3, administered to both patients and healthy subjects.An MRI protocol including T2/proton-density-weighted imaging, fluid-attenuated inversion recovery for identification and segmentation of T2-hyperintense lesions (T2L), and a 1 mm-isotropic resolution T1-weighted (T1w) sequence for identification of T1-hypointense lesions (T1L) was carried out at 3T on a GE system (GE Medical Systems, Milwaukee, WI). A mcDESPOT sequence with 1.7 mm-isotropic resolution was acquired. mcDESPOT combines DESPOT1 and DESPOT2 methods6,7, which derive quantitative maps of T1 and T2 by fitting, respectively, spoiled-gradient echo (SPGR) and balanced steady-state free precession (bSSFP) signal intensities to varying flip angles (Figure 1). A three-pool model including fast, slow, and very slow relaxing water compartments (attributed to myelin, intra-extra axonal and bulk, non-exchanging water, respectively) is used to describe water relaxation, yielding parametric maps of free water fraction (FWF)4.
The FWF maps were non-linearly coregistered to the T1w-image using FSL (FMRIB Software Library8 v6.0.4). The T1w-image was automatically segmented, combining FAST and FIRST routines, to return masks of cortical and subcortical gray matter (GM), as well as white matter (WM). T2L and T1L-masks were calculated semi-automatically as described in Lipp et al.5. Normal appearing white matter (NAWM) was defined by subtracting from the WM-mask the T2L-mask dilated by 5 mm. A native WM atlas was obtained from the standard ICBM-DTI-81 WM labels atlas9, inverting the non-linear transformation used to map the native fractional anisotropy (FA) map to the standard ICBM-FA map. Mean and variance of log-normally transformed FWF were calculated in GM, NAWM, perilesional tissue, T1L and T2L, as well as in selected NAWM regions (median FWF), using in-house software written in MATLAB (v. R2020b, Mathworks). Pearson’s r or Spearman’s ρ (in case of non-normality) were evaluated, and non-parametric tests were run when appropriate in MATLAB and R (v. 4.2.1). False discovery rate correction was considered for multiple comparisons.
Results
FWF was higher in GM and NAWM of MS patients, compared to HC (p<0.001, Figure 2). In patients, the content of free, non-exchanging water of T1L was the highest, followed by T2L and NAWM, while the perilesional tissue had the lowest FWF.As shown in Figure 3, FWF of GM, NAWM and perilesional tissue was related to lesion load: FWF significantly increased with T1L and T2L volume, with ρ=0.40 and 0.58 respectively, p<0.001. FWF of T2L was strongly related to both T1L volume and the volume ratio T1L/T2L (ρ=0.73, p<0.001).
The median EDSS of MS patients was 2 (range 0-6.5). MS patients performed worse in the SDMT than HC (mean score ± SD, MS: 54±10; HC: 64±10, p<0.001). In GM, NAWM, perilesional tissue and T2L, FWF decreased with SDMT score (ρ=-0.30, -0.29, -0.33 respectively and r=-0.30 for T2L, all with p<0.005, Figure 4). Spatial FWF heterogeneity in NAWM (FWF variance) decreased with SDMT score in 16 ROIs in MS patients, including the genu and body of corpus callosum, cortico-spinal tract, sagittal stratum, superior longitudinal fasciculus (see Figure 5). No correlation was found between median FWF or FWF variance and SDMT in control subjects.
Discussion
RRMS patients showed a higher content of free water compared to controls, not limited to the lesioned tissue, but involving also the NAWM. In fact, this increased FWF can be either the result of an expansion of the extracellular space or be linked to an increased water influx from the damaged BBB2 (or both), alterations occurring at the expense of the nervous tissue. The fact that FWF of T2L was strongly related to both T1L volume and the volume ratio T1L/T2L may indicate that it depends on the proportion of T2L that are also T1-hypointense (which are characterized by a certain degree of tissue destruction). Interestingly, FWF spatial heterogeneity increased with worsening SDMT performance (lower SDMT score) in the corpus callosum and the superior longitudinal fasciculus, regions involved in MS-related cognitive impairment10.Conclusion
Alterations of brain structure in MS are associated with replacement of tissue by free water. This process involves the NAWM and GM, impinging on brain function and negatively affecting cognitive processing speed. Water content in brain parenchyma and its spatial variation, especially in NAWM, may be a potential marker of tissue damage and associated cognitive impairment in multiple sclerosis.Acknowledgements
The study was funded by the MS Society UK.
References
1. Saade C, Bou-Fakhredin R, Yousem DM, Asmar K, Naffaa L, El-Merhi F. Gadolinium and Multiple Sclerosis: Vessels, Barriers of the Brain, and Glymphatics. AJNR Am J Neuroradiol. 2018;39(12):2168-2176. https://doi.org/10.3174/ajnr.A5773
2. Sahraian MA, Radue EW, Haller S, Kappos L. Black holes in multiple sclerosis: definition, evolution, and clinical correlations. Acta Neurologica Scandinavica. 2010;122(1):1-8. https://doi.org/10.1111/j.1600-0404.2009.01221.x
3. Sumowski JF, Benedict R, Enzinger C, Filippi M, Geurts JJ, Hamalainen P, Hulst H, Inglese M, Leavitt VM, Rocca MA, Rosti-Otajarvi EM. Cognition in multiple sclerosis: State of the field and priorities for the future. Neurology. 2018 Feb 6;90(6):278-88. https://doi.org/10.1212/WNL.0000000000004977
4. Deoni SCL, Matthews L, Kolind SH. One component? Two components? Three? The effect of including a nonexchanging “free” water component in multicomponent driven equilibrium single pulse observation of T1 and T2. Magn Reson Med. 2013;70(1):147-154. https://doi.org/10.1002/mrm.24429
5. Lipp I, Jones DK, Bells S, et al. Comparing MRI metrics to quantify white matter microstructural damage in multiple sclerosis. Human Brain Mapping. 2019;40(10):2917-2932. https://doi.org/10.1002/hbm.24568
6. Deoni SCL. High-resolution T1 mapping of the brain at 3T with driven equilibrium single pulse observation of T1 with high-speed incorporation of RF field inhomogeneities (DESPOT1-HIFI). Journal of Magnetic Resonance Imaging. 2007;26(4):1106-1111. https://doi.org/10.1002/jmri.21130
7. Deoni SCL, Ward HA, Peters TM, Rutt BK. Rapid T2 estimation with phase-cycled variable nutation steady-state free precession. Magnetic Resonance in Medicine. 2004;52(2):435-439. https://doi.org/10.1002/mrm.20159
8. Jenkinson M, Beckmann CF, Behrens TE, Woolrich MW, Smith SM. Fsl. Neuroimage. 2012 Aug 15;62(2):782-90. https://doi.org/10.1016/j.neuroimage.2011.09.015
9. Mori S, Wakana S, Van Zijl PC, Nagae-Poetscher LM. MRI atlas of human white matter. Elsevier; 2005 May 11.
10. Zhang X, Zhang F, Huang D, Wu L, Ma L, Liu H, Zhao Y, Yu S, Shi J. Contribution of gray and white matter abnormalities to cognitive impairment in multiple sclerosis. International journal of molecular sciences. 2016 Dec 27;18(1):46. https://doi.org/10.3390/ijms18010046Figures
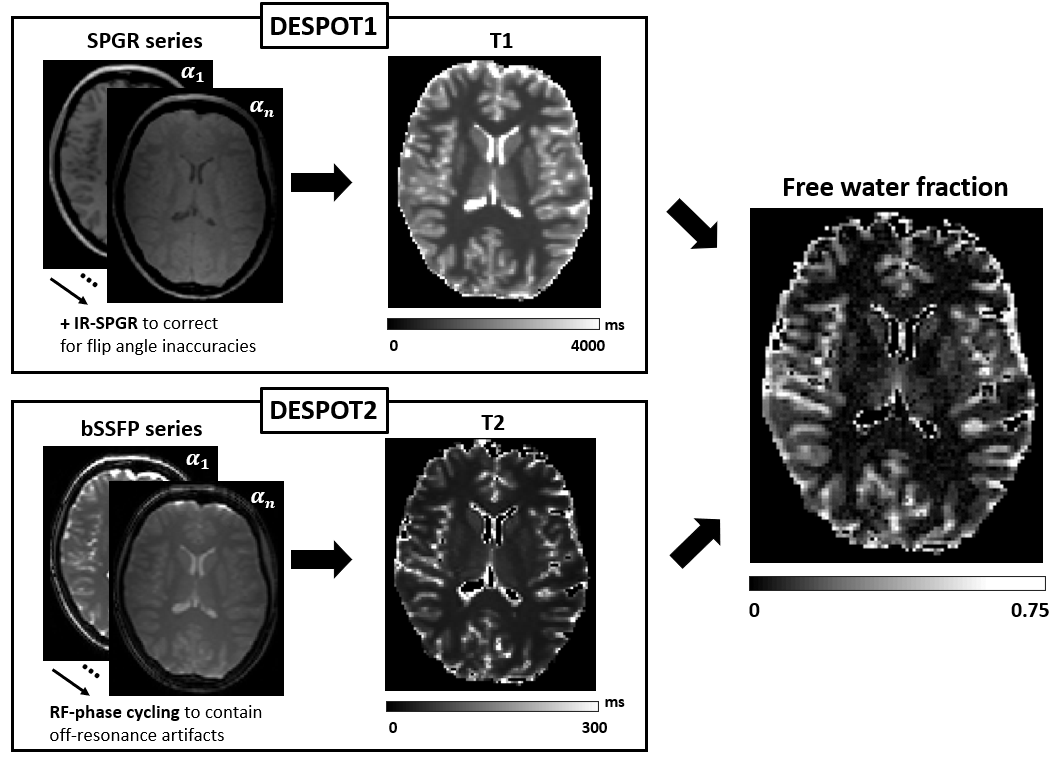
Fig. 1. Sketch of the mcDESPOT method. DESPOT1 and DESPOT2 methods are combined with a multi-component water relaxation model (fast, slow and very slow relaxing components represent myelin, intra-extra axonal and free water, respectively). T1 and T2 quantitative maps are derived by fitting spoiled-gradient echo (SPGR) and balanced steady-state free precession (bSSFP) signal intensities to varying flip angles (α1…αn). DESPOT1 uses inversion-recovery SPGR (IR-SPGR) to correct for B1 inhomogeneities6; DESPOT2 mitigates the effect of B0 inhomogeneity with RF-phase cycling7.
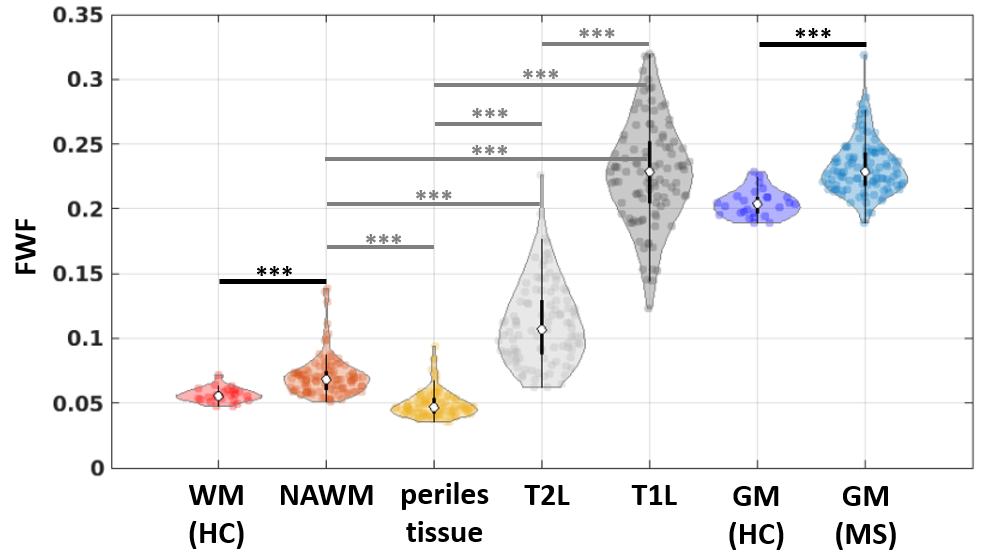
Fig. 2. Violin plots of free water fraction (FWF) in brain tissues. FWF distribution in normal (healthy control, HC) and pathological (multiple sclerosis, MS) brain tissues. From left to right: white matter, WM; normal appearing WM, NAWM; perilesional tissue, indicating an area of 5 mm around T2-hyperintense lesions; T2-hyperintense lesions, T2L; T1-hypointense lesions, T1L; gray matter, GM. Black horizontal bars indicate significant differences between the two subject groups, while gray bars indicate significant paired tests (within the patient group). *** p<0.001.
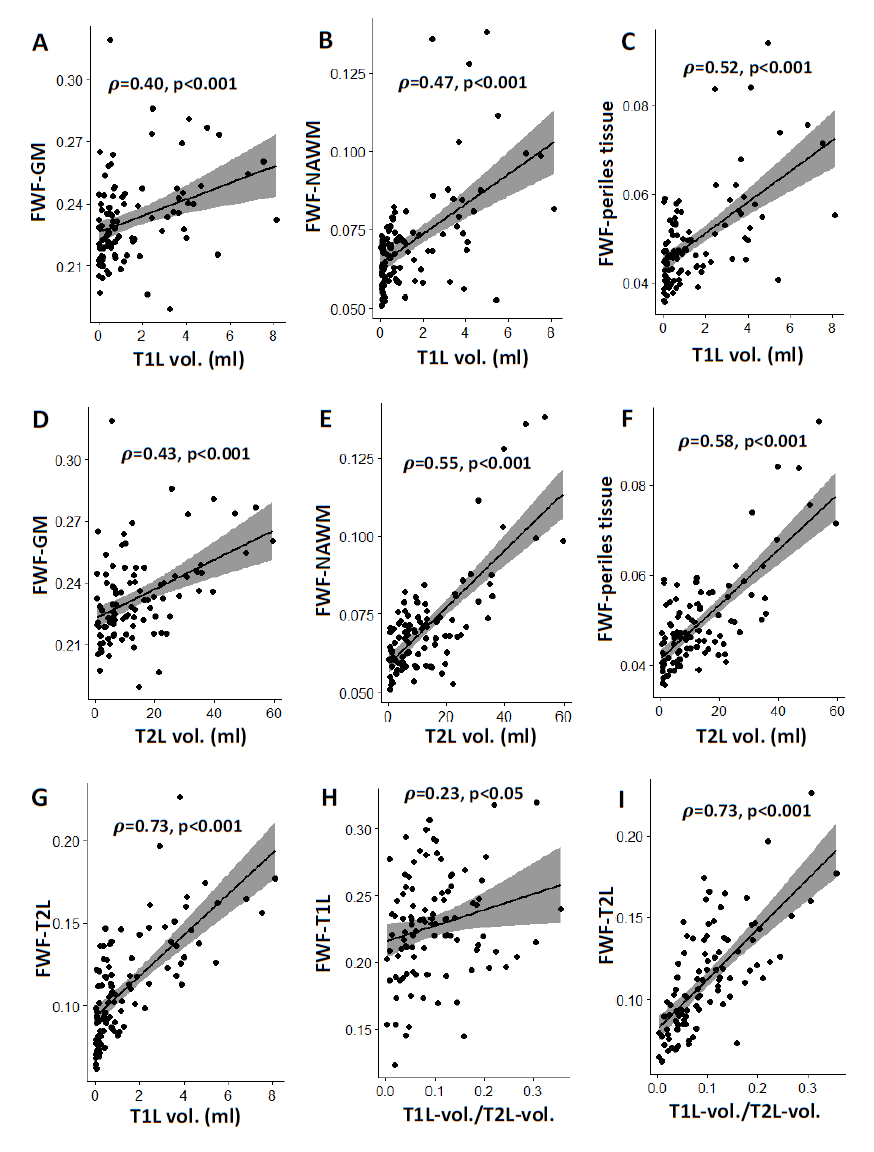
Fig. 3. Scatter plots of brain parenchyma free water fraction (FWF) and lesion characteristics. Mean FWF in gray matter (GM, A-D), normal appearing white matter (NAWM, B-E), perilesional tissue (C-F), T1-hypointense and T2-hyperintense MS lesions (G-I) is plotted against T1 and T2 lesion volumes, and their ratio for the cohort of relapsing-remitting MS patients. Spearman’s correlation coefficient ρ is indicated, together with the significance level. The regression line and confidence intervals are also reported, respectively in black and gray.
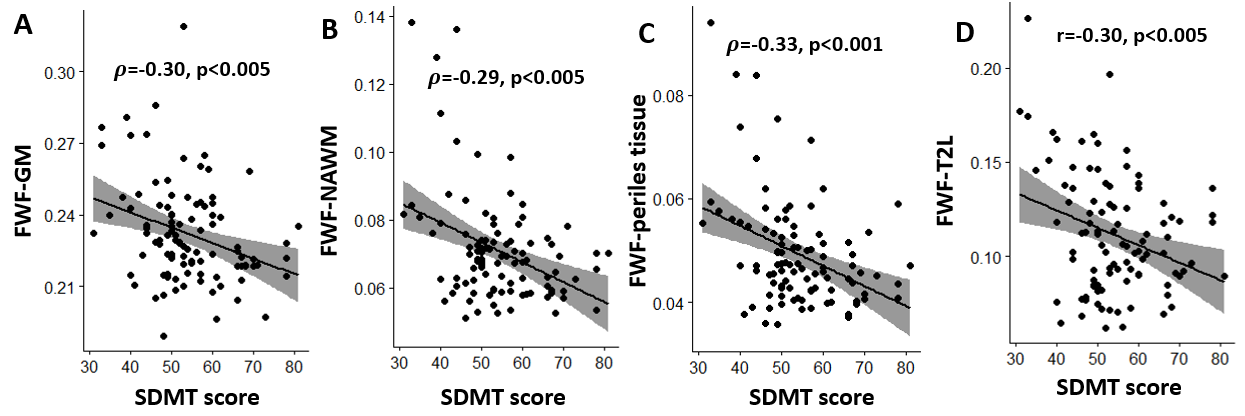
Fig. 4. Scatter plots of brain parenchyma free water fraction (FWF) and symbol digit modalities test (SDMT) scores. Mean FWF in gray matter (GM, A), normal appearing white matter (NAWM, B), perilesional tissue (C) and T2-hyperintense MS lesions (D) is plotted against the SDMT score for the cohort of relapsing-remitting MS patients. Spearman (ρ) and Pearson (r) correlation coefficients are indicated, together with the significance level, p. The regression line and confidence intervals are also reported, respectively in black and gray.
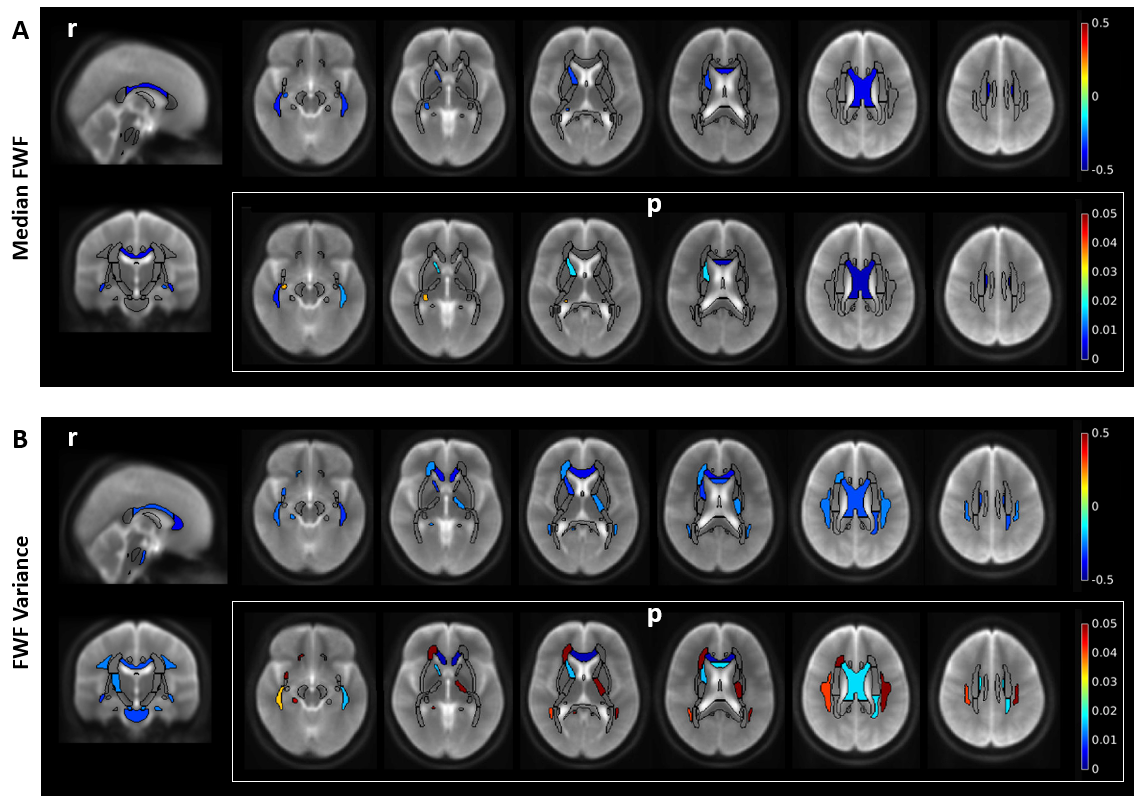
Fig. 5. Relation between free water fraction (FWF) and symbol digit modalities test (SDMT) score in MS patients. Pearson’s correlation coefficient r (top rows) between regional median FWF (A) or regional FWF variance (B) and SDMT score is illustrated in white matter regions, with the respective p-values (bottom rows). Only regions where the correlation is significant after false discovery rate correction are shown in colors, overlayed on T2-weighted anatomical maps. Sagittal and coronal views are shown for r-maps for the sake of clarity.