2824
SWI and MRSI Unite! Metabolic Insights into Iron Deposition in Relapsing-Remitting MS via 7T Magnetic Resonance Spectroscopic Imaging1Department of Biomedical Imaging and Image-guided Therapy, Medical University of Vienna, High Field MR Centre, Vienna, Austria, 2Medical University of Vienna, Department of Neurology, Vienna, Austria, 3Medical University of Vienna, Department of Neurosurgery, Vienna, Austria, 4Karl Landsteiner Institute for Clinical Molecular MRI in Musculoskeletal System, Vienna, Austria
Synopsis
Keywords: Multiple Sclerosis, Multiple Sclerosis
Besides clinical examination, conventional T1/T2-weighted magnetic resonance imaging (cMRI) is the method of choice for diagnosis and treatment monitoring of Multiple Sclerosis (MS). In contrast to cMRI, which - in MS - can only depict the severity of irreversible tissue damage and is not able to explain underlying pathological processes, MR Spectroscopic Imaging (MRSI) can detect pathologies on a biochemical level, while Susceptibility Weighted Imaging (SWI) provides information about iron deposition. In 31 relapsing-remitting (RRMS) patients, we investigate - via ultra-high resolution FID-MRSI at 7T - metabolic characteristics of different types of iron accumulation and the metabolic distribution within lesions and their vicinity.Introduction
In addition to clinical examination, conventional T1/T2-weighted magnetic resonance imaging(cMRI) is the method of choice for diagnosis and treatment monitoring of Multiple Sclerosis(MS). In contrast to cMRI, which can only depict the severity of irreversible macroscopic tissue damage, Susceptibility Weighted Imaging(SWI) provides additional information on the iron deposition of MS lesions, which has been linked to slow expansion of lesion[1-2], increased tissue damage[3] and overall worse clinical outcome[4].Nonetheless, none of these imaging modalities can fully explain underlying pathological processes[5-6]. FID-MRSI at 7T, on the other hand, overcomes prior issues in detecting small focal metabolic abnormalities in NAWM due to poor spatial of conventional MRSI and can thus(in a clinically feasible scan time of ~6min) detect pathologies on a biochemical level by quantifying several brain neurometabolites contributing to lesion formation in MS, such as elevated choline(Cho)—a marker of myelin turnover—,depleted N-acetylaspartate(NAA)—reflecting reduced neuronal/axonal integrity and function—and increased myo-inositol(mIns)—a marker for astroglial hypertrophy and hyperplasia—the reduction/elevation of the latter two correlating with clinical impairment[7-11].
The objective of our study was, thus, to categorize different types of iron deposition on SWI, compare their metabolic changes and to assess metabolic alterations inside and at the periphery of lesions.
Methods
After approval of the institutional review board, 31 patients(16 female/15 male; age 36.9±10.3 years) were scanned using a 7T whole-body MR scanner(Magnetom; Siemens Healthcare, Erlangen, Germany) and a 32-channel head coil(NovaMedical, Wilmington, MA). In each session, T1-weighted MP2RAGE images with 0.8x0.8x0.8mm3 spatial resolution, T2-weighted images with 0.86x0.86x0.86mm3 spatial resolution and SWI images with 0.3x0.3x1.2mm3 spatial resolution and TE=25ms were obtained. Single-slice FID-MRSI was performed with acquisition delay 1.3ms[12]; TR 200ms; flip angle 27°; 4-fold CAIPIRINHA acceleration[13]; scan time 6:06min; matrix size 100x100; and 2.2x2.2x8mm3 nominal voxel volume.Inhouse developed post-processing included prescan-based coil combination[14], 2D-CAIPIRINHA reconstruction[13], spatial Hamming filtering, and lipid signal removal[15]. Individual spectra were fitted via LCModel in the spectral range of 1.8 to 4.2ppm using a basis-set of 17 simulated metabolites[16] and a measured macromolecular background[17]. Metabolic, quantification precision(Cramer-Rao Lower Bounds(CRLBs)) and spectral quality(SNR, linewidth) maps were created.
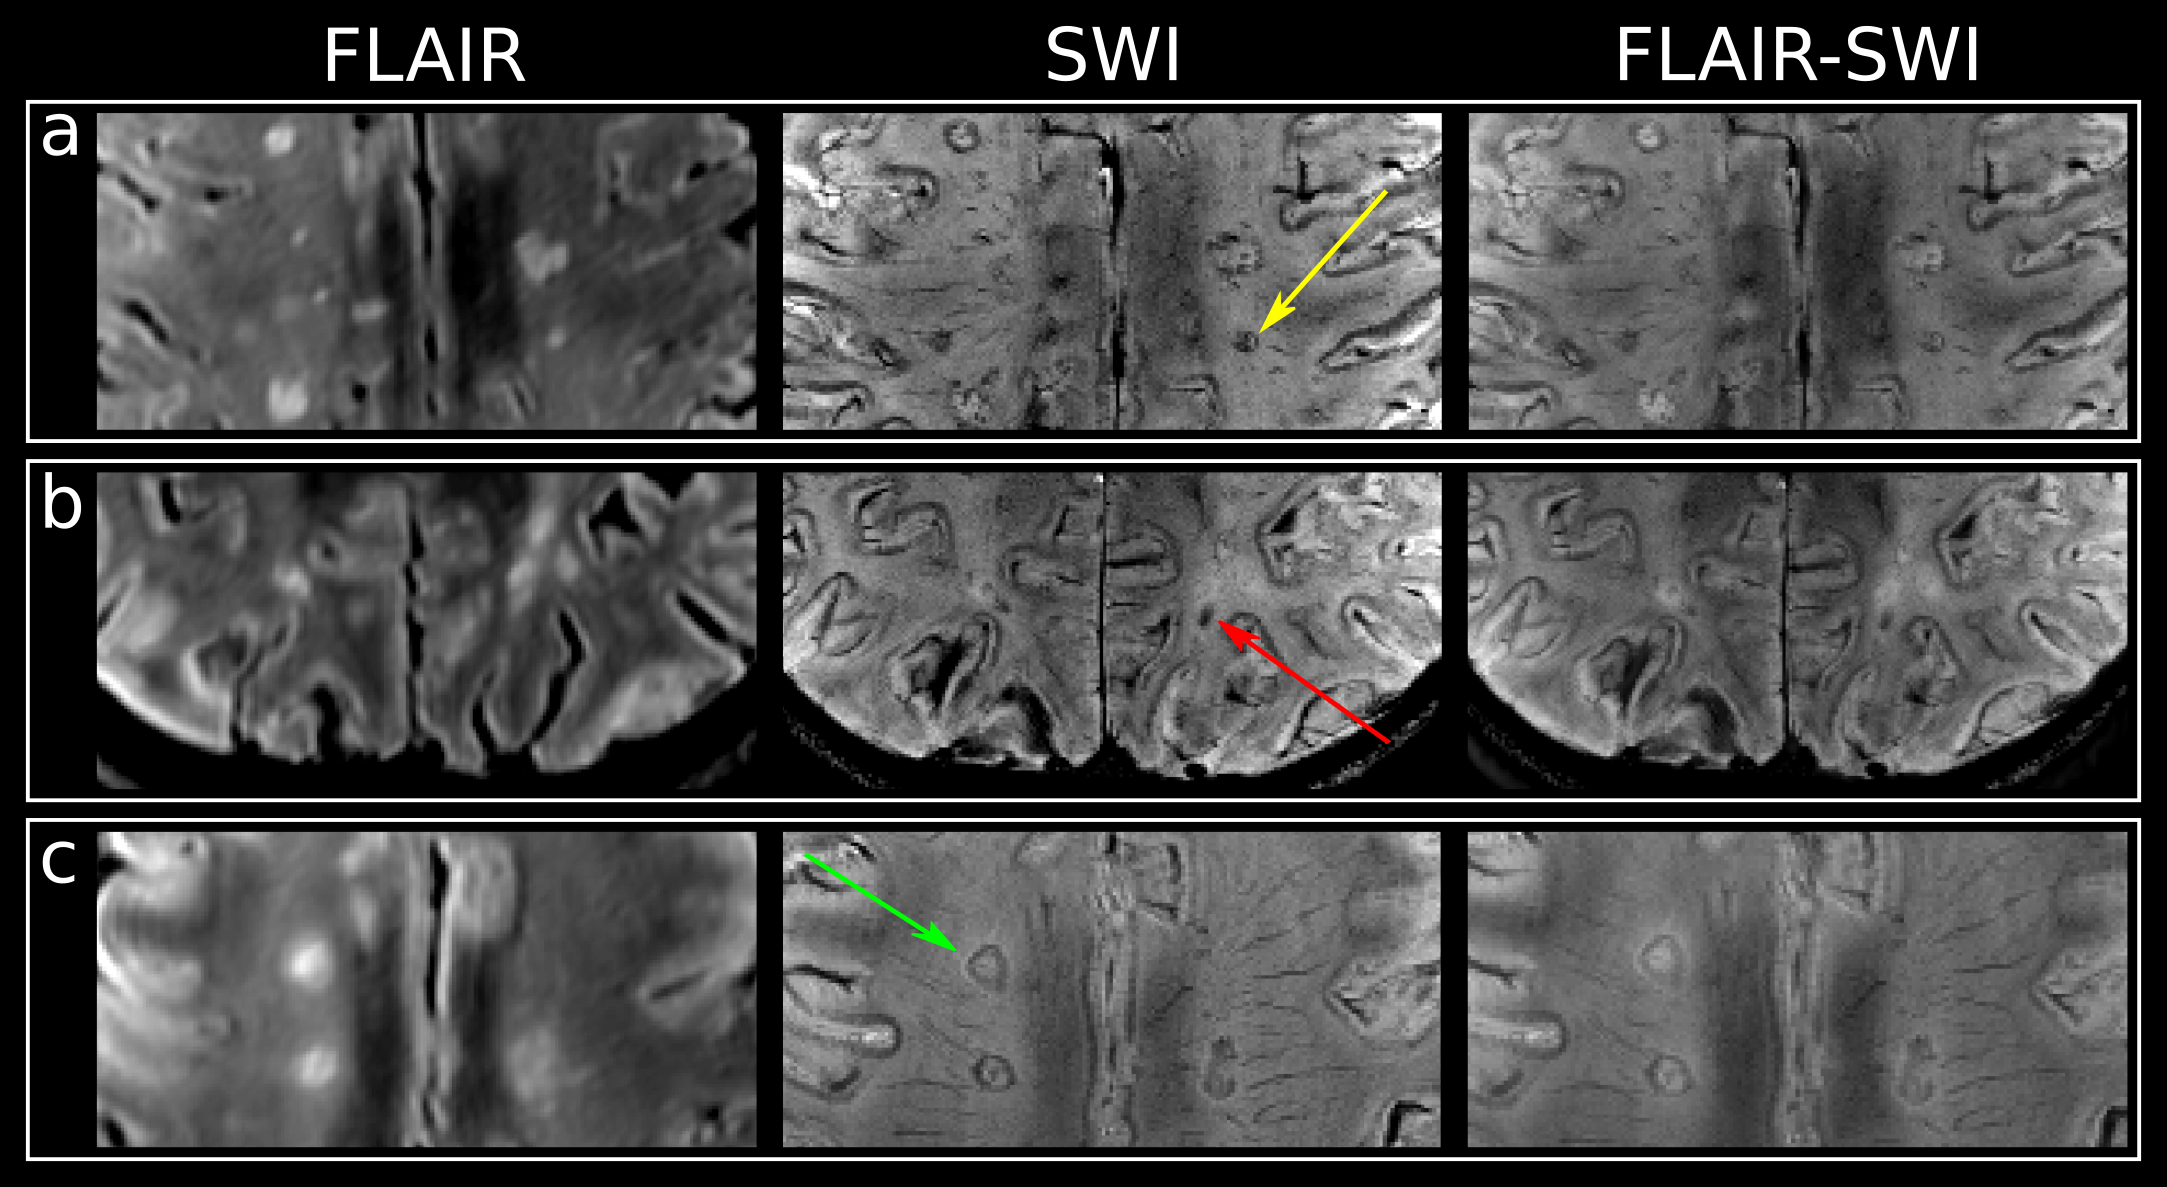
After resampling the metabolic maps to the resolution of T1-weighted MRI, ROIs were segmented manually using ITK-SNAP[18] and categorized into five ROI types (based on SWI images for lesions): “NAWM”, “non-iron”(no iron accumulation present), “rim”(distinct rim shaped iron deposition), “area”(iron accumulation covering the entire lesion) and “transition”(transition “area” to “rim” accumulation) (Figure 1). To minimize partial volume errors, only lesions with a volume >20mm³ were included.Additionally, “non-iron” and “rim” lesions eroded/dilated three times resulting in seven lesion layers(each ~1mm thick) and were corrected for intruding GM or CSF(Figure4A). Only lesions with an original size in the range of 100-400mm³ were included. Metabolic ratios for each lesion layer were normalized to the lesion’s outermost layer.
Using SPSS, descriptive statistics for Ins/tNAA, Ins/tCr, tNAA/tCr, and tCho/tCr were derived for all ROIs. Metabolite levels were compared between iron accumulation types and lesion layers via one-way ANOVA and Tukey post-hoc analysis. A p<0.05 was considered statistically significant.
Results
Differences in mIns/tNAA between iron accumulation types were the most prominent metabolic distinction (Figure 2&3): “rim” lesion had on average 35% higher mIns/tNAA than “non-iron”(p=0.02) and 65% higher mIns/tNAA than “area” lesions(p=0.035). Furthermore both “non-iron”(p≤0.0001) and “iron”(p≤0.0001) lesions showed significantly higher mIns/tNAA than “NAWM”. While not being statistically significant (p=0.051), the most interesting finding for tNAA/tCr is the difference between “area” and “rim”.Significant differences between lesion layers within and between iron accumulation types were found for mIns/tNAA and tNAA/tCr (Figure4B): For mIns/tNAA, within the group of “non-iron” lesions, the innermost layer(L-3) was 15.21% higher than the outermost layer(L+3)(p≤0.01), while within the group of “rim” lesions L-3 was 40.22% higher compared to L+3(p≤0.0001). Between the groups(“rim” vs. “non-iron”), “rim” exhibited a 21.71% higher mIns/tNAA for L-3 compared to “non-iron”(p≤0.01). For tNAA/tCr, an inverse behavior was observed. Within “non-iron” L-3 was -14.94% lower than L+3(p≤0.001), while for “rim”, L-3 exhibited a -34.73% lower tNAA/tCr compared to L+3(p≤0.001). Between the groups, L-3 was -23.27% lower in “rim” than in “non-iron”(p≤0.05).
Discussion and Conclusion
High resolution FID-MRSI at 7T with its increased spatial and spectral resolution allowed to visualize well-demarcated lesions and their abundant iron-deposition, while mapping a neurochemical profile crucial to understanding the biochemical underpinnings in MS. Previous studies have shown the importance of mIns and tNAA in changes of NAWM in MS[19-20], while iron accumulation was shown to trigger slow expansion of lesions[1-2].Our results support these findings, while trying to link metabolic changes to iron deposition:
- higher mIns/tNAA concentration in “rim” compared to “non-iron” lesions supports worse clinical outcome[4,11]
- higher mIns/tNAA in “rim” compared to “area” lesions, mostly stemming from elevated tNAA in the initial stage of diffuse iron accumulation throughout the whole lesion(in contrast to very low tNAA in lesions with clear rim shaped deposition), might represent an intrinsic attempt to enhance neural integrity, supporting the role of iron as a presumed co-regulator of remyelination[21]
- steeper gradient within the lesion and its close vicinity for mIns/tNAA and overall lower tNAA in the inside of “rim” lesions supports more severe tissue damage[3], which might - combined with mIns present outside of the lesion[20] - trigger slow expansion of lesions[1-2]
Acknowledgements
Austrian Science Fund (FWF): KLI 718, P 30701, P 34198References
[1] A. Dal-Bianco et al., “Slow expansion of multiple sclerosis iron rim lesions: pathology and 7 T magnetic resonance imaging,” Acta Neuropathol. (Berl.), vol. 133, no. 1, pp. 25–42, 2017, doi: 10.1007/s00401-016-1636-z.
[2] M. Absinta and A. Dal-Bianco, “Slowly expanding lesions are a marker of progressive MS – Yes,” Mult. Scler. J., vol. 27, no. 11, pp. 1679–1681, Oct. 2021, doi: 10.1177/13524585211013748.
[3] S. Hametner, A. Dal Bianco, S. Trattnig, and H. Lassmann, “Iron related changes in MS lesions and their validity to characterize MS lesion types and dynamics with Ultra-high field magnetic resonance imaging,” Brain Pathol., vol. 28, no. 5, pp. 743–749, 2018, doi: 10.1111/bpa.12643.
[4] M. Absinta et al., “Association of Chronic Active Multiple Sclerosis Lesions With Disability In Vivo,” JAMA Neurol., vol. 76, no. 12, pp. 1474–1483, Dec. 2019, doi: 10.1001/jamaneurol.2019.2399.
[5] G. Hangel et al., “Ultra-high resolution brain metabolite mapping at 7 T by short-TR Hadamard-encoded FID-MRSI,” NeuroImage, vol. 168, pp. 199–210, Mar. 2018, doi: 10.1016/j.neuroimage.2016.10.043.
[6] B. Strasser et al., “Coil combination of multichannel MRSI data at 7 T: MUSICAL,” NMR Biomed., vol. 26, no. 12, pp. 1796–1805, 2013, doi: 10.1002/nbm.3019.
[7] N. De Stefano et al., “Diffuse Axonal and Tissue Injury in Patients With Multiple Sclerosis With Low Cerebral Lesion Load and No Disability,” Arch. Neurol., vol. 59, no. 10, p. 1565, Oct. 2002, doi: 10.1001/archneur.59.10.1565.
[8] M. Filippi et al., “Evidence for widespread axonal damage at the earliest clinical stage of multiple sclerosis,” Brain J. Neurol., vol. 126, no. Pt 2, pp. 433–437, Feb. 2003, doi: 10.1093/brain/awg038.
[9] I. I. Kirov, V. Patil, J. S. Babb, H. Rusinek, J. Herbert, and O. Gonen, “MR Spectroscopy Indicates Diffuse Multiple Sclerosis Activity During Remission,” J. Neurol. Neurosurg. Psychiatry, vol. 80, no. 12, p. 1330, Dec. 2009, doi: 10.1136/jnnp.2009.176263.
[10] D. T. Chard et al., “Brain metabolite changes in cortical grey and normal‐appearing white matter in clinically early relapsing–remitting multiple sclerosis,” Brain, vol. 125, no. 10, pp. 2342–2352, Oct. 2002, doi: 10.1093/brain/awf240.
[11] E. Heckova et al., “Extensive Brain Pathologic Alterations Detected with 7.0-T MR Spectroscopic Imaging Associated with Disability in Multiple Sclerosis,” Radiology, vol. 303, no. 1, pp. 141–150, Apr. 2022, doi: 10.1148/radiol.210614.
[12] G. Hangel et al., “Ultra-high resolution brain metabolite mapping at 7 T by short-TR Hadamard-encoded FID-MRSI,” NeuroImage, vol. 168, pp. 199–210, Mar. 2018, doi: 10.1016/j.neuroimage.2016.10.043.
[13] B. Strasser et al., “(2 + 1)D-CAIPIRINHA accelerated MR spectroscopic imaging of the brain at 7T,” Magn. Reson. Med., vol. 78, no. 2, pp. 429–440, 2017, doi: https://doi.org/10.1002/mrm.26386.
[14] B. Strasser et al., “Coil combination of multichannel MRSI data at 7 T: MUSICAL,” NMR Biomed., vol. 26, no. 12, pp. 1796–1805, 2013, doi: https://doi.org/10.1002/nbm.3019.
[15] B. Bilgic et al., “Fast Image Reconstruction with L2-Regularization,” J. Magn. Reson. Imaging JMRI, vol. 40, no. 1, pp. 181–191, Jul. 2014, doi: 10.1002/jmri.24365.
[16] A. Naressi et al., “Java-based graphical user interface for the MRUI quantitation package,” Magn. Reson. Mater. Phys. Biol. Med., vol. 12, no. 2, p. 141, Jun. 2001, doi: 10.1007/BF02668096.
[17] M. Považan et al., “Mapping of brain macromolecules and their use for spectral processing of 1H-MRSI data with an ultra-short acquisition delay at 7T,” NeuroImage, vol. 121, pp. 126–135, Nov. 2015, doi: 10.1016/j.neuroimage.2015.07.042.
[18] P. A. Yushkevich et al., “User-guided 3D active contour segmentation of anatomical structures: Significantly improved efficiency and reliability,” NeuroImage, vol. 31, no. 3, pp. 1116–1128, Jul. 2006, doi: 10.1016/j.neuroimage.2006.01.015.
[19] K. T. M. Fernando et al., “Elevated white matter myo‐inositol in clinically isolated syndromes suggestive of multiple sclerosis,” Brain, vol. 127, no. 6, pp. 1361–1369, Jun. 2004, doi: 10.1093/brain/awh153.
[20] A. Lipka et al., “Lesion-Specific Metabolic Alterations in Relapsing-Remitting Multiple Sclerosis Via 7 T Magnetic Resonance Spectroscopic Imaging,” Invest. Radiol., p. 10.1097/RLI.0000000000000913, doi: 10.1097/RLI.0000000000000913.
[21] E. Stephenson, N. Nathoo, Y. Mahjoub, J. F. Dunn, and V. W. Yong, “Iron in multiple sclerosis: roles in neurodegeneration and repair,” Nat. Rev. Neurol., vol. 10, no. 8, Art. no. 8, Aug. 2014, doi: 10.1038/nrneurol.2014.118.
Figures

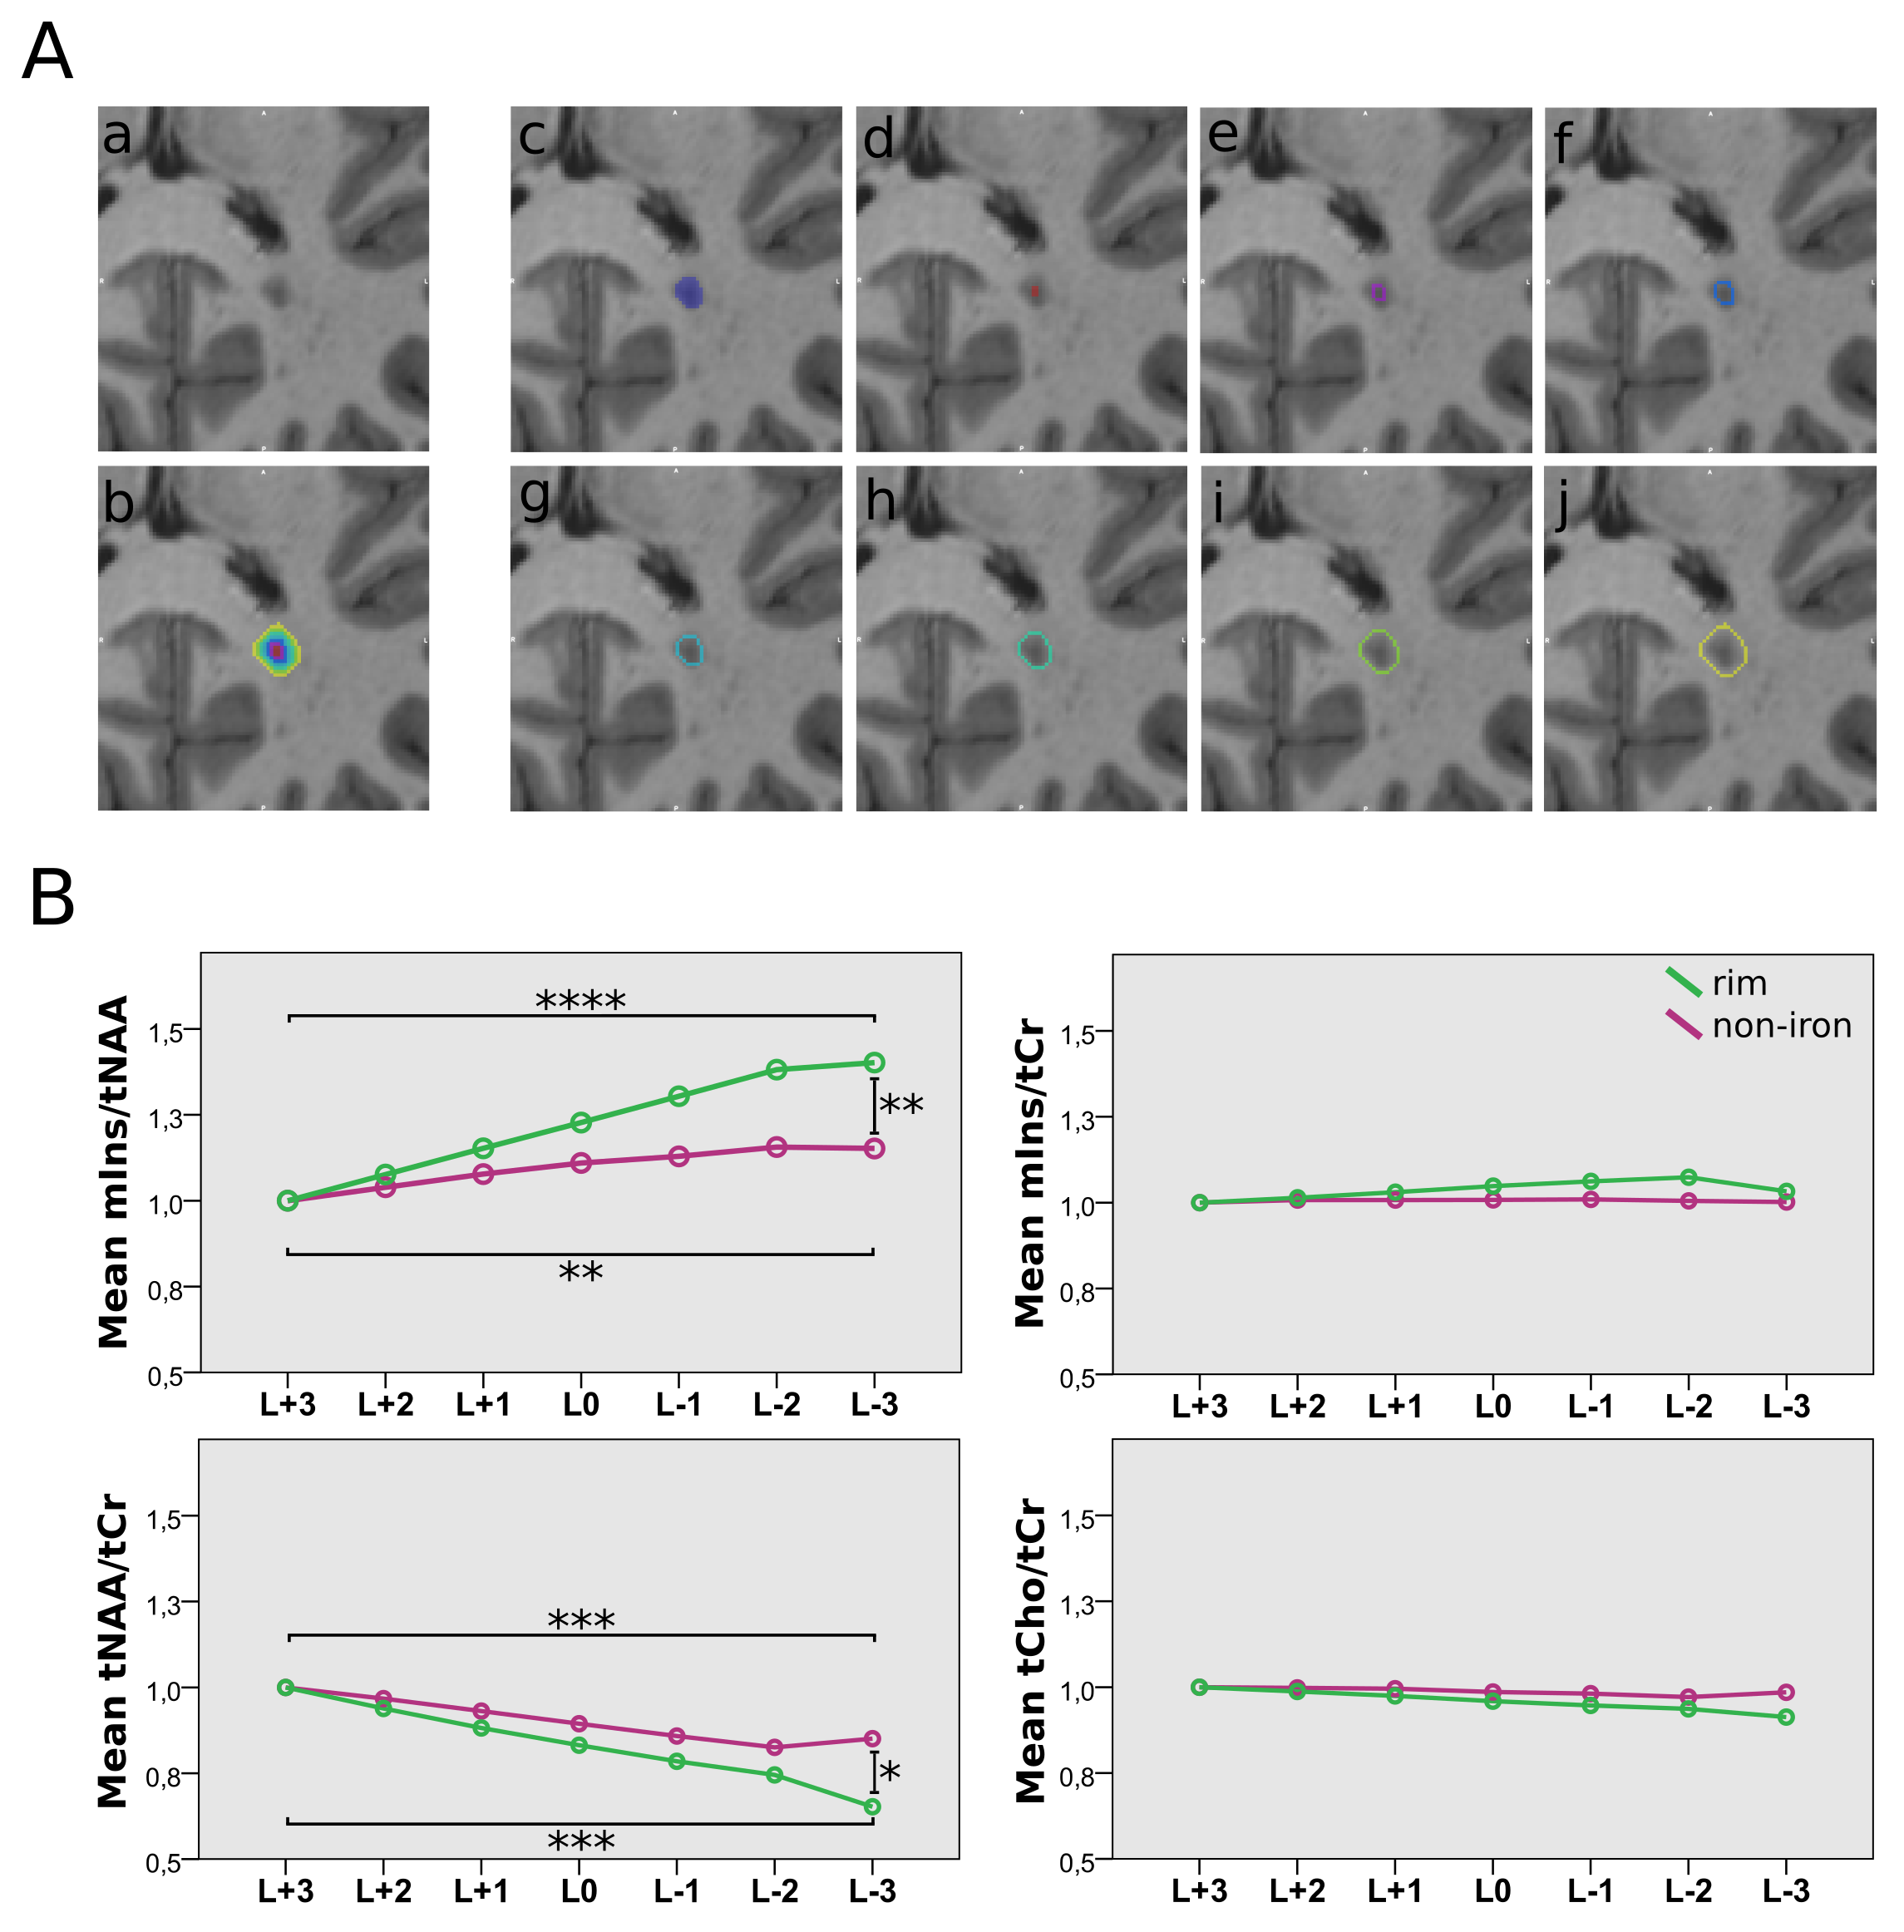
A: Lesion layers created by expansion/dilation of the lesion: (a) shows the MP2RAGE lesion itself, (b) all lesion rings are overlaid on top of the lesion, (c) represents the originally segmented lesion, and (d)-(j) depict each of the 7 lesion layer rings separately.
B: Boxplot diagram for normalized mIns/tNAA, mIns/tCr, tNAA/tCr, and tCho/tCr show significant differences in metabolite concentrations between the lesion layers of “rim” and “non-iron” lesions for mIns/tNAA and tNAA/tCr. Only significant results between L+3, L0 and L-3 are shown.