2819
Discovering the Metabolomic Relationships between Lung Cancer and Alzheimer’s Disease using Nuclear Magnetic Resonance Spectroscopy1Department of Radiology, Massachusetts General Hospital, Boston, MA, United States, 2Harvard Medical School, Boston, MA, United States, 3Charité - Universitätsmedizin Berlin, Berlin, Germany, 4Department of Radiation Oncology, Charité - Universitätsmedizin Berlin, Berlin, Germany, 5Department of Environmental Health, Harvard T.H. Chan School of Public Health, Boston, MA, United States
Synopsis
Keywords: Alzheimer's Disease, Spectroscopy, Metabolomics
Herein, we report our preliminary data on metabolomic associations between human lung cancer (LuCa) and Alzheimer’s disease (AD) measured from serum samples using high resolution magic angle spinning (HRMAS) MRS. The current project’s objective is to establish MRS-based tissue pathology-guided serum metabolomic profiles for matched LuCa patients, with and without AD, by comparing serum profiles measured from matched healthy controls. Initial results demonstrate the feasibility of HRMAS MRS for LuCa-AD metabolomic mechanisms investigation. Our findings serve as a foundation for innovative future diagnostic and treatment studies.Introduction
Alzheimer’s Disease (AD) and Lung cancer (LuCa) are among the leading causes of mortality in the United States [1]. Remarkably, several studies demonstrated a potential inverse co-morbidity of AD with LuCa [2-6]. Possible explanations related to the cell cycle (dys)regulation include presence of specific neuropathological features, immune checkpoint functions and increased circular RNA levels [7-9]. Furthermore, some anti-dementia drugs have shown evidence of anti-cancer activity and vice versa [10-12].Metabolomic profiles for LuCa or AD alone have been established previously [13-15]. However, to the best of our knowledge, no studies have investigated the potential LuCa and AD serum metabolomic associations. We aim to measure LuCa tissue and serum-paired specimens using high-resolution magic angle spinning (HRMAS) MRS to establish tissue pathology-guided serum metabolomic profiles for matched LuCa patients, with and without AD, by comparing serum profiles measured from matched healthy controls.
Discovery and understanding of metabolomic relationships between LuCa and AD may facilitate the early diagnosis and contribute to the development of targeted interventions that exploit metabolomics mechanisms and thus enhance therapeutic outcomes.
Methods
The current institutional review board–approved study included 30 pairs of tissue and serum samples from newly-diagnosed primary LuCa patients with AD diagnosis (based on a definitive clinical evaluation by a neurologist), 30 tissue-serum pairs from LuCa patients without AD and 60 serum samples from healthy controls obtained from the BioBank of Mass General Brigham and matched by age, gender, and smoking status. All tissue and serum samples were stored at -80°C until analysis.Presently, we have analyzed 11 serum samples from 11 patients. The HRMAS rotors were filled with 10µl of serum. We conducted HRMAS proton MRS measurements at 4 °C with a spin rate of 5000 Hz using a Bruker Avance 600 MHz spectrometer. Spectra were analyzed with Bruker Topspin 3.6.2. Statistical analysis was performed using JMP and included Mann-Whitney-Wilcoxon test for non-normally distributed data. A P-value of ≤ 0.05 was considered statistically significant.
Results
Study PopulationThe measured samples included 6 LuCa patients with diagnosed AD [F=3, mean age (range)=83.3 (77-85), 2 former smokers, 1 never smoker; M=3, mean age (range)=82 (75-89), 3 former smokers] and 5 LuCa patients without AD [F=2, mean age (range)=77 (77-77), both former smokers; M=3, mean age (range)=70.5 (70-71), 1 never smokers, 2 former smokers].
Metabolic regions significant for human LuCa and AD associations
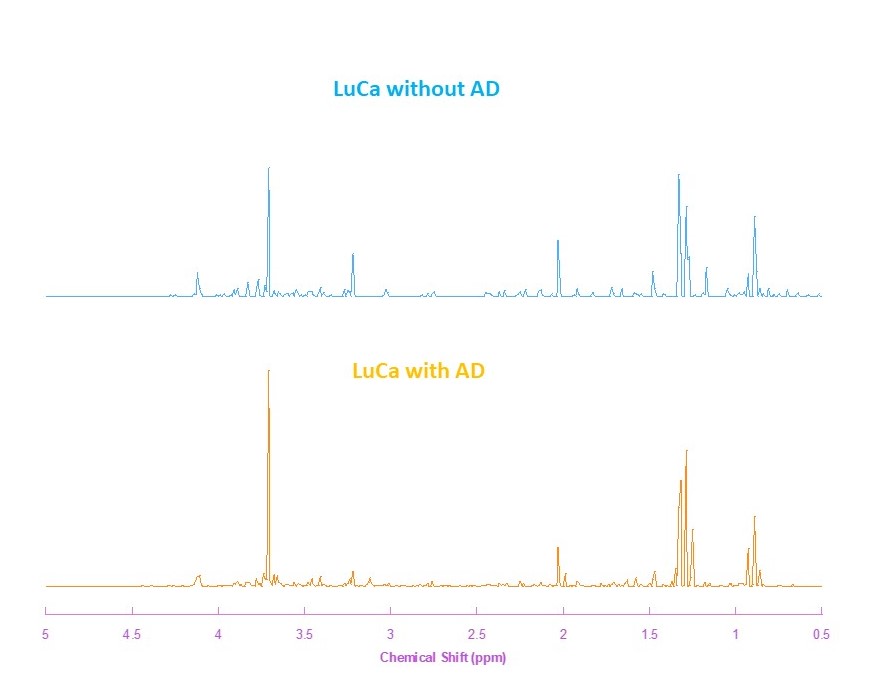
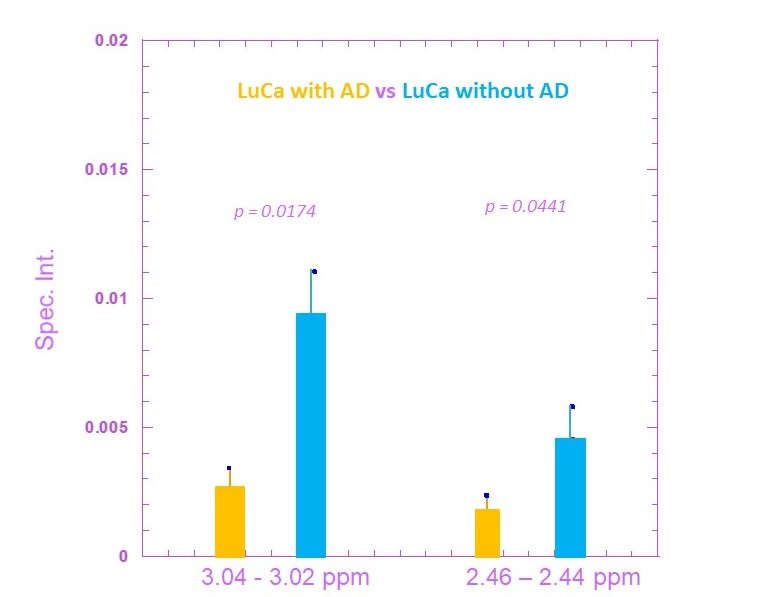
Figure 1 compares the averaged HRMAS NMR spectra of LuCa with AD (n= 6) and LuCa without AD (n=5) serum samples. From these spectra, 8 spectral regions of interest (ROIs) were determined. Among these 8 spectral ROIs, two of them presented significant differences between the LuCa with AD and LuCa without AD groups, with P-values less than 0.05. These regions are: 3.04-3.02 ppm and 2.46-2.44 ppm. Figure 2 presents spectral intensity means and standard errors measured from LuCa with AD and LuCa without AD groups in these two metabolic regions with respective P-values of group differences.
Discussion and Conclusion
The current study of human LuCa serum metabolomics for patients with and without AD aims to evaluate the biological mechanisms of possible LuCa-AD associations. Of note, our study focuses on discovering differences in ROIs rather than naming metabolic alterations characteristic for LuCa-AD associations owing to the fact that a single metabolite may appear in various spectral regions. Our findings, whilst preliminary, seem promising in the discovery of MRS metabolomics profiles underlying LuCa-AD relationships.Acknowledgements
This study is supported in part by NIH grants AG070257, CA273010, U01CA209414 and by MGH Martinos Center for Biomedical Imaging.References
1. Siegel RL, Miller KD, Fuchs HE, Jemal A. Cancer statistics, 2022. CA: A Cancer Journal for Clinicians. 2022;72:7-33.
2. Shi HB, Tang B, Liu YW, Wang XF, Chen GJ. Alzheimer disease and cancer risk: a meta-analysis. J Cancer Res Clin Oncol. 2015;141:485-94.
3. Musicco M, Adorni F, Di Santo S, Prinelli F, Pettenati C, Caltagirone C, et al. Inverse occurrence of cancer and Alzheimer disease: a population-based incidence study. Neurology. 2013;81:322-8.
4. Ou SM, Lee YJ, Hu YW, Liu CJ, Chen TJ, Fuh JL, et al. Does Alzheimer's disease protect against cancers? A nationwide population-based study. Neuroepidemiology. 2013;40:42-9.
5. Sánchez-Valle J, Tejero H, Ibáñez K, Portero JL, Krallinger M, Al-Shahrour F, et al. A molecular hypothesis to explain direct and inverse co-morbidities between Alzheimer’s Disease, Glioblastoma and Lung cancer. Scientific Reports. 2017;7:4474.
6. Sherzai AZ, Parasram M, Haider JM, Sherzai D. Alzheimer Disease and Cancer: A National Inpatient Sample Analysis. Alzheimer Disease & Associated Disorders. 2020;34:122-7.
7. Karanth SD, Katsumata Y, Nelson PT, Fardo DW, McDowell JK, Schmitt FA, et al. The Association Between Cancer and Alzheimer's-Type Neuropathology: A Community-Based Cohort Study. Cancer Epidemiol Biomarkers Prev. 2022;31:1513.
8. Akhter R. Circular RNA and Alzheimer's Disease. Adv Exp Med Biol. 2018;1087:239-43.
9. Rogers NK, Romero C, SanMartín CD, Ponce DP, Salech F, López MN, et al. Inverse Relationship Between Alzheimer's Disease and Cancer: How Immune Checkpoints Might Explain the Mechanisms Underlying Age-Related Diseases. J Alzheimers Dis. 2020;73:443-54.
10. Habchi J, Arosio P, Perni M, Costa AR, Yagi-Utsumi M, Joshi P, et al. An anticancer drug suppresses the primary nucleation reaction that initiates the production of the toxic Aβ42 aggregates linked with Alzheimer’s disease. Science Advances. 2016;2:e1501244.
11. Albayrak G, Demirtas Korkmaz F. Memantine shifts cancer cell metabolism via AMPK1/2 mediated energetic switch in A549 lung cancer cells. Excli j. 2021;20:223-31.
12. Mansour HM, Fawzy HM, El-Khatib AS, Khattab MM. Potential Repositioning of Anti-cancer EGFR Inhibitors in Alzheimer's Disease: Current Perspectives and Challenging Prospects. Neuroscience. 2021;469:191-6.
13. Weng J, Muti IH, Zhong AB, Kivisäkk P, Hyman BT, Arnold SE, et al. A Nuclear Magnetic Resonance Spectroscopy Method in Characterization of Blood Metabolomics for Alzheimer's Disease. Metabolites. 2022;12.
14. Schult TA, Lauer MJ, Berker Y, Cardoso MR, Vandergrift LA, Habbel P, et al. Screening human lung cancer with predictive models of serum magnetic resonance spectroscopy metabolomics. Proc Natl Acad Sci U S A. 2021;118.
15. Berker Y, Vandergrift LA, Wagner I, Su L, Kurth J, Schuler A, et al. Magnetic Resonance Spectroscopy-based Metabolomic Biomarkers for Typing, Staging, and Survival Estimation of Early-Stage Human Lung Cancer. Scientific Reports. 2019;9:10319.
Figures