2818
Comparison of MR Spectroscopy of Probable Alzheimer’s Disease and Symptoms of Chronic Traumatic Encephalopathy
Jessica J. Chen1, Michael L. Alosco2, Huijun Liao1, Inga K. Koerte3,4, Martha E. Shenton3, Robert A. Stern5, and Alexander P. Lin1
1Center for Clinical Spectroscopy,Department of Radiology, Brigham and Women's Hospital, Harvard Medical School, Boston, MA, United States, 2Boston University School of Medicine, Department of Neurology, Boston University Alzheimer's Disease and CTE Centers, Boston, MA, United States, 3Psychiatry Neuroimaging Laboratory, Department of Psychiatry, Brigham and Women's Hospital, Harvard Medical School, Boston, MA, United States, 4Department of Child and Adolescent Psychiatry, Psychosomatic, and Psychotherapy, Ludwig-Maximilian-University, Munich, Germany, 5Neurosurgery, and Anatomy & Neurobiology, Departments of Neurology, Boston University Alzheimer’s Disease and CTE Center, Boston, MA, United States
1Center for Clinical Spectroscopy,Department of Radiology, Brigham and Women's Hospital, Harvard Medical School, Boston, MA, United States, 2Boston University School of Medicine, Department of Neurology, Boston University Alzheimer's Disease and CTE Centers, Boston, MA, United States, 3Psychiatry Neuroimaging Laboratory, Department of Psychiatry, Brigham and Women's Hospital, Harvard Medical School, Boston, MA, United States, 4Department of Child and Adolescent Psychiatry, Psychosomatic, and Psychotherapy, Ludwig-Maximilian-University, Munich, Germany, 5Neurosurgery, and Anatomy & Neurobiology, Departments of Neurology, Boston University Alzheimer’s Disease and CTE Center, Boston, MA, United States
Synopsis
Keywords: Alzheimer's Disease, Spectroscopy, traumatic brain injury, chronic traumatic encephalopathy
Chronic traumatic encephalopathy (CTE) is widely found in individuals exposed to repetitive head impacts (RHI) in organized contact sports, such as football. Previous findings have determined that there is a distinct deposition of phosphorylated tau (p-tau) in its neuropathology compared to other tauopathies, including Alzheimer’s disease. However, there is a lack of diagnostic criteria that examine later-life neurochemical changes due to long-term neurologic consequences to RHI. This study uses magnetic resonance spectroscopy (MRS) to compare neurochemical markers between participants with probable Alzheimer’s disease and symptomatic chronic traumatic encephalopathy in relation to healthy controls.Introduction
Chronic traumatic encephalopathy (CTE) is a neurodegenerative disease often found in professional contact sport athletes with history of repetitive head impacts (RHI).1-3 CTE has been compared to Alzheimer’s disease (AD) due to its neuropathological and clinical similarities.1-2 Currently, CTE can only be diagnosed accurately by post-mortem from its neuropathology.1 A distinct deposition of phosphorylated tau (p-tau) in neurons can be found with a unique progression pattern starting around small blood vessels at the depths of the cerebral sulci.1-3 However, neuroimaging and fluid biomarkers can be a potential method for in-vivo detection to differentiate from other neurological disorders.2,3 Magnetic resonance spectroscopy (MRS) allows us to detect neurochemical markers and measure concentration changes. For example, AD can be diagnosed early in the prodromal stage as there is an elevation of myo-inositol (Ins) detected before a decrease in N-acetyl-aspartate (NAA).4 Decrease in glutamate (Glu) may contribute to cognitive impairment in AD.5,6 Despite methodological difficulty in separating Glu from the glutamine (Gln) signal, an examination of Glu metabolism may provide insight into the pathophysiology of either CTE or AD.Methods
Data collection:In this study, we compared 8 AD patients recruited from the Boston University Alzheimer's Disease and CTE Center Registry (mean age: 71.8 ± 14.2) with 8 symptomatic former National Football League (NFL) and collegiate football players (mean age: 64.8 ± 7.8) and 8 healthy controls (mean age: 64.1 ± 7.1) recruited from the Diagnostics, Imaging, and Genetics Network for the Objective Study and Evaluation of Chronic Traumatic Encephalopathy. All participants are male aged 45 and above.
Specific criteria for each group are as follows: The football players group (FTBL) was comprised of former NFL players that played ≥12 years of organized football and collegiate football players with ≥3 years of play in college that have signs and symptoms of CTE. Control group (CTL) has no previous participation in the organized contact sports and no military service, or history of any brain injury or self-reported concussion. AD participants must have cognitive impairment due to suspected AD and no previous history of self-reported concussion or repetitive head impacts (RHI).
All MRI and MRS scans were performed on a 3T scanner (Siemens Skyra, Erlangen, Germany) with a 32-channel head coil array. MRS scans were acquired with single voxel short echo (TR/TE: 1500/35ms, PRESS, voxel size: 2x2x2 cm3, 64 averages) located in the posterior cingulate gyrus (Fig.1). An automatic pre-scan was used to adjust the frequency, transmitter voltage, water suppression, shimming and manual shimming if line widths were greater than 15 Hz.
Data processing and quantification:
MRS scans were reconstructed using OpenMRS Lab and quantified using LC Model. Concentrations of myo-inositol (Ins), total N-acetyl asparatate (NAA+NAAG), total creatine (Cr+PCr), total choline (GPC+PCh), combined glutamate and glutamine (Glu+Gln), and lactate (Lac) were quantified using LCModel. In GraphPad Prism 8, scatterplots of each metabolite concentration for all cohorts were plotted along with a linear fit to determine that the distribution is normalized. Scatterplot along with mean metabolite concentration in each group were displayed. One-way analysis of variance (ANOVA) was used to confirm significant differences between cohorts’ mean. Finally, paired t-tests were performed between metabolites of interest across all cohorts.
Results and Discussion
In this study, we observed that Glu+Gln concentration were significantly lower in AD group compared to both CTL and FTBL groups (Fig. 2, Table 1 and 2). Glutamate is the primary excitatory neurotransmitter of the central nervous system. It is often used as an indicator for neuron-astrocyte interaction and is involved in mechanism of neuronal function, metabolism, and excitotoxicity.6 This neurochemical change is more prominent in AD and is confirmed by previous studies.5 While there was no significant difference between the CTL and FTBL group (Table 3), mean Glu+Gln concentration were lower in the FTBL group when compared to controls indicating that a similar process may be underway for those at risk for developing CTE.The second finding is a significant difference between AD and FTBL group for Cr+PCr concentrations (Table 2). Creatine is involved in the synthesis of ATP in the brain and therefore related to brain energetics.7 Our previous study in NFL players showed a reduction of creatine that correlated with higher exposure to head impacts.7 In AD, changes in creatine have been inconsistent but also thought to be related to reductions in brain energetics.8
Previous longitudinal studies that follow the progression of AD shown that elevation in the Ins concentration was shown to precede the decrease in the NAA concentration.4 However, there was no reported difference in both Ins and NAA+NAAG levels between any of the three groups. One of the weaknesses of this study is the small number of subjects in each group and may be underpowered for these results.
Conclusion
In a study of both AD and football players at risk for CTE, we found reductions in glutamate and creatine which may be reflective of glutamate excitotoxicity and alterations in brain energetics, respectively. These results are preliminary and need to be substantiated in larger studies.Acknowledgements
I would like to express my deepest gratitude to all those who were involved in the collaboration and participated in the process. I would especially like to thank Dr. Michael L. Alosco who co-PI with my mentor Dr. Alexander P. Lin for his contribution and effort in leading this project. Thank you to the team at Boston University's DIAGNOSE CTE and ADCTEC Registry for their permission to allow me to analyze their collected dataset and add to the narrative.References
[1] McKee, Cairns, N. J., Dickson, D. W., Folkerth, R. D., Dirk Keene, C., Litvan, I., Perl, D. P., Stein, T. D., Vonsattel, J.-P., Stewart, W., Tripodis, Y., Crary, J. F., Bieniek, K. F., Dams-O’Connor, K., Alvarez, V. E., & Gordon, W. A. (2016). The first NINDS/NIBIB consensus meeting to define neuropathological criteria for the diagnosis of chronic traumatic encephalopathy. Acta Neuropathologica, 131(1), 75–86.https://doi.org/10.1007/s00401-015-1515-z[2] Alosco, Mian, A. Z., Buch, K., Farris, C. W., Uretsky, M., Tripodis, Y., Baucom, Z., Martin, B., Palmisano, J., Puzo, C., Ang, T. F. A., Joshi, P., Goldstein, L. E., Au, R., Katz, D. I., Dwyer, B., Daneshvar, D. H., Nowinski, C., Cantu, R. C., … Mez, J. (2021). Structural MRI profiles and tau correlates of atrophy in autopsy-confirmed CTE. Alzheimer's Research & Therapy, 13(1), 193–193.https://doi.org/10.1186/s13195-021-00928-y
[3] Alosco, Tripodis, Y., Rowland, B., Chua, A. S., Liao, H., Martin, B., Jarnagin, J., Chaisson, C. E., Pasternak, O., Karmacharya, S., Koerte, I. K., Cantu, R. C., Kowall, N. W., McKee, A. C., Shenton, M. E., Greenwald, R., McClean, M., Stern, R. A., & Lin, A. (2020). A magnetic resonance spectroscopy investigation in symptomatic former NFL players. Brain Imaging and Behavior, 14(5), 1419–1429.https://doi.org/10.1007/s11682-019-00060-4
[4] Kantarci, Jack, C. R., Petersen, R. C., Xu, Y. C., Campeau, N. G., O'Brien, P. C., Smith, G. E., Ivnik, R. J., Boeve, B. F., Kokmen, E., & Tangalos, E. G. (2000). Regional metabolic patterns in mild cognitive impairment and alzheimer's disease : A 1H MRS study. Neurology, 55(2), 210–217.https://doi.org/10.1212/WNL.55.2.210
[5] Lin, Shic, F., Enriquez, C., & Ross, B. D. (2003). Reduced glutamate neurotransmission in patients with Alzheimer's disease?an in vivo 13C magnetic resonance spectroscopy study. Magma (New York, N.Y.), 16(1), 29–42.https://doi.org/10.1007/s10334-003-0004-x
[6] Zeydan, Deelchand, D. K., Tosakulwong, N., Lesnick, T. G., Kantarci, O. H., Machulda, M. M., Knopman, D. S., Lowe, V. J., Jack, C. R., Petersen, R. C., Öz, G., & Kantarci, K. (2017). Decreased Glutamate Levels in Patients with Amnestic Mild Cognitive Impairment: An sLASER Proton MR Spectroscopy and PiB‐PET Study. Journal of Neuroimaging, 27(6), 630–636.https://doi.org/10.1111/jon.12454
[7] Chen, van Zijl, P. C. M., Wei, Z., Lu, H., Duan, W., Wong, P. C., Li, T., & Xu, J. (2021). Early detection of Alzheimer's disease using creatine chemical exchange saturation transfer magnetic resonance imaging. NeuroImage (Orlando, Fla.), 236, 118071–118071.https://doi.org/10.1016/j.neuroimage.2021.118071
[8] Maul, Giegling, I., & Rujescu, D. (2020). Proton Magnetic Resonance Spectroscopy in Common Dementias-Current Status and Perspectives. Frontiers in Psychiatry, 11, 769–769. https://doi.org/10.3389/fpsyt.2020.00769
Figures
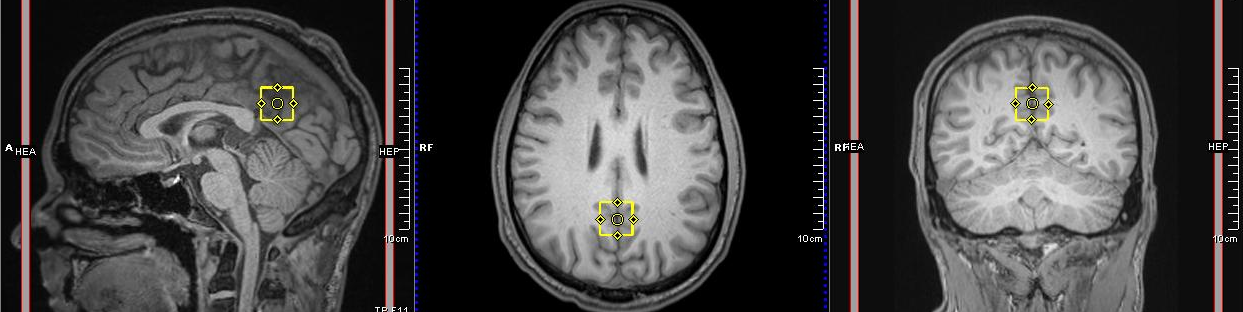
Fig 1. MRS voxel
placement. A single-subject voxel, shown in yellow, placed in posterior cingulate gyrus
with three orientation view: sagittal, axial and coronal.
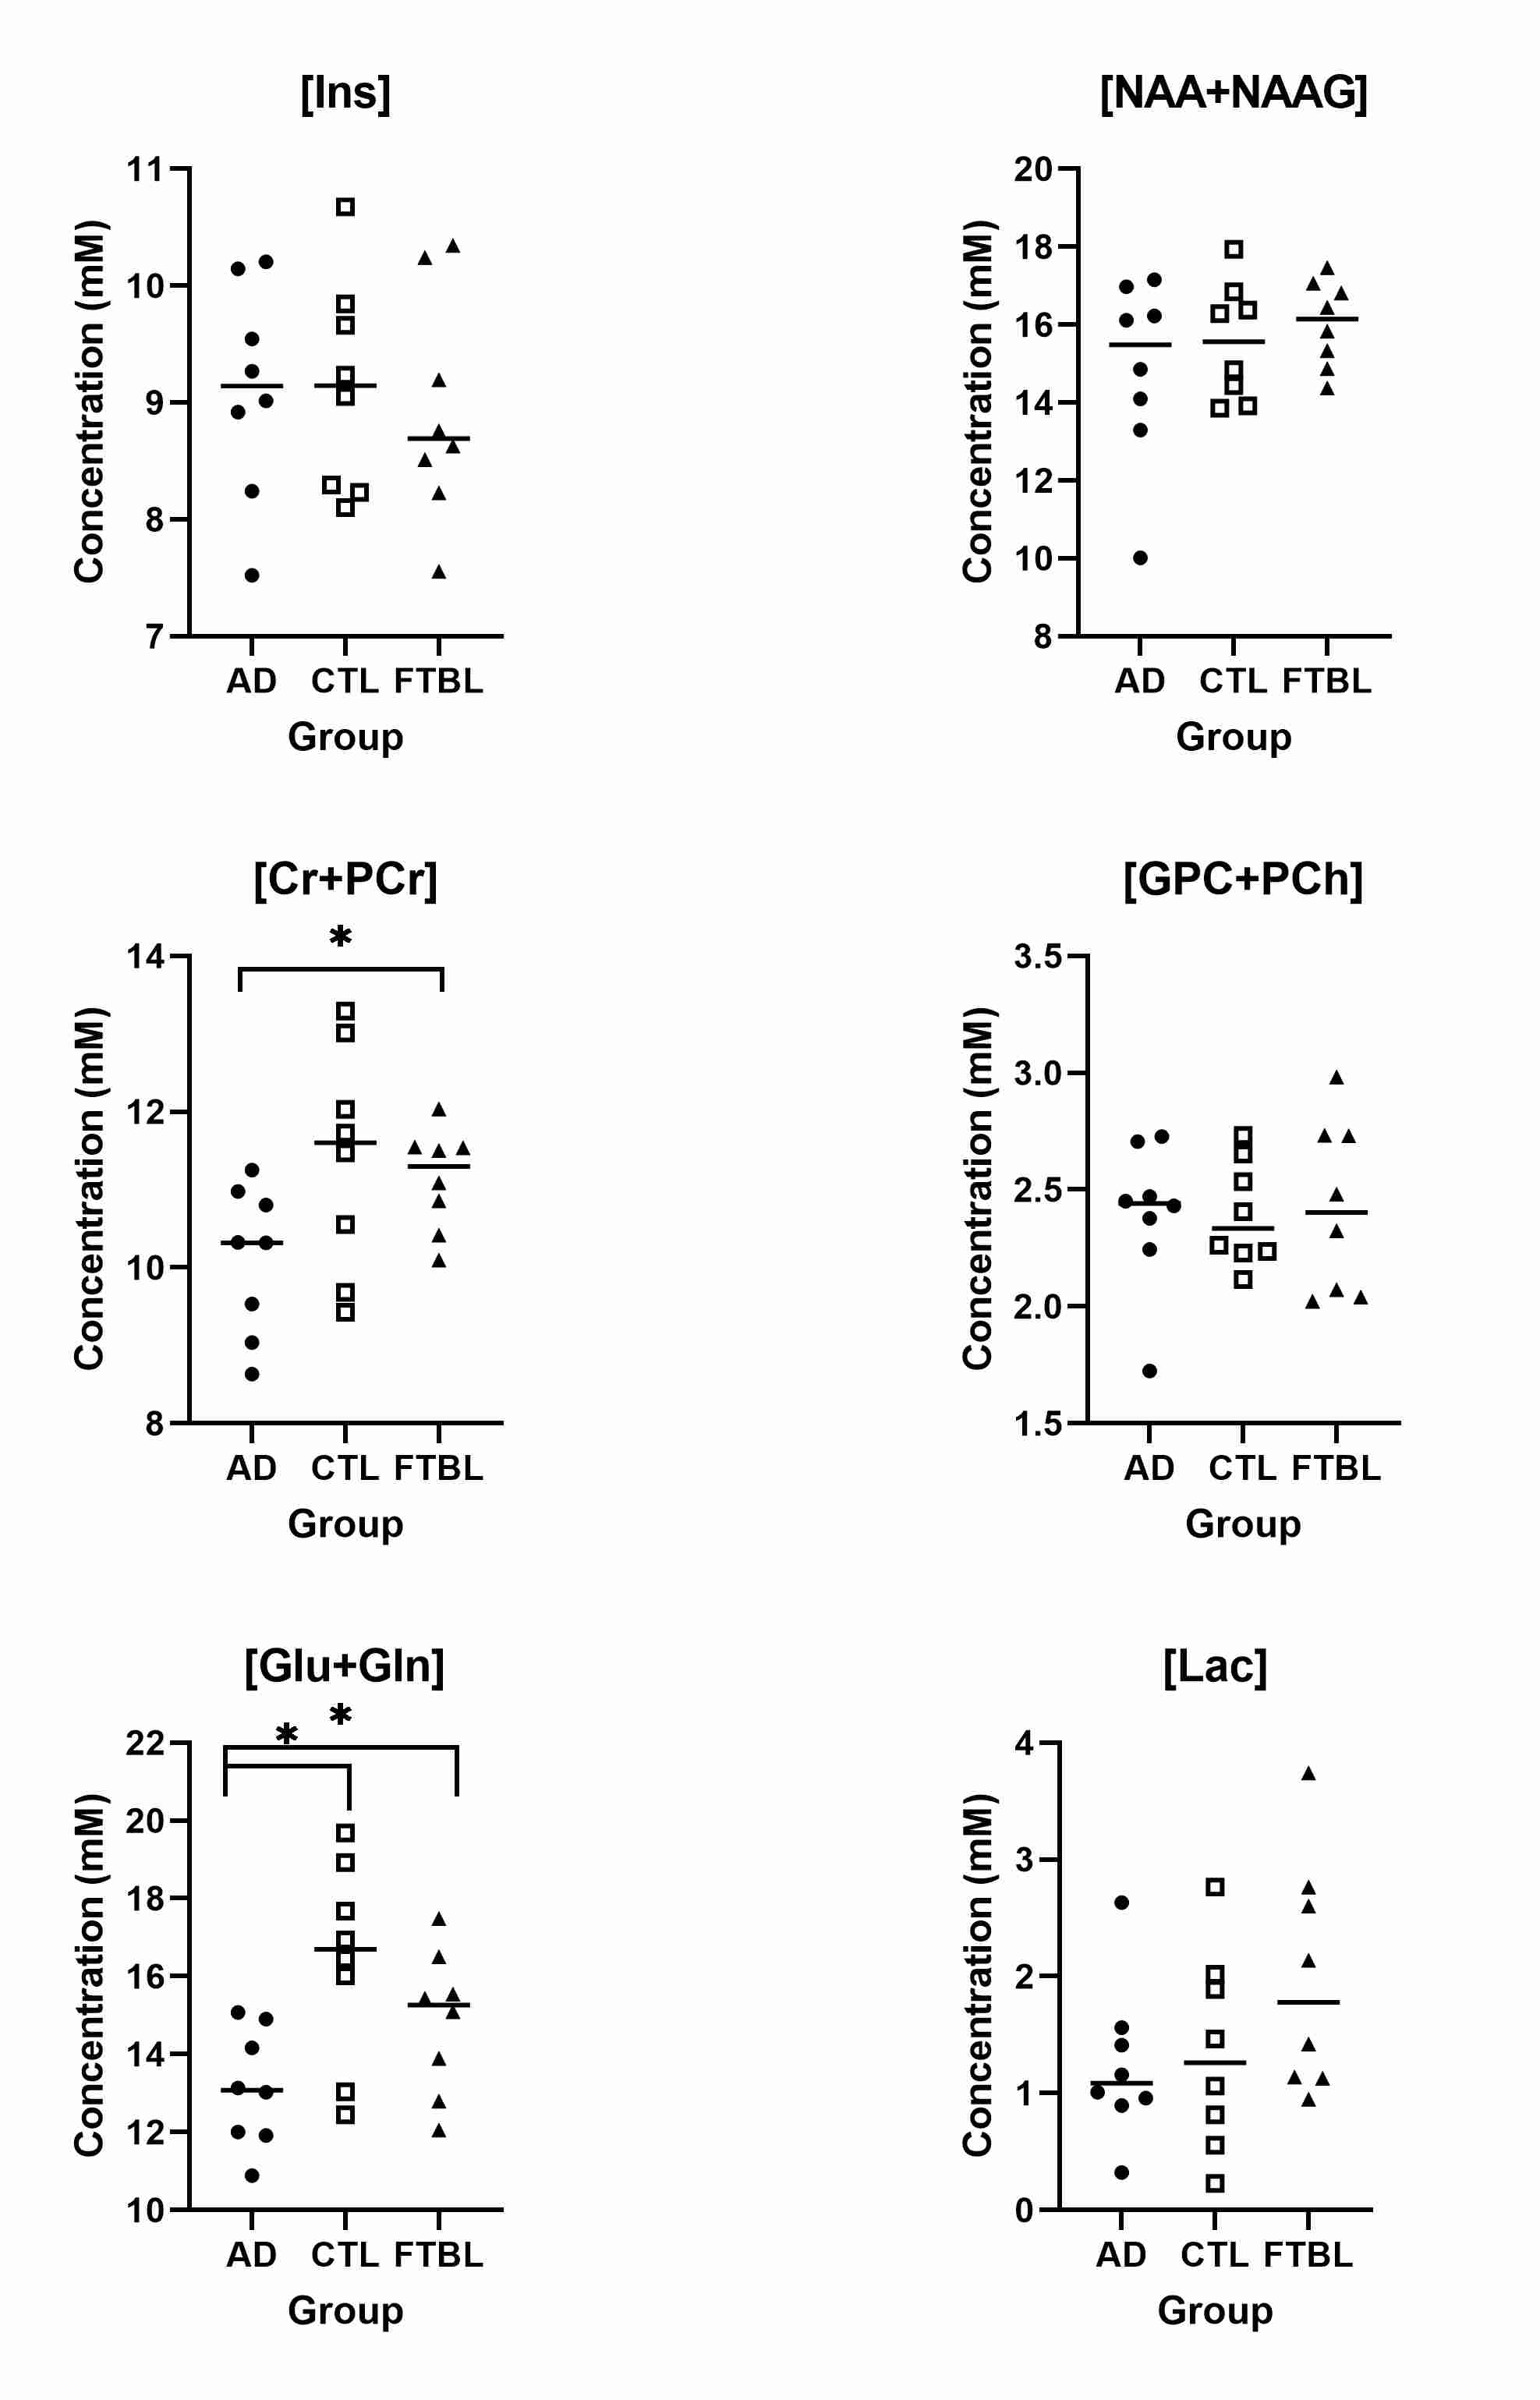
Fig 2. Scatterplot of metabolites with mean in the Alzheimer
Disease (AD), control (CTL) and football players (FTBL) groups for myo-inositol
(Ins), total N-acetyl aspartate (NAA+NAAG), total creatine (Cr+PCr), total
choline (GPC+PCh), glutamate/glutamine (Glu+Gln), and lactate (Lac); * =
significant p-value (p ≤ 0.05)
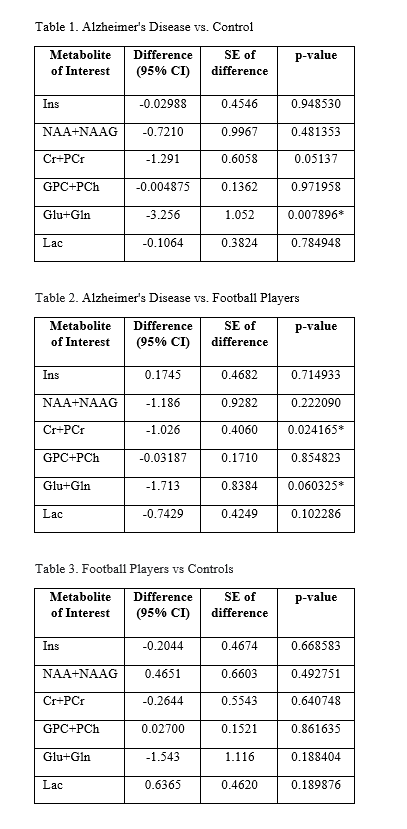
Fig 3. Multiple t-test comparison: Metabolite differences between two groups with standard error (SE) and p-value; * = significant p-value (p ≤ 0.05)
DOI: https://doi.org/10.58530/2023/2818